This section describes the DPL Debugger Tools, used to debug pipeline packets that DPL programs are processing in NVIDIA® BlueField®.
The debugger functions only with DPL programs compiled in these debug mode.
Introduction
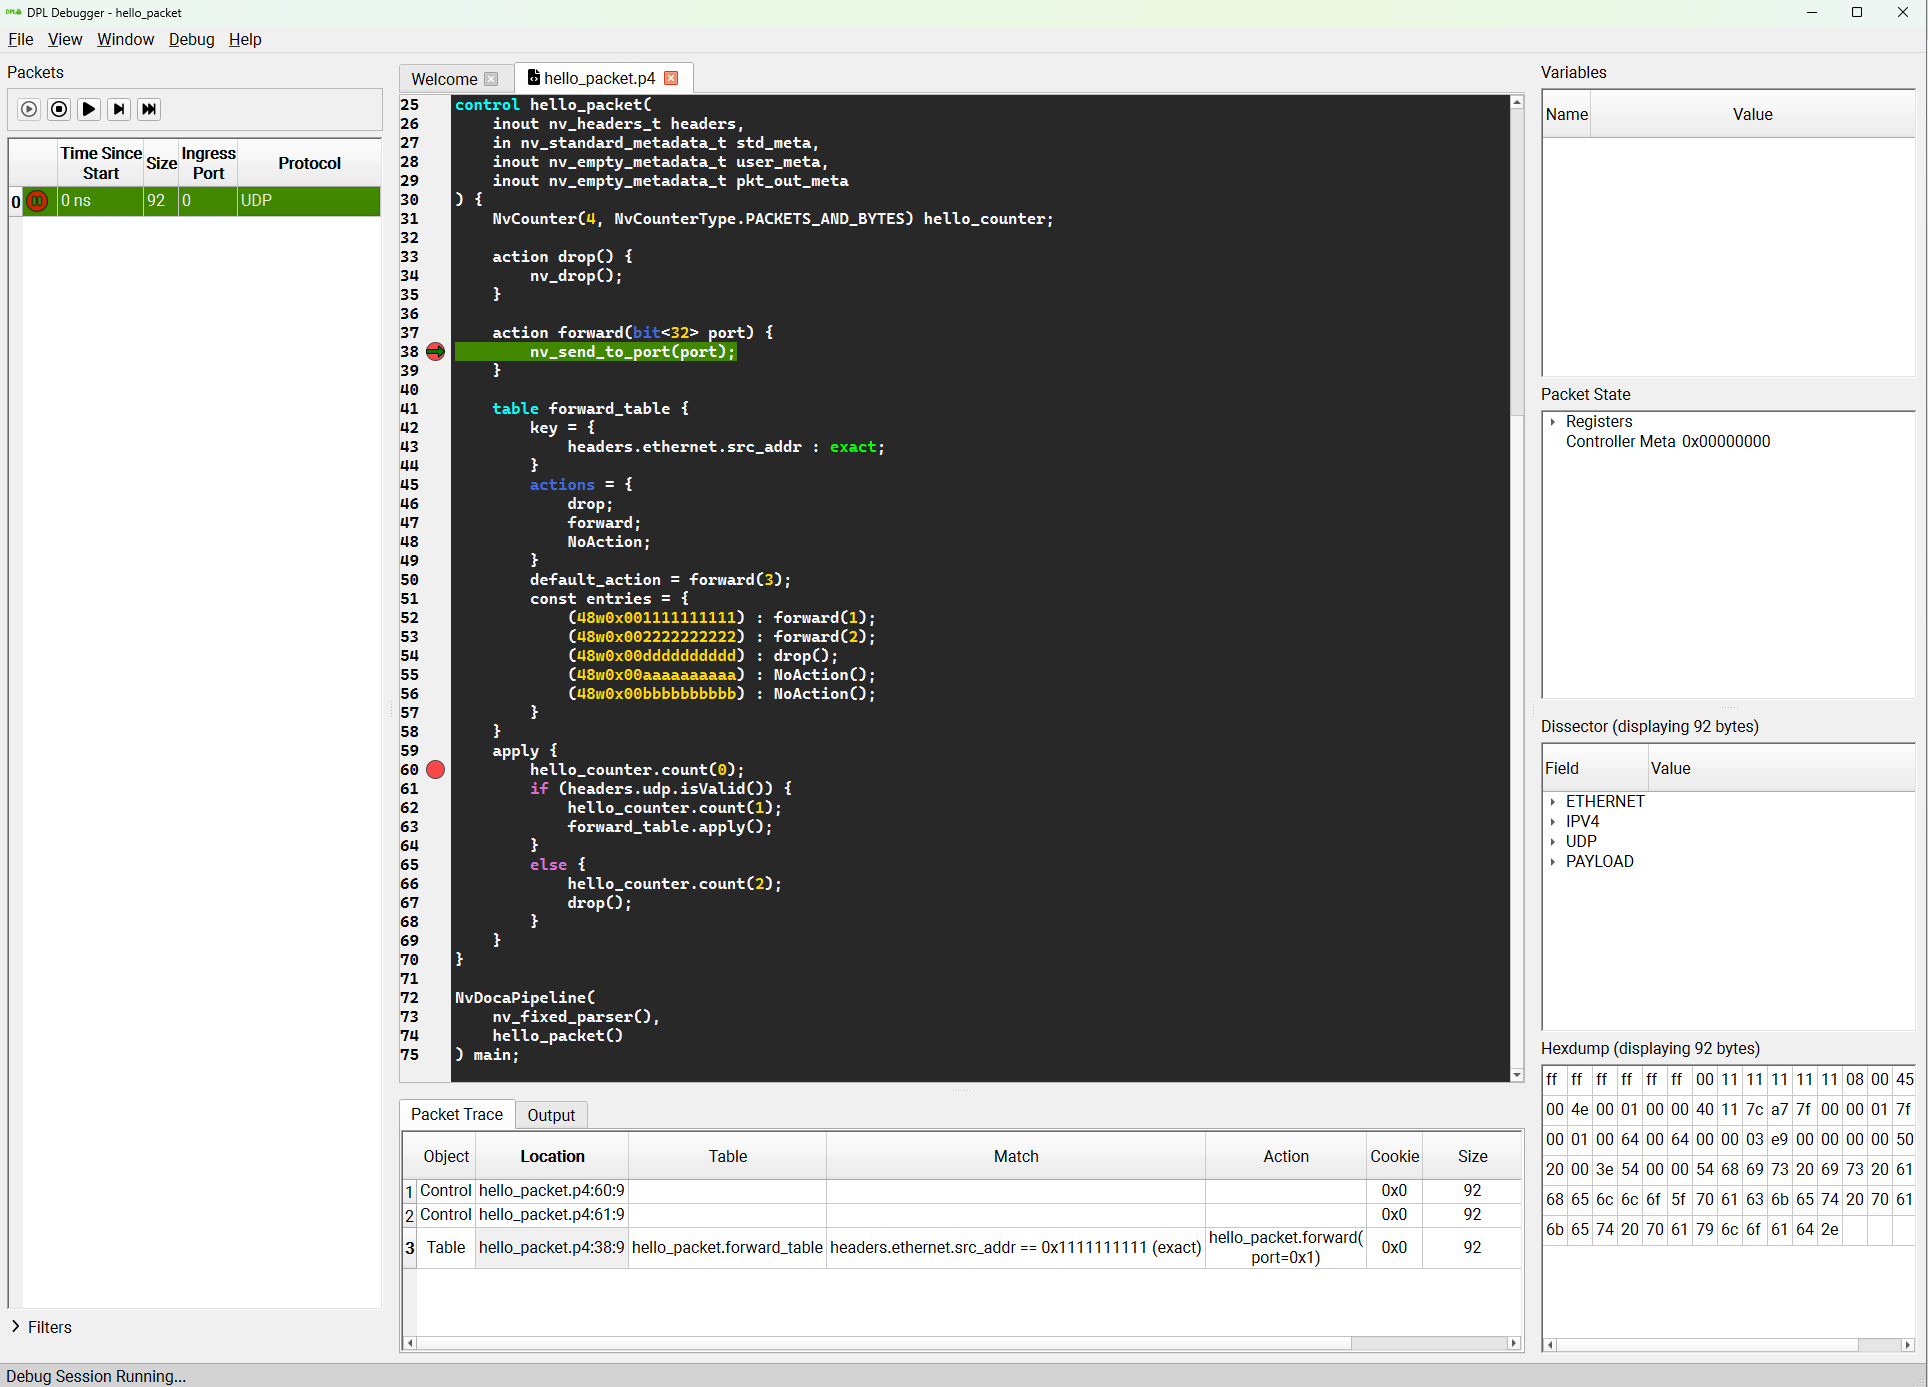
The DPL Debugger is a graphical user interface (GUI) application used to debug network packets processed by DPL programs on NVIDIA® BlueField® devices. It allows developers to trace packet flows throughout a DPL program's pipeline, inspecting detailed states at each stage.
For details, see the documentation on the extern function nv_send_debug_pkt.
Launching the Debugger
You can launch the DPL Debugger to either run a live debug session or analyze a pre-recorded session file. Running dpl debugger from the command line with no arguments opens the standard GUI.
Option A: Live Debug Session
Running a live session allows you to process, inspect, and reinject packets at runtime.
-
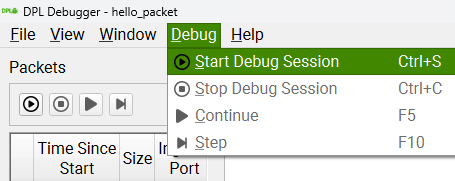
Click the Start Debug Session button, press Ctrl+S, or navigate to Debug → Start Debug Session.
-
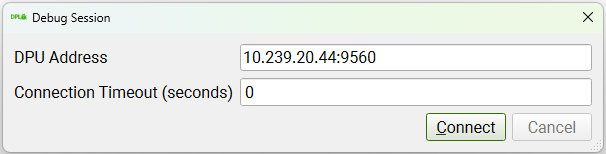
Enter the DPU address, port (default is 9560), and connection timeout (use 0 for no timeout), then click Connect.
-
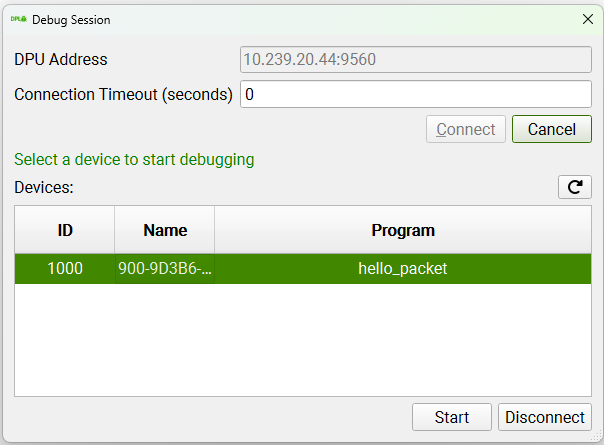
Select the desired device and click Start.
Option B: Pre-recorded Debug Session
Pre-recorded sessions are .tar.gz archives generated using the nspect debug command.
-
Via CLI: Specify the archive path when launching the tool:
dpl debugger hello_packet.tar.gz -
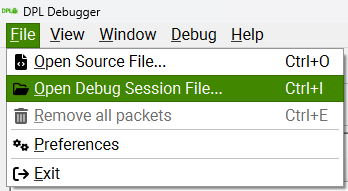
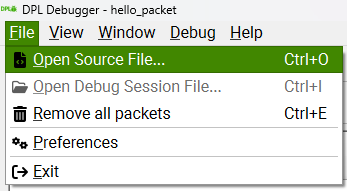
Via GUI: Click File → Open Debug Session File and select the archive.
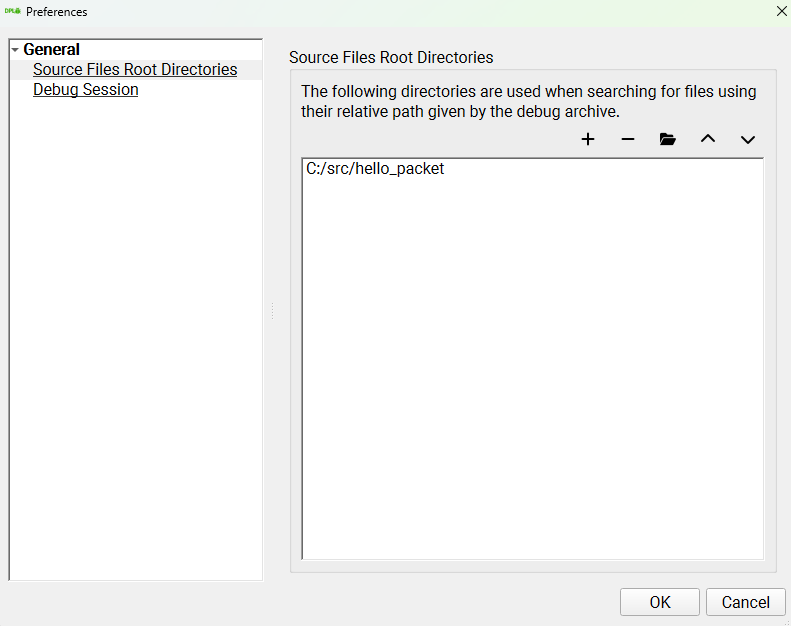
Setting Source Directories
To ensure the debugger can display the relevant code when a debug point is hit, configure the location of your DPL program sources.
-
Navigate to File → Preferences.
-
Set the search paths for your DPL source files.
Debug Workflow
Enabling Debug Points
When a live session starts, all debug points in the program are disabled by default. Packets flow through the pipeline unaffected until a debug point is enabled.
To enable a debug point:
-
Open the source file within the debugger (File → Open Source File).
-
Click the left margin next to the desired line, or place your caret on the line and press F9.
If a line does not have an associated debug point, the next available debug point will be enabled instead.
The available debug points to enable depend on which debug mode you compiled the program with.
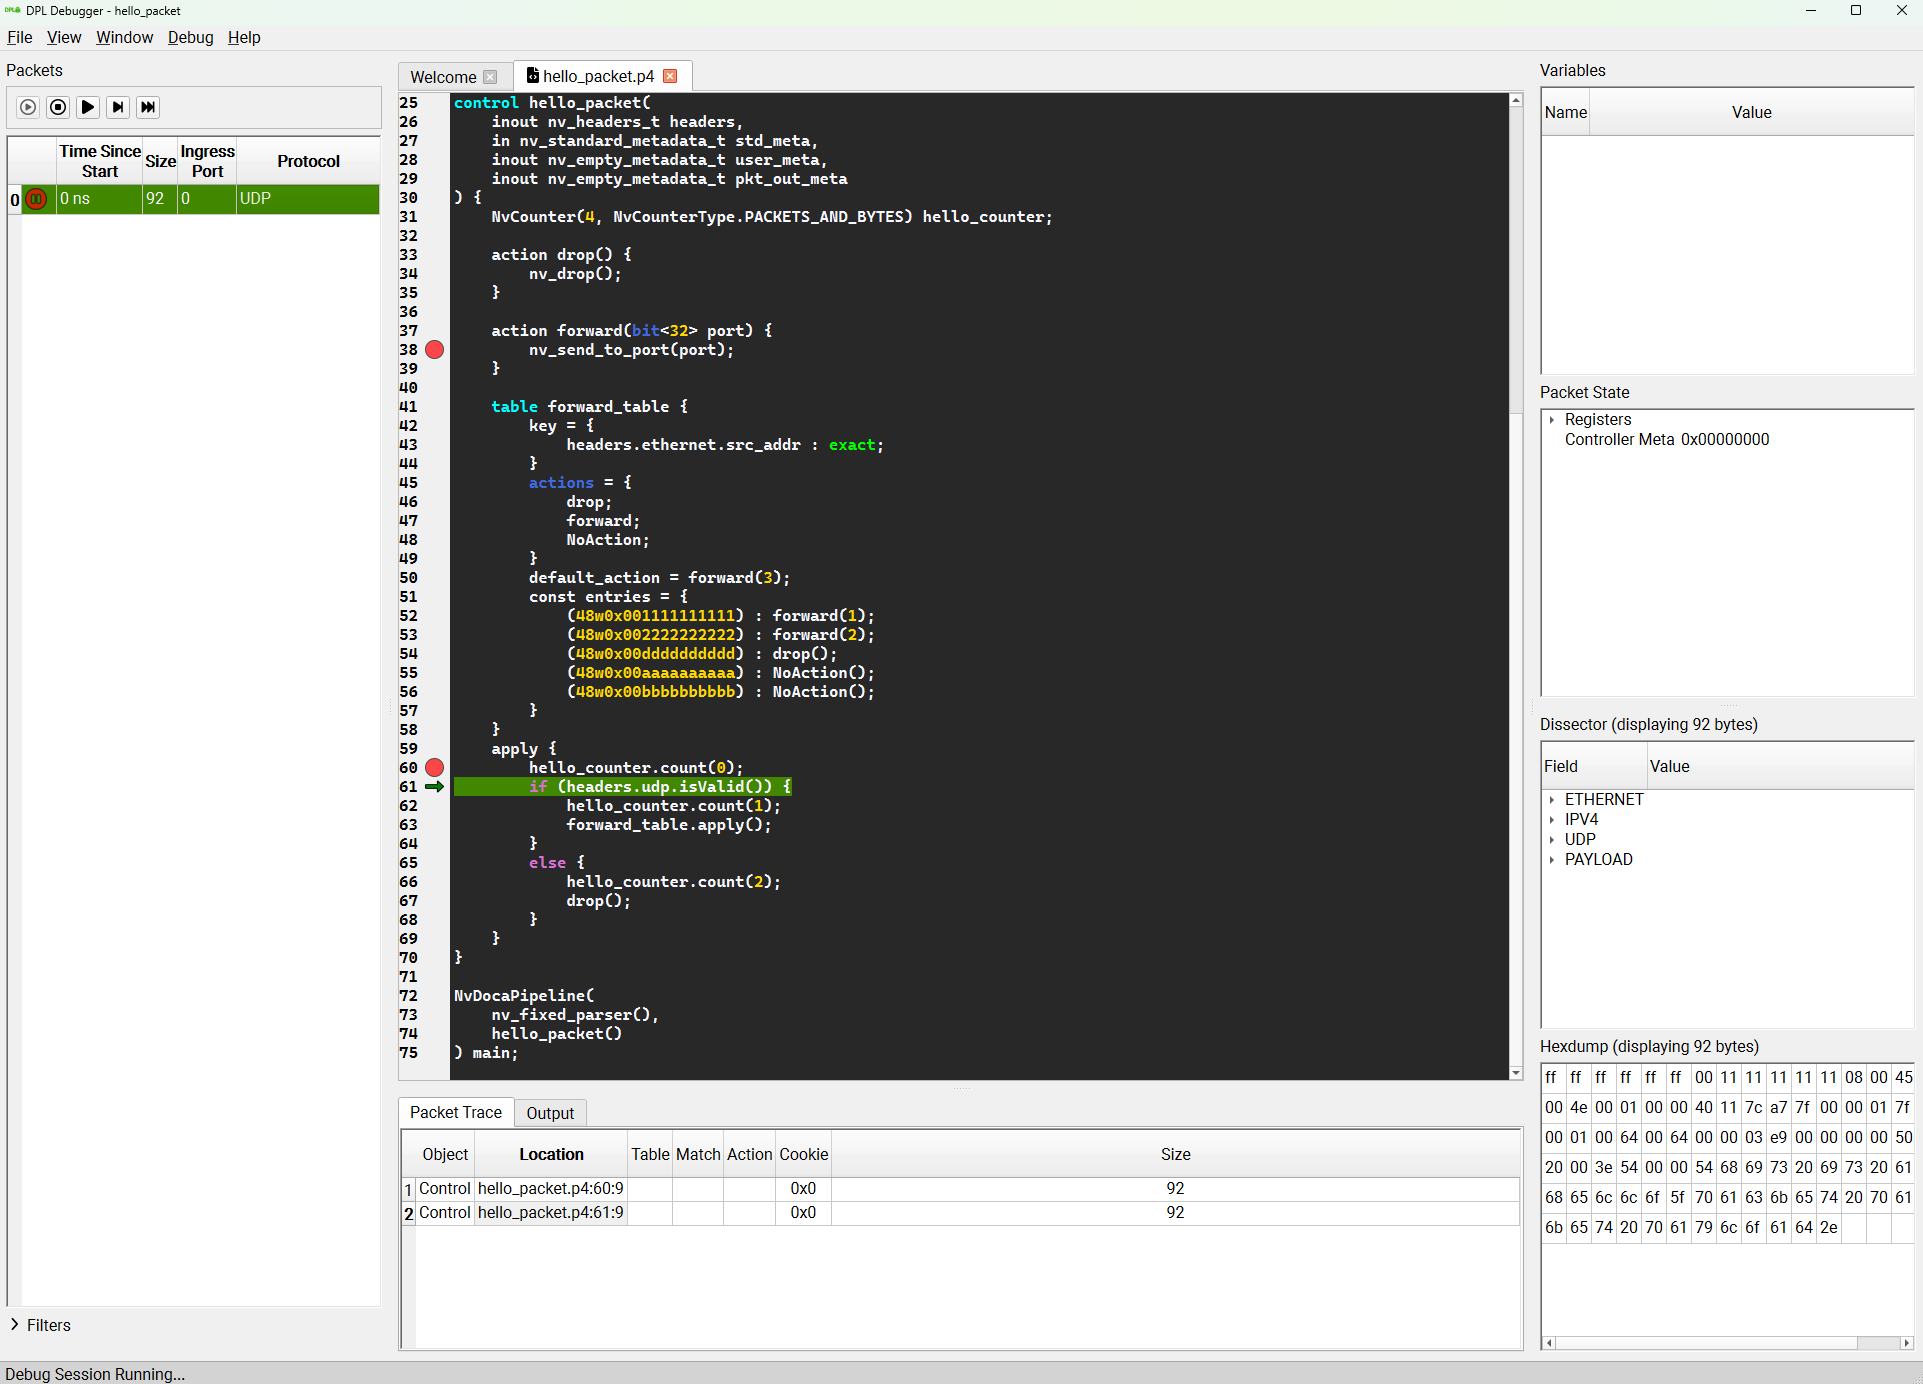
Inspecting and Editing Packets
When a packet hits an enabled debug point, it is sent to the debugger.
-
A red icon indicates the packet is currently paused by the debugger.
-
A green arrow indicates the specific debug point where the packet is halted.

Once paused, you can edit the packet's content using either the Dissector or the Hexdump views. For example, you can edit the packet's protocol from TCP to UDP directly within the Dissector.
Advancing the Pipeline
After inspecting or editing a paused packet, inject it back into the pipeline using one of the following commands under the Debug menu:
-
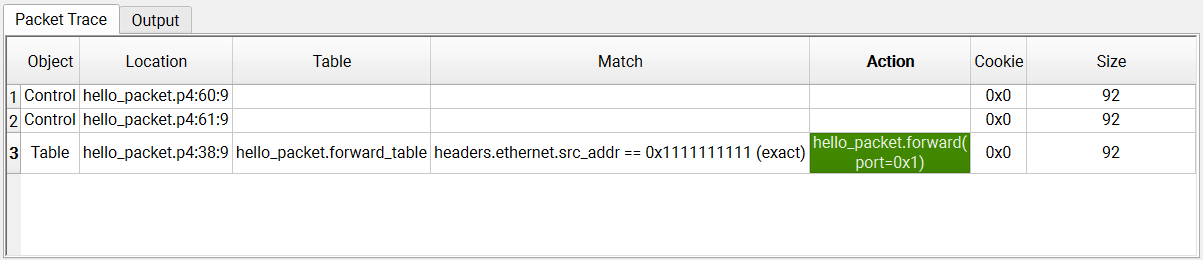
Step: Advances the packet to the very next line, even if no breakpoint is explicitly enabled there. This creates a new row in the Packet Trace widget.
-
Continue: Advances the packet until it hits the next enabled breakpoint. If no further breakpoints exist, the packet finishes its pipeline and the pause icon disappears.
-
Continue with trace: Functions like Continue, but records and displays the trace of all debug points the packet passed through along the way.
The packet in the Packets list correlates to the first row in the Packet Trace list. Changes made to the packet (e.g., size or protocol) will only be reflected in the subsequent row of the Packet Trace after reinjection.
Example Debugging Scenario
The following example demonstrates tracing a simple match/action pipeline.
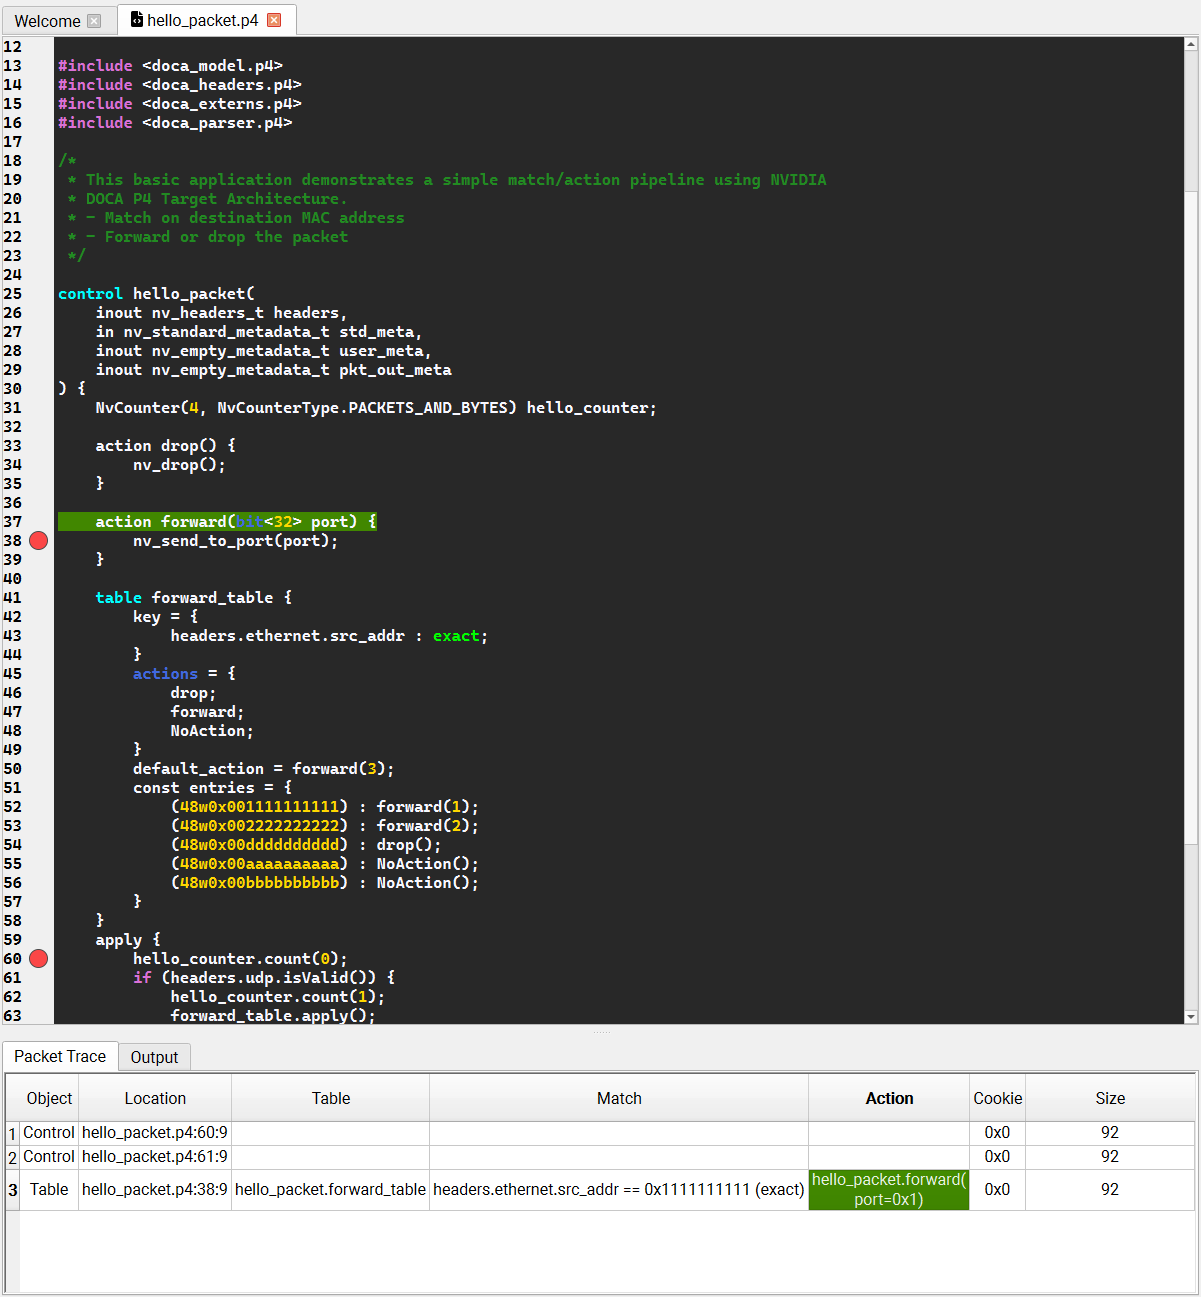
The DPL Program (hello_packet.p4)
This program matches on a destination MAC address and either forwards or drops the packet. It was compiled with the debug-mode=auto flag.
#include <doca_model.p4>
#include <doca_headers.p4>
#include <doca_externs.p4>
#include <doca_parser.p4>

control hello_packet(
    inout nv_headers_t headers,
    in nv_standard_metadata_t std_meta,
    inout nv_empty_metadata_t user_meta,
    inout nv_empty_metadata_t pkt_out_meta
) {
    NvCounter(4, NvCounterType.PACKETS_AND_BYTES) hello_counter;

    action drop() {
        nv_drop();
    }

    action forward(bit<32> port) {
        nv_send_to_port(port);
    }

    table forward_table {
        key = {
            headers.ethernet.src_addr : exact;
        }
        actions = {
            drop;
            forward;
            NoAction;
        }
        default_action = forward(3);
        const entries = {
            (48w0x001111111111) : forward(1);
            (48w0x002222222222) : forward(2);
            (48w0x00dddddddddd) : drop();
            (48w0x00aaaaaaaaaa) : NoAction();
            (48w0x00bbbbbbbbbb) : NoAction();
        }
    }
    apply {
        hello_counter.count(0);
        if (headers.udp.isValid()) {
            hello_counter.count(1);
            forward_table.apply();
        }
        else {
            hello_counter.count(2);
            drop();
        }
    }
}

NvDocaPipeline(
    nv_fixed_parser(),
    hello_packet()
) main;
Sending Traffic (send_hello_packet.py)
Assuming port p1 is connected via loopback to p0, this Python script sends a TCP packet to the pipeline.
from scapy.all import IP, TCP, Ether, Packet, Raw, sendp

packet = (Ether(src='00:11:11:11:11:11', dst='ff:ff:ff:ff:ff:ff') /
          IP() /
          TCP(sport=100, dport=100, seq=1001, flags='P') /
          Raw(load=b'This is a hello_packet packet payload.'))

sendp(packet, "p1", count=1)
Execution & Trace
-
The packet arrives at the debugger and pauses at the enabled breakpoint.
-
Clicking Step creates a new row in the trace and moves the packet to the next line.
-
If you edit the packet in the Dissector (e.g., changing TCP to UDP) and click Continue, the packet diverges based on your edit (satisfying the
ifstatement) and pauses at the next breakpoint.
UI Reference: Widgets
The DPL Debugger provides multiple widgets to analyze packet states and system health:
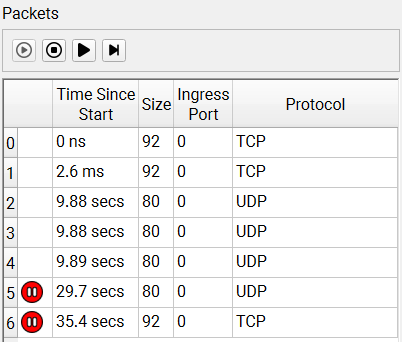
Packet List
Displays packets sent to the debugger. Selecting a packet reveals its trace. (Clear this list via File → Remove all packets).
Packet Trace
Each row represents a single debug point hit. Selecting a row reveals the packet data, state, and pipeline at that exact moment.
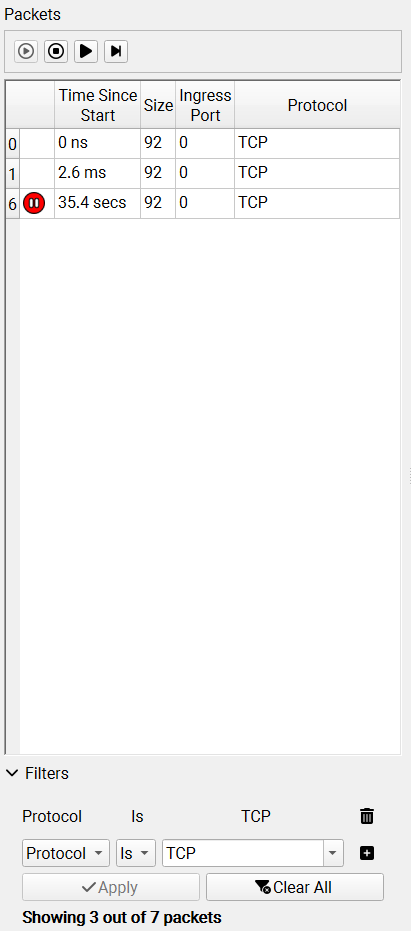
Filter
Allows packet filtering by Table Name, Action, Match Field, Match Type, Match Value, Ingress Port, Packet Size, or Protocol.
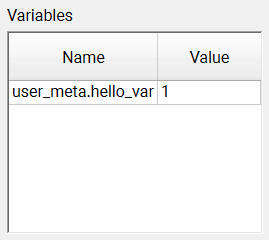
Variables
Displays the program's defined variables and their values at the selected debug point.
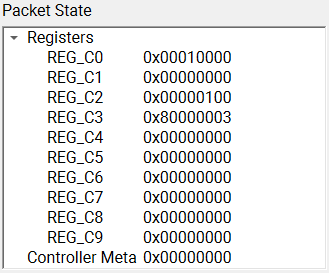
Packet State
Displays low-level variables, such as registers and controller metadata.
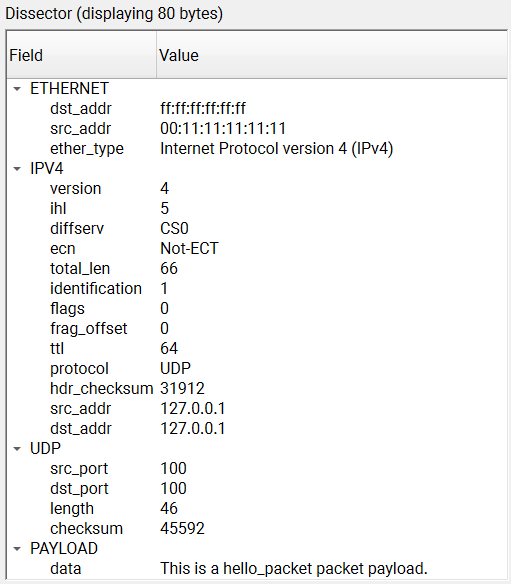
Packet Dissector
Displays the parsed packet. Paused packets can be edited by double-clicking values or pressing F2. (Values are shown/edited in decimal format and translated upon saving).
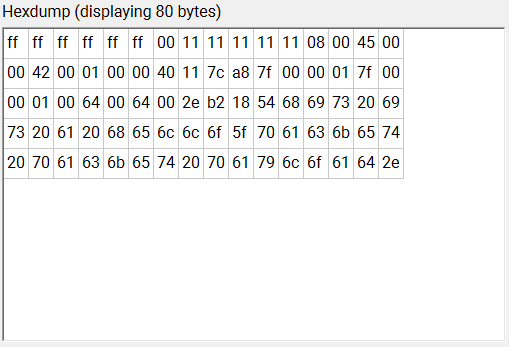
Hex Dump
Displays a raw hexadecimal dump of the packet. Double-click or press F2 to edit.
Source Code
Displays DPL source files. Clicking objects with source correlations (tables, actions, debug points) will automatically open the relevant file.
Pipeline
Displays the selected packet's pipeline (View → Pipeline Graph). Clicking a trace row highlights the corresponding debug point in the graph. 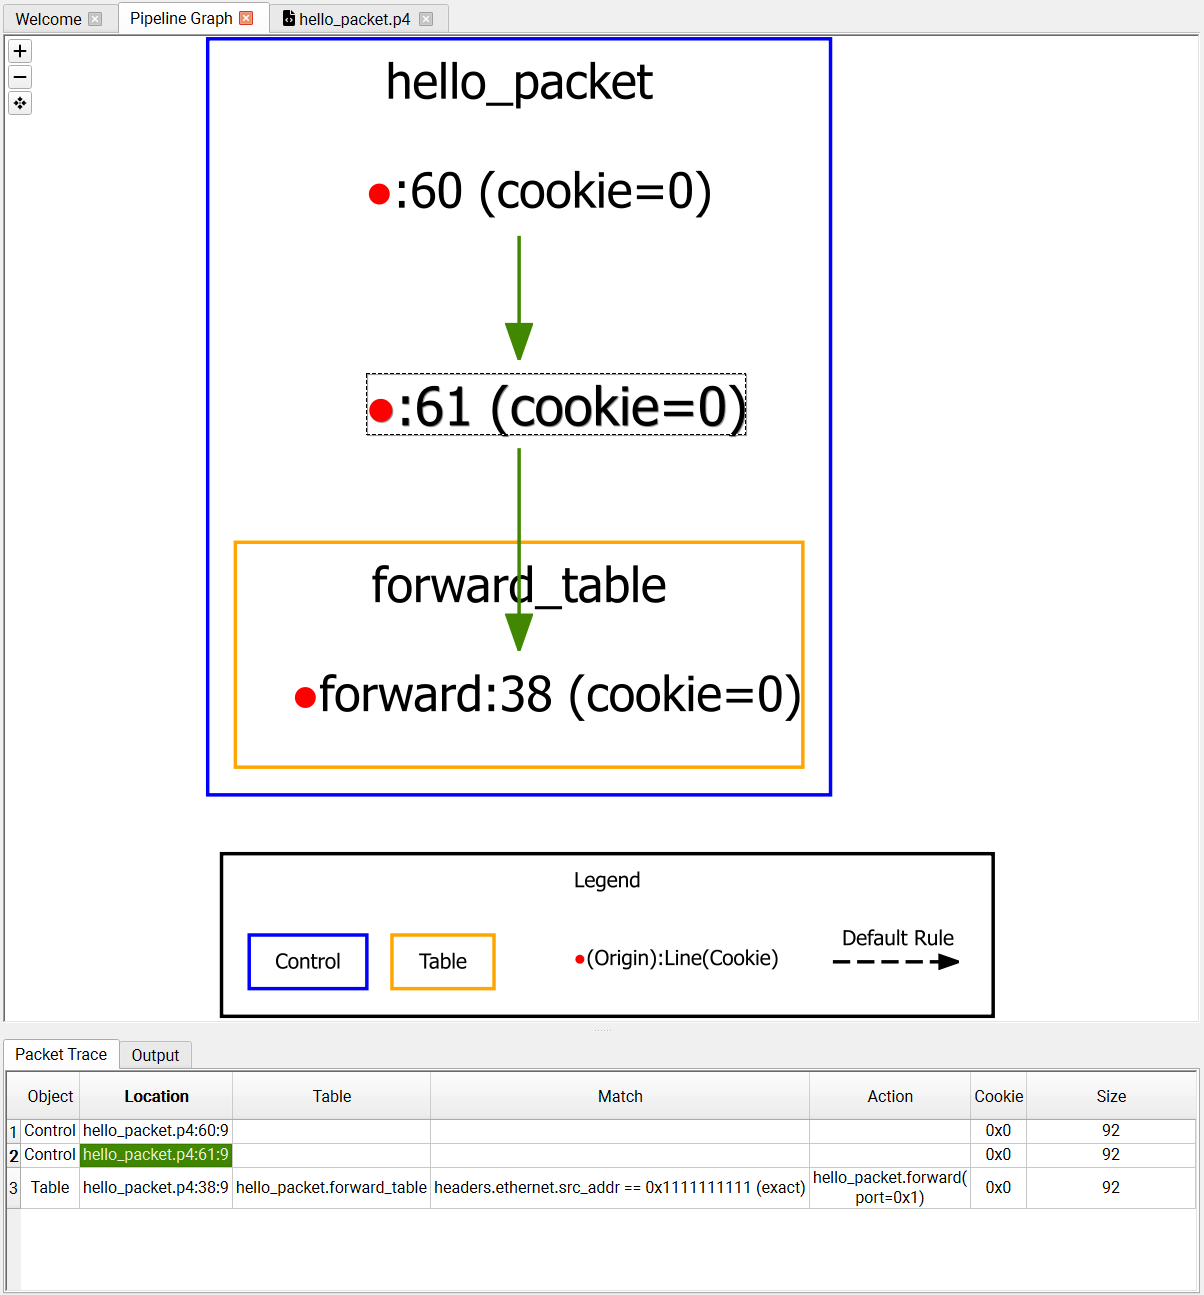
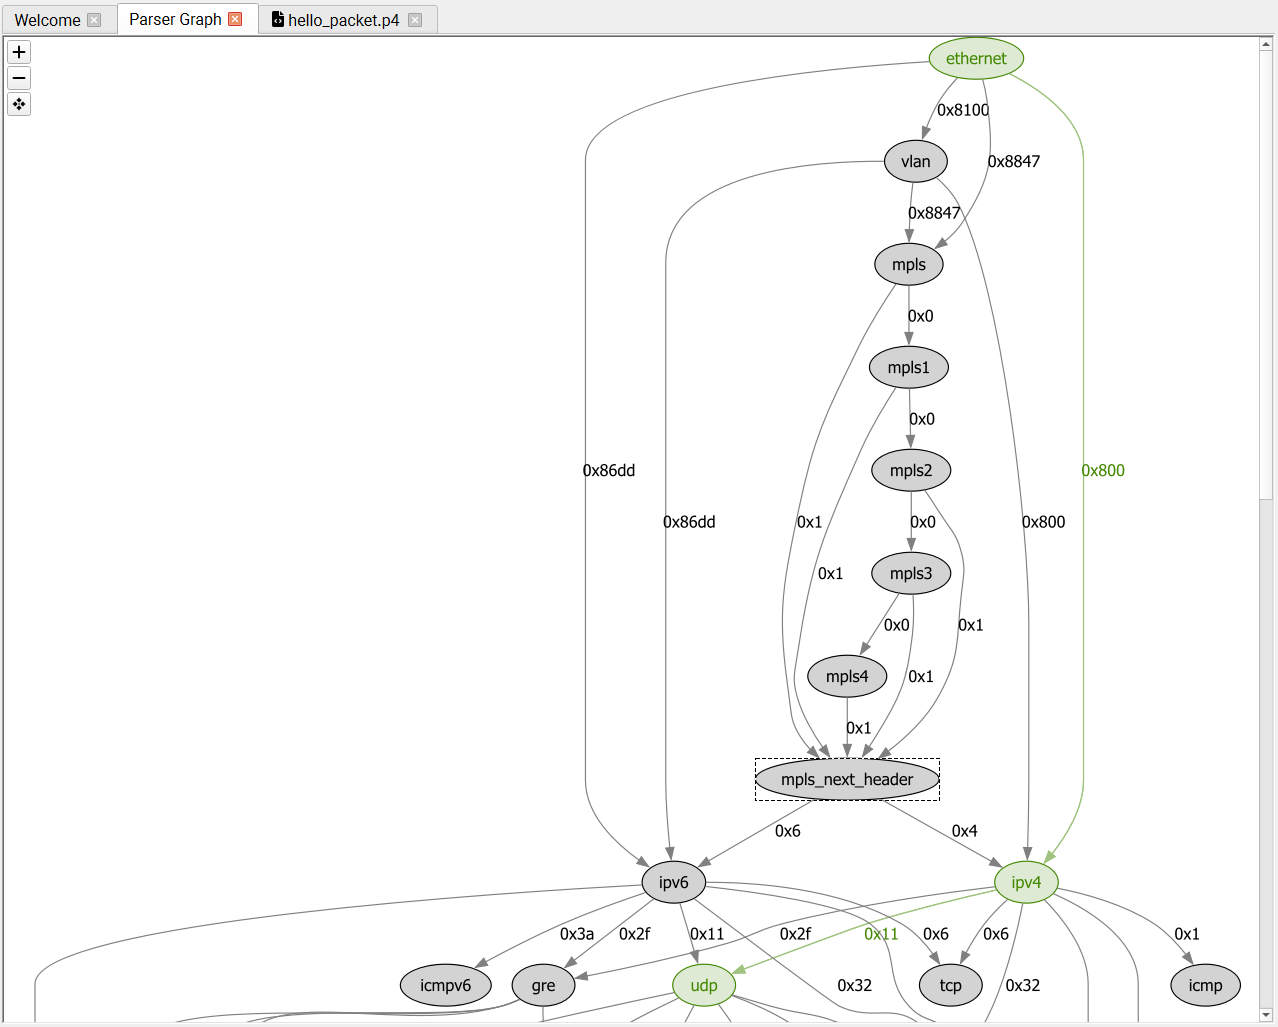
Parser
Displays the complete parser graph (both user-defined flex nodes and hardware-fixed nodes) and outlines how the selected packet was parsed (View → Parser Graph).
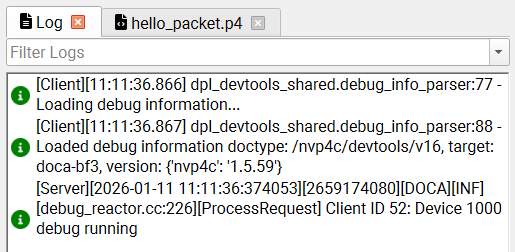
Log
Displays internal DPL Runtime daemon logs, filterable by severity (View → Log).
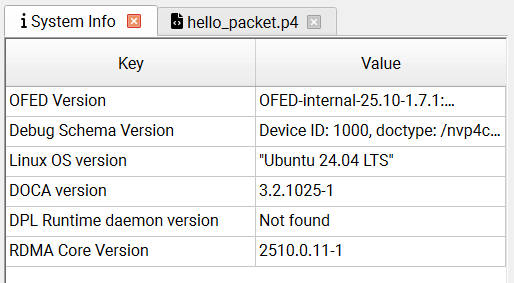
System Info: (View → System Info) Displays target system information.
Release Notes
New Features
|
Feature |
Description |
|---|---|
|
Correlated hexdump and dissector |
Added highlighting, selecting a state or field in the dissector now highlights the corresponding bytes in the hexdump, and vice versa. |
|
Source code keyboard controls |
Enabled keyboard interaction in the code viewer. A caret is now visible and starts at the first line, it can be moved with the mouse or keyboard. Press |
|
Graph view buttons |
Added zoom-in/zoom-out/fit-to-view buttons to the graph views. |
|
Auto reinject checkbox |
Added a checkbox to automatically reinject filtered-out packets as they arrive, so the debug session is not interrupted by filtered packets. |
|
Paused packets checkbox |
Added a checkbox to filter out unpaused packets from the packets table, so you can focus on paused packets only. When unchecked, both paused and unpaused packets are shown. |
|
Externs column |
Added an "Externs" column to the packet trace table, showing the externs associated with the table entry that the packet matched and their details. |
Bug Fixes
-
Code viewer syntax highlighting losing its bold weight after the window was resized.
-
When a graph is not available, a placeholder message is now shown instead of a blank view.
-
Packet filters using the "Is", "Is Not", "Starts With", or "Ends With" operators raise an exception when applied to fields that resolve to multiple values (such as match keys with several fields).
-
Packets table's filter dropdowns not refreshing their available values after the packets table was cleared.
-
Packet variables and packet details panes not keeping even proportions when their pane was resized.
-
Packet state transitions during a debug session are more consistent and predictable.
Last updated: