This page provides installation, configuration, and usage instructions for the DOCA Argus Service.
1. Introduction
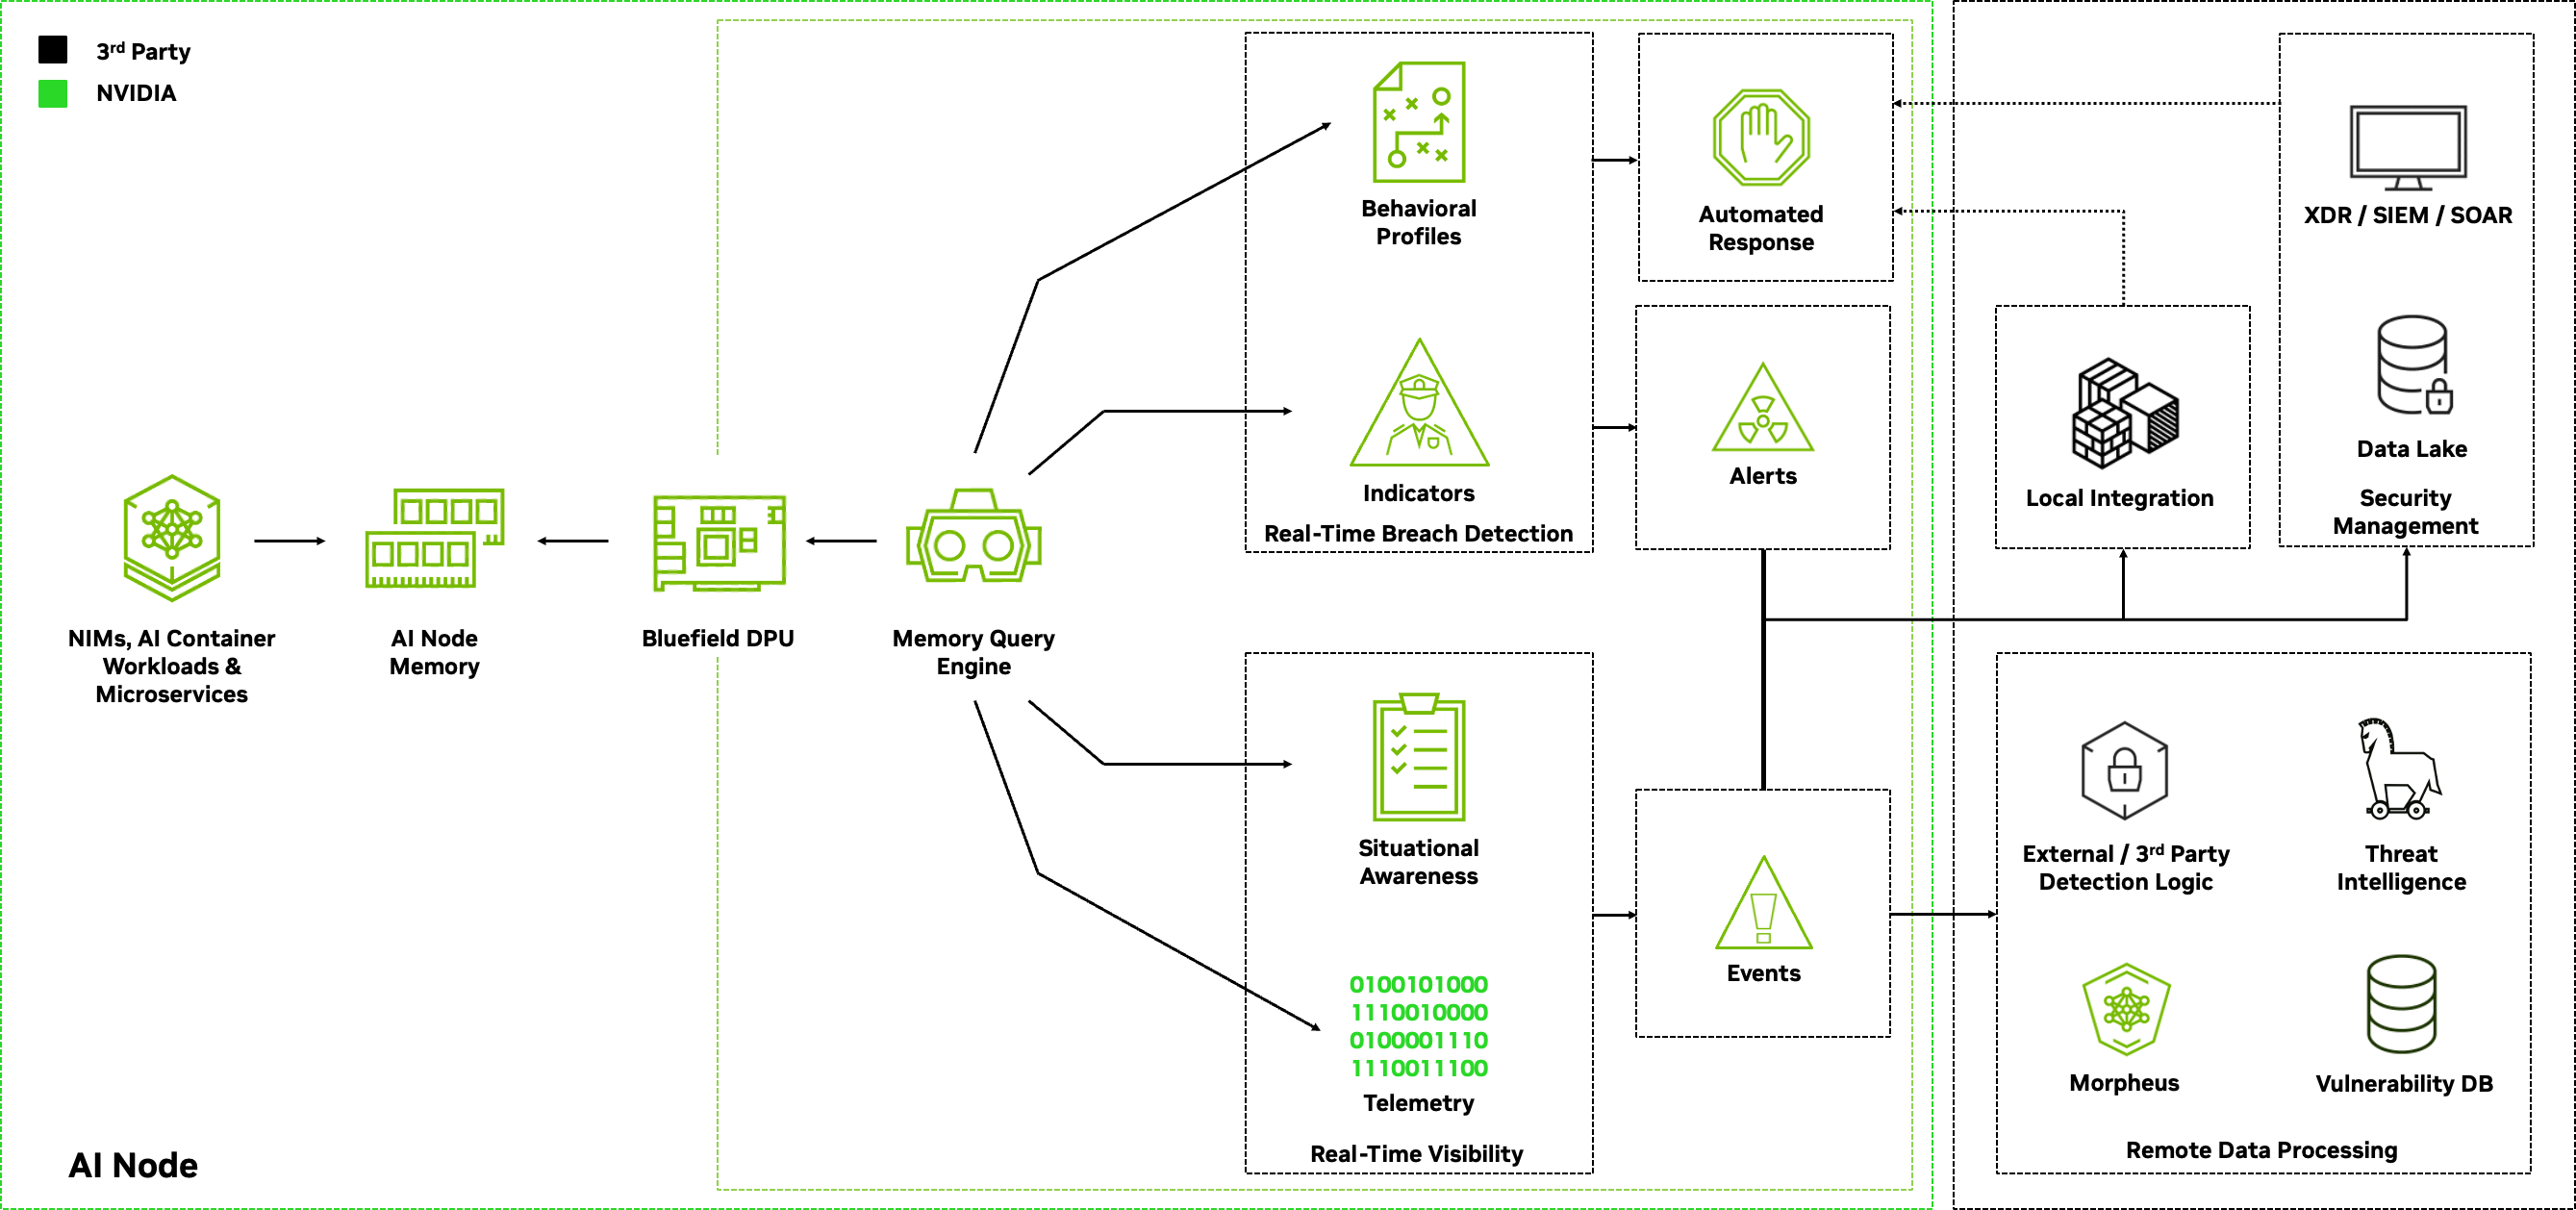
DOCA Argus is a DOCA service running on NVIDIA® BlueField® networking platforms, designed to immediately detect and enable response to attacks, minimizing their potential impact and risk.
The DOCA Argus framework provides real-time situational awareness and runtime threat detection by inspecting host memory using advanced memory forensics. Live machine introspection is performed at the hardware level, analyzing specific snippets of volatile host memory to monitor threats in real time without impacting system performance. DOCA Argus does not violate privacy, as information is extracted only from kernel structures.
Unlike conventional tools, Argus runs independently of the host, requiring no agents, integration, or reliance on host-based resources. This agentless, zero-overhead design enhances system efficiency and ensures resilient security in any compute environment, including bare-metal, virtualized, containerized, and multi-tenant infrastructures. By operating outside the host, isolated in its own trust domain, DOCA Argus remains invisible to attackers—even if the system is compromised.
Cybersecurity professionals can integrate DOCA Argus with SIEM, SOAR, and XDR platforms for continuous monitoring, incident response, and automated threat mitigation, extending existing capabilities into AI infrastructure environments.
NVIDIA BlueField provides built-in, data-centric protection for AI workloads at scale. Combining BlueField's acceleration capabilities with DOCA Argus' proactive threat detection enables cloud service providers and enterprises to secure AI factories without compromising performance or efficiency.
A single BlueField card with DOCA Argus can monitor an entire node.
2. Operation
Raw activities are collected from host memory and used to outline the operational state of a workload. DOCA Argus uses DOCA DMA to access and inspect host memory. Accessed memory is decoded into logical information (e.g., process and thread data). A policy engine processes these activities, filtering irrelevant content and reporting only meaningful data.
Key concepts:
-
Event – One or more meaningful activities that represent the current recorded state. Provides situational awareness.
-
Alert – One or more meaningful activities that indicate an immediate threat or impact requiring investigation or response.
Events, alerts, and system activity messages are formatted in JSON and syslog, and logged locally. Data can be exported via Fluent Bit integration for delivery to security platforms and data lakes.
3. Requirements
-
Operates only on DPU targets (BlueField-2 or later).
-
Requires DPU mode (see BlueField Modes of Operation).
-
Requires firmware version 24.35.0388 or later.
-
Supported BlueField image versions: 4.11.0 or later.
-
Argus service container must run in privileged mode to enable full-system DMA reads.
4. Limitations
-
Tested only on KVM hypervisors.
-
Supports Linux-based OSs (bare-metal, virtualization, containers). Windows OS support planned.
-
Kata Containers are supported only if NVIDIA-DPU support is enabled.
-
Supports only x86 64-bit and AARCH64 architectures.
5. Prerequisites
-
Configure BlueField firmware. On BlueField, configure the PF BAR register:
dpu> mlxconfig -d /dev/mst/<mst_device> s PF_BAR2_SIZE=2 PF_BAR2_ENABLE=1Replace
<mst_device>with:-
mt41686_pciconf0for BlueField-2 -
mt41692_pciconf0for BlueField-3
-
-
Enable IOMMU passthrough (only if not already enabled).
Skip unless DMA fails with messages similar to the following in
dmesg:mlx5_core 0000:81:00.0: AMD-Vi: Event logged [IO_PAGE_FAULT ...]-
Edit GRUB config:
host> sudo vim /etc/default/grub -
Update
GRUB_CMDLINE_LINUX_DEFAULTwith :iommu=pt <intel/amd>_iommu=on -
Apply changes:
-
For Ubuntu:
sudo update-grub -
For CentOS/RHEL:
sudo grub2-mkconfig -o /boot/grub2/grub.cfg
-
-
Reboot.
-
Prepare the target system. Argus auto-generates the required symbol and memory-region config at runtime — skip this section unless auto-generation fails (see fallback below).
-
Manual fallback - generate symbol profile.
Prereqs (on target):-
For Ubuntu:
sudo tee /etc/apt/sources.list.d/ddebs.list << EOF deb http://ddebs.ubuntu.com/ $(lsb_release -cs) main restricted universe multiverse deb http://ddebs.ubuntu.com/ $(lsb_release -cs)-updates main restricted universe multiverse deb http://ddebs.ubuntu.com/ $(lsb_release -cs)-proposed main restricted universe multiverse EOF sudo apt install ubuntu-dbgsym-keyring sudo apt-get update sudo apt-get install linux-image-$(uname -r)-dbgsym -
For CentOS/RHEL:
sudo yum install --enablerepo=base-debuginfo \
  kernel-devel-$(uname -r) \
  kernel-debuginfo-$(uname -r) \
  kernel-debuginfo-common-$(uname -m)-$(uname -r)
-
-
Get
doca_apsh_config.pyonto the target. Pick one:-
If DOCA is already installed on the target: the script is at
/opt/mellanox/doca/tools/doca_apsh_config.py— use it in place. Skip to the next step. -
Otherwise, copy it from the BlueField (no DOCA install required on the target):
# From the target:
scp <bf-user>@<bf-ip>:/opt/mellanox/doca/tools/doca_apsh_config.py /tmp/
-
-
Install dwarf2json: download a release binary from volatilityfoundation/dwarf2json.
-
Create JSON files:
cd /opt/mellanox/doca/tools/
pip3 install psutil pdbparse
python3 doca_apsh_config.py --files memregions symbols --os <windows/linux> --path <path to dwarf2json>
cp /opt/mellanox/doca/tools/*.* <shared-folder>
dpu> scp <shared-folder>/* <path-to-app-shield-binary>
Re-run after every kernel update on the target.
-
6. Service Deployment
-
For DPU container deployment, see DOCA Container Deployment Guide.
-
For Argus-specific deployment, refer to the service container's page.
-
For offline deployment (no Internet access), see the Offline Deployment section in DOCA Container Deployment Guide.
7. Service Configuration
Argus configuration is managed via SERVICE_CONFIG_FILE in the container YAML.
7.1. Service
-
Immediate shutdown – Terminate immediately on SIGINT/SIGTERM (skip graceful shutdown).
-
Service log level – DOCA logging verbosity (default
50= INFO). Options:10=DISABLE,20=CRITICAL,30=ERROR,40=WARNING,50=INFO,60=DEBUG,70=TRACE. -
System scanner sleep time – Delay between scans (
s= seconds,m= minutes,ms= milliseconds).
7.2. DOCA Argus Configuration
-
Auto Scan – Scan all available systems unless
systemssection is defined. -
Profile Generation - When enabled, DOCA Argus automatically generates the kernel data it needs at runtime if no pre-built data available. This allows the service to monitor hosts running any kernel version out of the box. initialization phase may take longer in case of profile generation.
-
Default – Default configs applied if not overridden in
systems. -
Systems – List of monitored systems with overrides.
7.3. Per-System Configurations
-
Representor ID – VU ID of VF/PF to track.
-
PF –
host> lspci -vv -s <PF_pci_address> | grep VU | cut -d " " -f 4 -
VF – Append
VF<x>to PF's VU ID. Example:MT2333XZ06YAMLNXS0D0F0VF1
-
-
Memory regions path – JSON file path (or
auto) for host OS memory map. -
OS symbol path – JSON file path or directory (or
auto). -
OS type –
LinuxorWindows. -
DMA device name – Matches representor ID. List devices:
dpu> ibv_devinfo | grep 'hca_id' | awk '{print $2}' -
Service log level – Overrides service log verbosity.
-
SDK log level – Sets SDK logging verbosity.
-
Limits – Set max values for string length, processes, file descriptors, threads, VMAs.
-
Events
-
Container filter – Include/exclude containerized processes.
-
SBOM – List SHA signatures of approved executables/libraries.
-
7.4. Collection
-
Events – Enable/disable per event type.
7.5. Output
-
Log events to stdout – Enable standard output logging.
-
Log folder path – Directory for file logs.
-
Log threshold size – Rotate logs at this size.
-
Log max files count – Max number of rotated logs.
-
Telemetry address – Aggregator address.
-
Telemetry tag – Tag for Fluent Bit integration.
-
Telemetry format –
JSONorsyslog. -
Telemetry user data – Custom user-defined metadata.
8. Log Types
8.1. Standard Output
Displays only important service logs, such as version information, successful startups, and error messages on failures.
8.2. Debug Log Output
Provides a complete log output for debugging, including partial event data, trace logs, collection failures, and more. These logs are stored in the /var/log/doca_argus/ directory.
8.3. Event Log Output
Stores a complete event log in JSON format in the log folder path specified in the service configuration file. For local log storage, log rotation is handled by Linux logrotate. You can override the default configuration in /etc/cron.d/logrotate and /etc/logrotate.d/argus.
8.4. Telemetry Output
The Argus service can produce telemetry records in JSON or syslog formats.
By default, telemetry is disabled. To enable it, set the telemetry_address parameter in the service configuration file and ensure telemetry_tag matches the tag used in your Fluent Bit configuration.
Telemetry has been tested with Fluent Bit integration, which should run independently from the Argus service.
For example, running Fluent Bit locally on the DPU alongside the Argus service can be configured with the following input section:
[INPUT]
    Name                  tcp
    Tag                   <your preferred tag>
    Listen                0.0.0.0
    Port                  24224
    Format                json
If you are using Splunk, add the following encapsulation filter to the Fluent Bit configuration file:
[FILTER]
    Name                  nest
    Match                 *
    Operation             nest
    Wildcard              *
    Nest_under            event
Fluent Bit is flexible and can integrate with many output destinations.
The following is a basic example that forwards telemetry data to Elasticsearch:
[INPUT]
    Name                  tcp
    Tag                   elastic_forward_input
    Listen                0.0.0.0
    Port                  24224
    Format                json

[SERVICE]
    Log_Level             info

[OUTPUT]
    Name                  es
    Match                 *
    Host                  <elasticsearch_ip>
    Port                  <elasticsearch_port>
    Index                 argus
    Suppress_Type_Name    On
    Log_Level             info
To run Fluent Bit with this configuration:
docker run --rm --net=host -v <path_to_fluentbit_conf_file>:/fluent-bit/etc/fluent-bit.conf --name fluent_bit -it fluent/fluent-bit
Refer to the Fluent Bit manual for details on additional output plugins and configurations.
9. Output
The DOCA Argus service generates structured output messages containing detailed metadata, system information, and activity data.
The following table describes the fields included in each message:
|
Parameter |
Data Type |
Parent Object |
Description |
|---|---|---|---|
|
|
object |
— |
Root-level object containing the message metadata. |
|
|
enum |
|
Name of the vendor. Value: |
|
|
enum |
|
Name of the product. Value: |
|
|
string |
|
Product version. |
|
|
enum |
|
Can be |
|
|
enum |
|
Severity of the event/alert/system activity ( |
|
|
string |
|
Schema format version used by the message. |
|
|
string |
|
Unique message identifier. |
|
|
string |
|
ISO_8601 timestamp when the message occurred. |
|
|
string |
|
Time zone of the message origin. |
|
|
string |
|
Configured user data. |
|
|
object |
|
Information about the BlueField system. |
|
|
array |
|
List of all configured BlueField interfaces, including their names, IP addresses, and MAC addresses. |
|
|
string |
|
Interface name. |
|
|
string |
|
MAC address of the interface. |
|
|
string/array |
|
IPv4 addresses associated with the interface. |
|
|
string/array |
|
IPv6 addresses associated with the interface. |
|
|
object |
|
Information about the monitored workload system. |
|
|
string |
|
Unique ID of the target system (system name in configuration or VUID for auto-scanned systems). |
|
|
string |
|
OS version of the workload ( |
|
|
string |
|
Unique identifier of the current workload kernel boot. |
|
|
string |
|
Hostname of the workload system. Not refreshed until Argus restarts. |
|
|
array |
|
List of all workload interfaces, including their names, IP addresses, and MAC addresses. |
|
|
string |
|
Interface name. |
|
|
string |
|
MAC address of the interface. |
|
|
string/array |
|
IPv4 addresses associated with the interface. |
|
|
string/array |
|
IPv6 addresses associated with the interface. |
|
|
object |
|
Details about the activity reported. |
|
|
string |
|
Name of the event/alert/system activity. |
|
|
object |
|
Detailed information about the collector that triggered the event or alert. |
|
|
object |
|
Details about parent activities that triggered the current activity. |
The following example is a JSON message that describes the data that produced for each event and alert:
{
    "vendor_name": "NVIDIA",
    "product_name": "DOCA_ARGUS",
    "product_version": "<version>",
    "message_type": "<EVENT | ALERT | SYSTEM_ACTIVITY>",
    "severity": "<INFO | ERROR | WARNING | MEDIUM | HIGH | CRITICAL>",
    "schema_version": "1.0",
    "message_id": "<unique_message_id>",
    "occurred_message_time_iso_8601_ns": "2025-10-22T07:31:46.905224659+00:00",
	"message_timezone": "UTC",
    "user_data": "NONE",
    "bluefield_system_information": {
        "bluefield_networking_interfaces": {
            "0": {
                "bluefield_network_interface_name": "<>",
            	"bluefield_network_interface_mac_address": "<>",
            	"bluefield_network_interface_ipv4_address": "<>"
				"bluefield_network_interface_ipv6_address": "<>"
            },
             "1": {
                "bluefield_network_interface_name": "<>",
            	"bluefield_network_interface_mac_address": "<>",
            	"bluefield_network_interface_ipv4_address": "<>"
				"bluefield_network_interface_ipv6_address": "<>"
            },
			"..."
        }
    },
    "workload_information": {
        "unique_identifier": "<>",
        "os_version": "<>",
		"boot_uuid": "<>",
		"hostname": "<>",
        "workload_networking_interfaces": {
            "0": {
                "network_interface_name": "<>",
                "network_interface_mac_address": "<>"
				"network_interface_ipv4_address": "<>",
 				"network_interface_ipv6_address": "<>",
            },
             "1": {
                "network_interface_name": "<>",
                "network_interface_mac_address": "<>"
				"network_interface_ipv4_address": "<>",
 				"network_interface_ipv6_address": "<>",
            },
            "..."
        }
    },
    "activity_data": {
        "name": "<the name of the EVENT | ALERT | SYSTEM_ACTIVITY>",
        -- Activity Details to follow per the type of EVENT | ALERT | SYSTEM_ACTIVITY --
    }
}
10. Supported Alerts, Events and System Activity Messages
DOCA Argus monitors workload and system behavior in real time, generating alerts, events, and system activity messages that provide visibility into security-relevant activities, operational state changes, and detected anomalies. These messages are categorized by type, severity, and activity name, with descriptions to help identify their purpose and implications.
The tables in this section outline the supported activities that Argus can detect, covering a broad range of categories including process creation and termination, network connections, execution of binaries and libraries, process memory changes, file descriptor operations, thread creation and termination, container lifecycle events, and key system service milestones or errors.
10.1. Creation or Modification of System Processes
|
Type |
Severity |
Activity Name |
Remarks |
|---|---|---|---|
|
Event |
Info |
Process Created |
A new process has been detected. |
|
Event |
Info |
Process Terminated |
A process has been terminated. |
|
Event |
Warning |
Process Zombie |
Detects a process in a zombie state. |
|
Alert |
High |
Process Hidden |
Detects a process in a hidden state. |
10.2. Network Connections
|
Type |
Severity |
Activity Name |
Remarks |
|---|---|---|---|
|
Event |
Info |
Network Connection Created |
A new TCP network connection has been created. |
|
Event |
Info |
Network Connection Terminated |
A TCP network connection has been terminated. |
|
Alert |
Low |
TCP Connection Excessive Data |
Monitors a TCP connection's incoming or outgoing data volume that exceeds a configurable threshold (separate thresholds for incoming and outgoing traffic). |
|
Alert |
Low |
TCP Long-Lasting Connection |
Monitors a TCP connection whose total duration exceeds a configurable time threshold. |
|
Event |
Info |
TCP Network Connection State Change |
Monitors changes in the state of TCP network connections (for example, SYN_SENT, SYN_RECEIVED). |
|
Event |
Info |
TCP Network Connections Status |
Provides a periodic (configurable) summary of currently open TCP connections per process, including packet and byte counts. Disabled by default. |
10.3. Reverse Shell
|
Type |
Severity |
Activity Name |
Remarks |
|---|---|---|---|
|
Alert |
High |
Reverse Shell Detected |
Detects a process, or a chain of cooperating processes, relaying an external network connection to a shell or a command interpreter.
|
10.4. Executed Binaries and Loaded Libraries (Software Bill of Materials/Process Attestation)
|
Type |
Severity |
Activity Name |
Remarks |
|---|---|---|---|
|
Alert |
High |
Foreign Binary Executed |
Detects execution of a binary not included in the original container image or modified from it. May indicate that an attacker has control of the workload and is executing arbitrary commands. |
|
Alert |
High |
Binary Executed Not as Intended |
Detects execution of a binary from the original container image with command-line arguments and/or from a folder path not matching those in the original container image. |
|
Alert |
High |
Foreign Binary Executed – File Size Mismatch |
Detects execution of a binary whose reported file size differs from the file size of the corresponding binary in the original container image. |
|
Alert |
High |
Foreign Library Loaded |
Detects loading of a library not included in the original container image or modified from it. May indicate that an attacker has control of the workload and is running arbitrary code. |
|
Alert |
High |
Foreign Library Loaded – File Size Mismatch |
Detects loading of a library whose reported file size differs from the file size of the corresponding library in the original container image. |
10.5. Process Memory
|
Type |
Severity |
Activity Name |
Remarks |
|---|---|---|---|
|
Event |
Info |
Process Memory Created |
A new virtual memory area (e.g., heap, stack, executable) has been created. Default: off. |
|
Event |
Info |
Process Memory Terminated |
A virtual memory area is no longer visible (terminated). Default: off. |
|
Event |
Warning |
New Executable Anonymous Memory Mapped |
An executable anonymous memory area has been mapped. |
|
Alert |
Medium |
Executable Permissions Added |
Executable permissions have been added to a memory area. |
|
Alert |
Medium |
Executable Permissions Removed |
Executable permissions have been removed from a memory area. |
|
Event |
Info |
New File Mapped |
A new memory-mapped file has been detected. |
|
Event |
Info |
File Unmapped |
A memory-mapped file has been unmapped. |
10.6. File Descriptors
|
Type |
Severity |
Activity Name |
Remarks |
|---|---|---|---|
|
Event |
Info |
File Descriptor Open |
A new file descriptor has been opened. |
|
Event |
Info |
File Descriptor Close |
A file descriptor has been closed. |
|
Alert |
Medium |
File Descriptor File Content Change |
File Descriptor with write permissions has been closed, and its content may have changed (only for regular files). |
10.7. Threads
|
Type |
Severity |
Activity Name |
Remarks |
|---|---|---|---|
|
Event |
Info |
Thread Created |
A new thread has been created. |
|
Event |
Info |
Thread Terminated |
A thread has been terminated. |
10.8. Containers
|
Type |
Severity |
Activity Name |
Remarks |
|---|---|---|---|
|
Event |
Info |
Container Started |
A new container instance has been detected. |
|
Event |
Info |
Container Terminated |
A container has been terminated. |
10.9. Shell History
|
Type |
Severity |
Activity Name |
Remarks |
|---|---|---|---|
|
Event |
Info |
Shell Command Executed |
A new shell command has been executed. |
|
Alert |
High |
Shell History Cleared |
Shell's history has been cleared. Could be indicator for an attack. |
|
Alert |
High |
Shell History Disabled |
Shell's history has been disabled. Could be indicator for an attack. |
Currently, only "bash" processes are supported (i.e., not sh, zsh, etc).
10.10. System Events
|
Type |
Severity |
Activity Name |
Remarks |
|---|---|---|---|
|
System Activity |
Info |
Service Initialization Started |
The DOCA Argus initialization process has started. |
|
System Activity |
Info |
Service Initialization Successful |
The DOCA Argus initialization process completed successfully. |
|
System Activity |
Error |
Service Initialization Failed |
DOCA Argus failed to initialize. |
|
System Activity |
Error |
Service Runtime Failure |
Critical internal service error; DOCA Argus is offline. |
|
System Activity |
Info |
Service Gracefully Shutdown |
DOCA Argus has been successfully shut down following a user request. |
|
System Activity |
Error |
Details Gathering Failed |
Failed to collect required information. |
|
System Activity |
Info |
Host Initialization Started |
Workload detection process has started. |
|
System Activity |
Info |
Host Initialization Successful |
Workload detection process completed successfully. |
|
System Activity |
Error |
Host Initialization Failed |
Workload detection process failed. |
|
System Activity |
Info |
OS Identifier Found |
Successfully detected the underlying OS of the workload. |
|
System Activity |
Info |
OS Identifier Discovery Extended |
Detection of the workload OS is taking longer than expected. |
|
System Activity |
Info |
Loading Profile Candidate |
Identified an OS profile to use. |
|
System Activity |
Info |
Profile Verification Successful |
Successfully initialized using the identified OS profile. |
|
System Activity |
Error |
Profile Verification Failed |
Initialization using the identified OS profile failed; DOCA Argus will attempt subsequent profile candidates. |
|
System Activity |
Error |
Profile Parsing Failed |
DOCA Argus failed to parse the OS profile. |
|
System Activity |
Error |
No Matching Profile Found |
No matching OS profile has been found. |
|
System Activity |
Error |
Unable to Determine Target OS |
Failed to detect the underlying OS of the workload. |
|
System Activity |
Medium |
Process Limit Reached |
Reached the configured limit for the number of processes to monitor. |
|
System Activity |
Medium |
File Handles Limit Reached |
Reached the configured limit for the number of file handles to monitor. |
|
System Activity |
Medium |
Process Memory Limit Reached |
Reached the configured limit for the number of virtual address descriptors to monitor. |
|
System Activity |
Medium |
Threads Limit Reached |
Reached the configured limit for the number of threads to monitor. |
11. Attributes
The following attributes are currently provided for processes, TCP network connections, file handles, threads, process memory, and SBOM/process attestation.
For requests regarding the extraction of additional attributes, please contact NVIDIA.
11.1. Processes
|
Attribute |
Description |
|---|---|
|
|
Command name of the process. |
|
|
Unique process identifier. |
|
|
Thread-group-change indicator (e.g., incremented on |
|
|
SHA256 hash of the process' executable. |
|
|
SHA1 hash of the process' executable. |
|
|
MD5 hash of the process' executable. |
|
|
File size, in bytes, of the process' executable. |
|
|
Absolute path to the process' executable. |
|
|
Absolute path of the folder this process has been executed from. |
|
|
Command line arguments used to start the process. |
|
|
Process creation time in iso_8601 format (based on the workload's local time). |
|
|
Parent process identifier. |
|
|
Real user ID of the process owner. |
|
|
Real group ID of the process owner. |
|
|
Effective user ID of the process owner. |
|
|
Effective group ID of the process owner. |
|
|
Current state of the process. |
|
|
Number of CPU cycles consumed by the process. |
|
|
Container ID, if the process is part of a container. |
|
|
Namespace for process identifiers. |
|
|
Namespace for mount points. |
|
|
Namespace for network resources. |
11.2. Threads
|
Attribute |
Description |
|---|---|
|
|
Unique thread identifier. |
|
|
Thread-group-change indicator (e.g., incremented on |
|
|
Thread’s exit state. |
11.3. File Descriptors
|
Attribute |
Description |
|---|---|
|
|
File Descriptor FD identifier. |
|
|
A descriptive name for the file descriptor (e.g., the absolute path for a regular file). |
|
|
File Descriptor's type. |
|
|
File Descriptor's mode - WRITE_ONLY/READ_WRITE/APPEND/LARGE_FILE/... |
|
|
File Descriptor's inode number. |
|
|
File Descriptor's device identifier. |
|
|
File Descriptor's File read write execute permissions. |
|
|
File Descriptor's UID. |
|
|
File Descriptor's GID. |
|
|
File's size. |
|
|
Indicates whether or not the current file has been deleted. |
|
|
File's sha1 hash (only for file_descriptor_file_content_change). |
|
|
File's sha256 hash (only for file_descriptor_file_content_change). |
|
|
File's MD5 hash (only for file_descriptor_file_content_change). |
|
|
List of identifiers of threads which use this File Descriptor. |
|
|
Files change time in iso_8601 format (workload time). |
|
|
Files modification time in iso_8601 format (workload time). |
|
|
Files access time in iso_8601 format (workload time). |
11.4. TCP Network Connections
|
Attribute |
Description |
|---|---|
|
|
The unique file descriptor identifier that is associated with the socket. |
|
|
The TCP connection state. |
|
|
The network protocol used. |
|
|
Source IP address. |
|
|
Source port number. |
|
|
Destination IP address. |
|
|
Destination port number. |
|
|
The amount of data, in bytes, received. |
|
|
The amount of data, in bytes, sent. |
|
|
The number of TCP segments received. |
|
|
The number of TCP segments sent. |
|
|
The interface name. |
|
|
The interface MAC address. |
|
|
The IPv4 addresses associated with the interface. |
|
|
The IPv6 addresses associated with the interface. |
|
|
The time the TCP connection has been first observed, in ISO 8601 format (nanoseconds precision). |
|
|
Time when the TCP connection has been terminated, in ISO 8601 format (nanoseconds precision). |
|
|
The overall duration of the TCP connection, in nanoseconds (calculated based on the observed creation time). |
|
|
The average size, in bytes, of the packets received. |
|
|
The average size, in bytes, of the packets sent. |
11.5. Process Memory
|
Attribute |
Description |
|---|---|
|
|
Associated process' unique ID. |
|
|
Start address of the virtual memory area. |
|
|
End address of the virtual memory area. |
|
|
Permissions associated with the virtual memory area. |
|
|
Whether the virtual memory belongs to the process' main executable. |
|
|
Full path (including file name) of the file associated with the memory area. |
|
|
File name associated with the memory area. |
11.6. Executed Binaries and Loaded Libraries (Attestation)
|
Attribute |
Description |
|---|---|
|
|
Inode number of the ELF file. |
|
|
Name of the ELF file. |
|
|
Type of the ELF file. |
|
|
File path of the ELF file. |
|
|
SHA256 hash of the ELF file. |
|
|
SHA1 hash of the ELF file. |
|
|
MD5 hash of the ELF file. |
|
|
File size of the ELF file, in bytes. |
|
|
Whether this file is the main executable for the process. |
11.7. Shell History
|
Attribute |
Description |
|---|---|
|
|
Provides the following two fields. |
|
|
The time at which the command has been executed, in ISO 8601 format. |
|
|
The actual executed command. |
11.8. Reverse Shell
|
Attribute |
Description |
|---|---|
|
|
JSON list of |
|
|
Standard process metadata (PID, command, user, etc.), also includes |
|
|
JSON list of |
|
|
File descriptor metadata. |
|
|
JSON list of |
|
|
Network connection metadata. |
Last updated: