DOCA Flow Tune is a powerful, one-stop-shop solution, providing visibility and analysis capabilities for DOCA Flow programs.
Introduction
DOCA Flow Tune is supported at alpha level.
DOCA Flow Tune is a one-stop-shop solution which allows developers to visualize their traffic steering pipelines, have a live monitor of software Key Performance Indicators (KPIs) as well as hardware counters, and gain valuable performance insights about their DOCA-Flow-based program.
DOCA Flow Tune is especially useful for the following scenarios:
-
Aiding developers during the development of their traffic steering pipeline by providing visualization of the pipeline, and later also performance insights about the designed pipeline
-
Aiding developers in pre-production environments by providing live monitoring of the performance indicators of the program on both software and hardware levels, and helping detect possible bottlenecks/critical paths so they are addressed before deployment to production environments
-
Aiding administrators monitor the program in production by providing live monitoring as well as high-rate hardware counters to be used when analyzing a possible deployment/setup issue
The tool operates in three distinct modes, Monitor, Analyze, and Visualize, which are presented in the following subsections.
Collecting, analyzing, and displaying information from the analyzed DOCA-Flow-based program requires the explicit activation of the DOCA Flow Tune server by the target program. For more information about that, refer to the DOCA Flow Tune Server programming guide.
Monitor Mode Overview
This mode collects and displays both hardware counters and software KPIs in real time (as extracted from the running DOCA Flow program and the underlying setup), providing a comprehensive view of the system's performance:
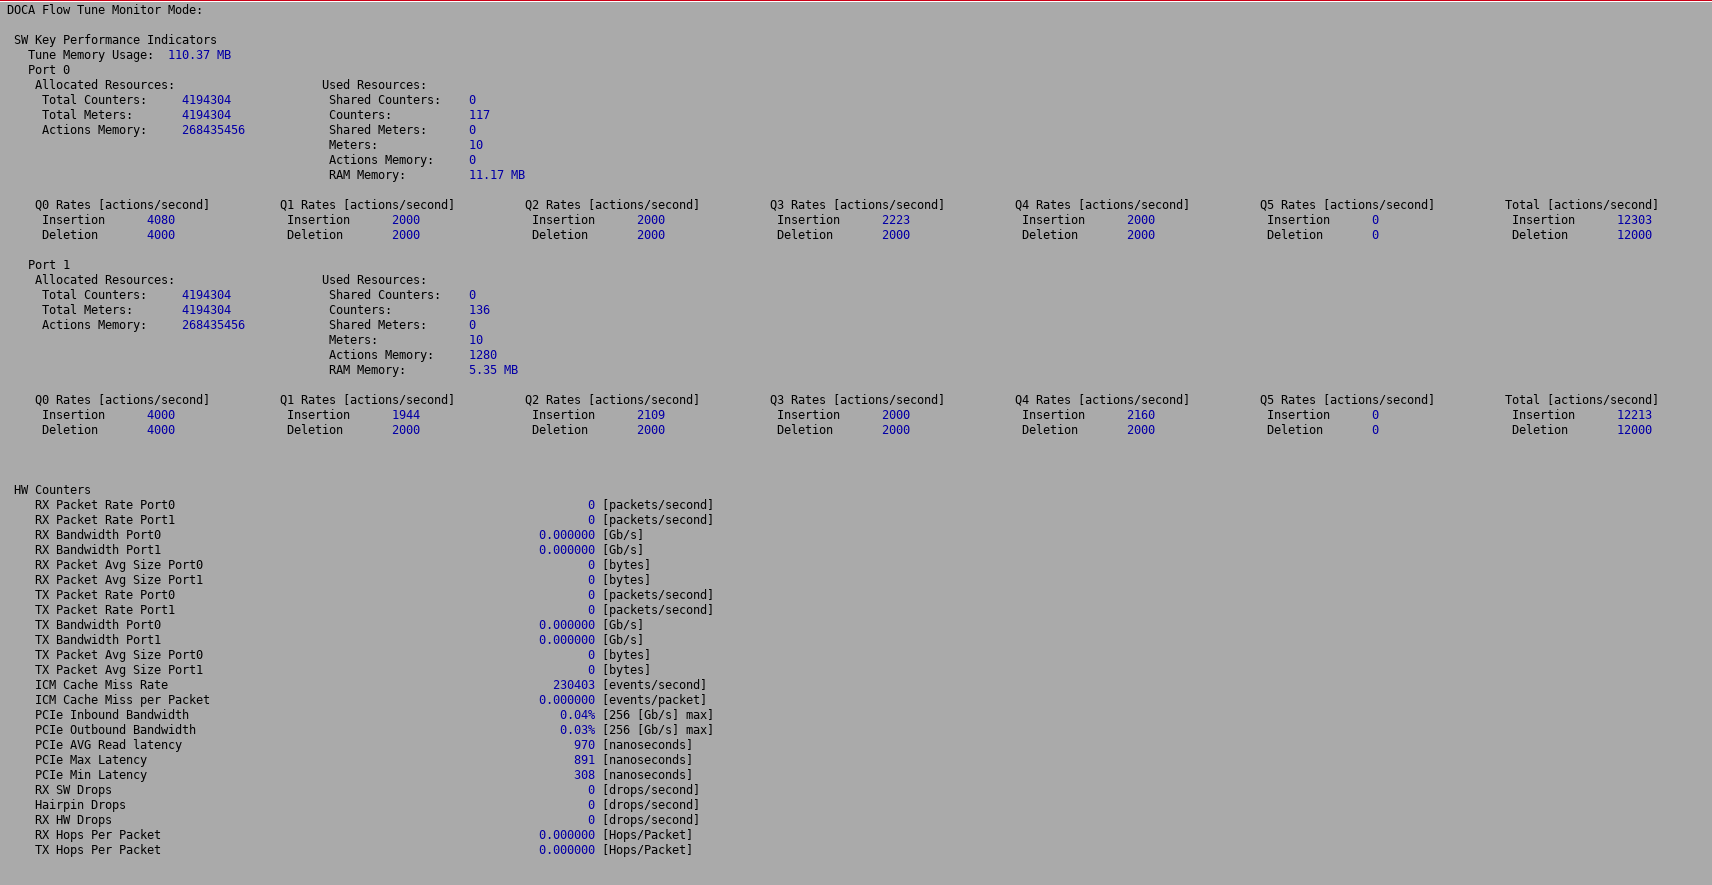
This information can also be exported to a CSV/JSON file for further analysis.
For more information about this mode, please refer to section "DOCA Flow Tune Tool | Monitor Mode".
For information about running DOCA Flow Tune in this mode, please refer to section "DOCA Flow Tune Tool | Monitor Command".
Analyze Mode Overview
The analyze mode supports the ability to dump the internal steering pipeline state to be used by Visualize mode.
It also supports the ability to trace a packet in the pipeline and dump the path in JSON format.
For more information about this mode, please refer to section "DOCA Flow Tune Tool | Analyze Mode".
For more information about running DOCA Flow Tune in this mode, please refer to section "DOCA Flow Tune Tool | Analyze Command".
Visualize Mode Overview
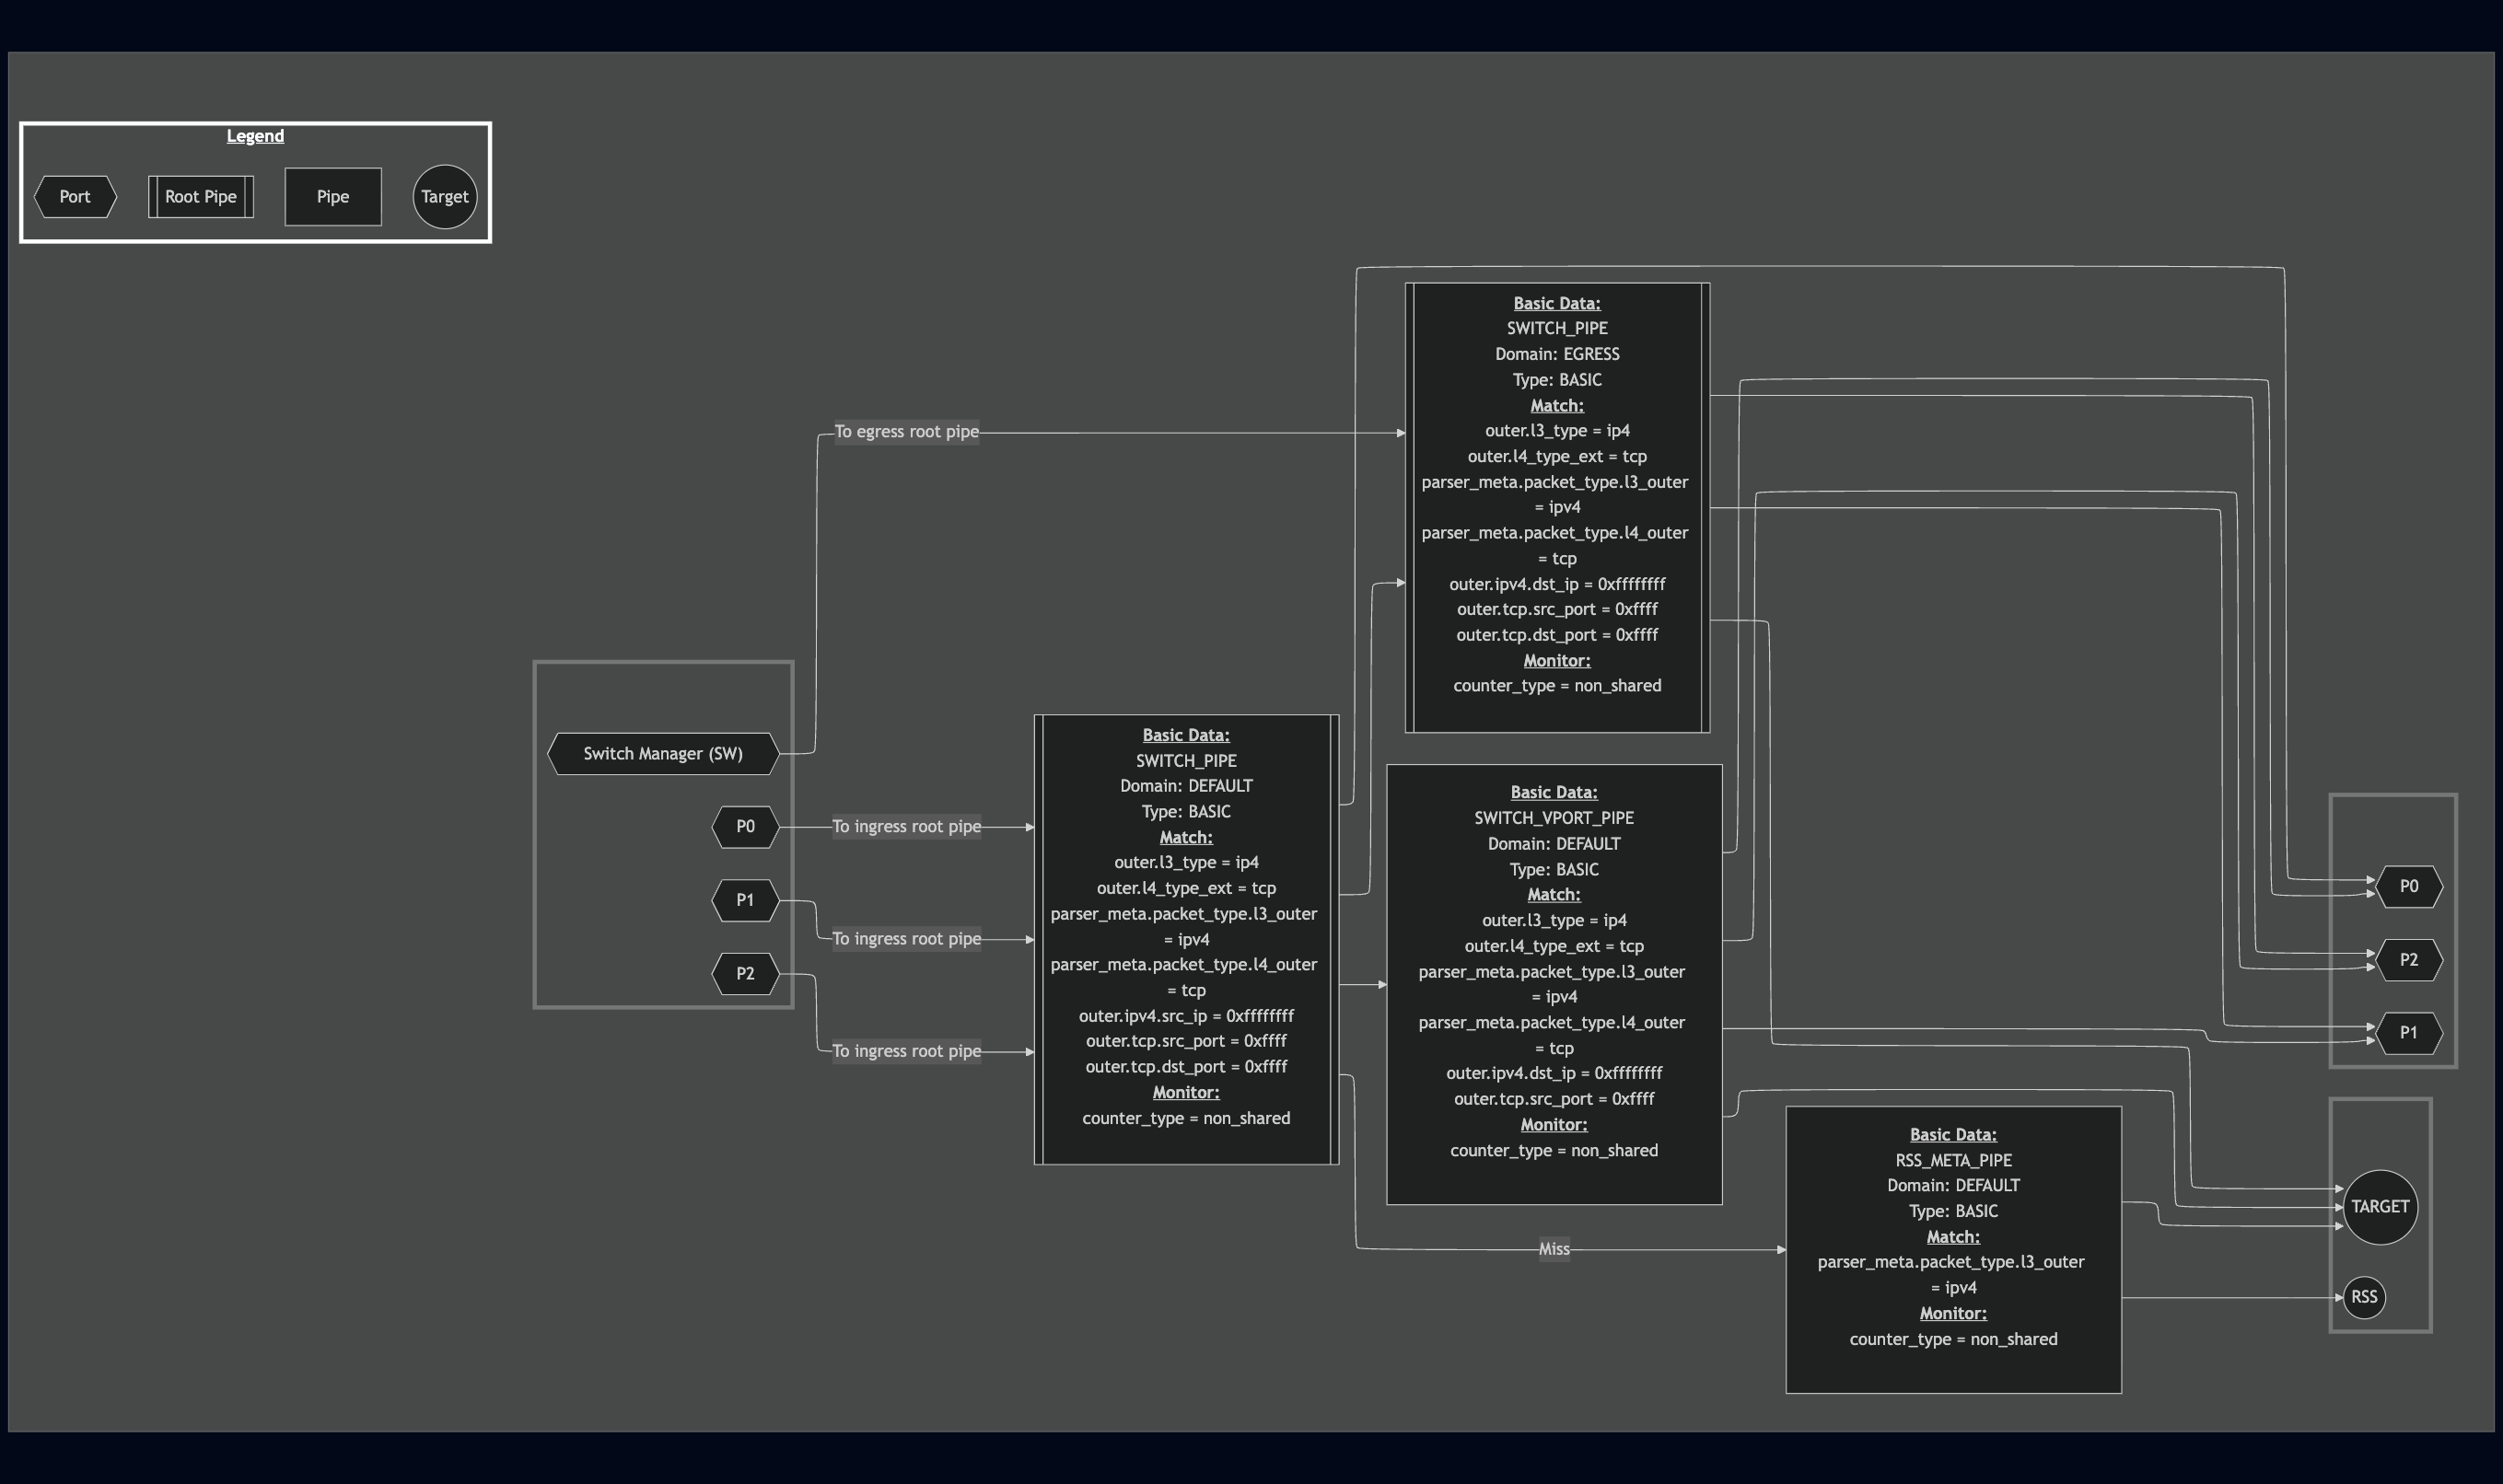
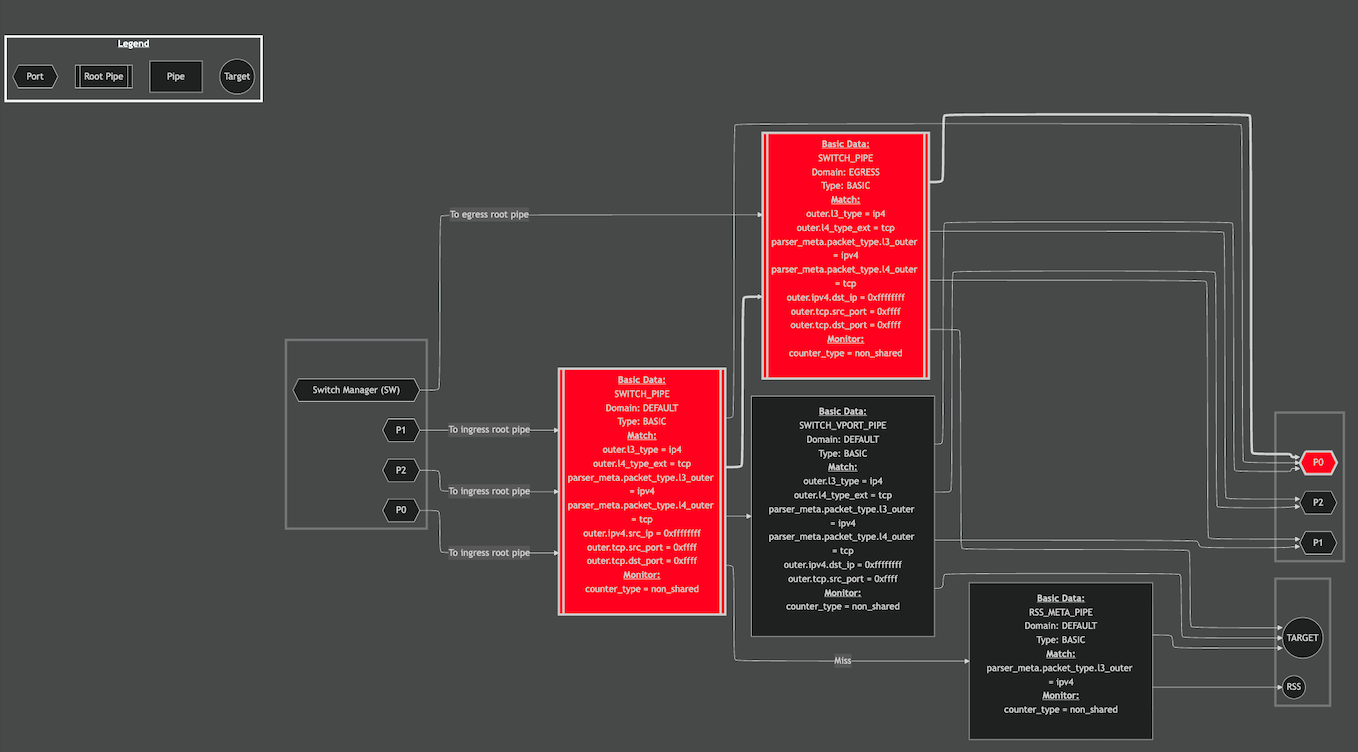
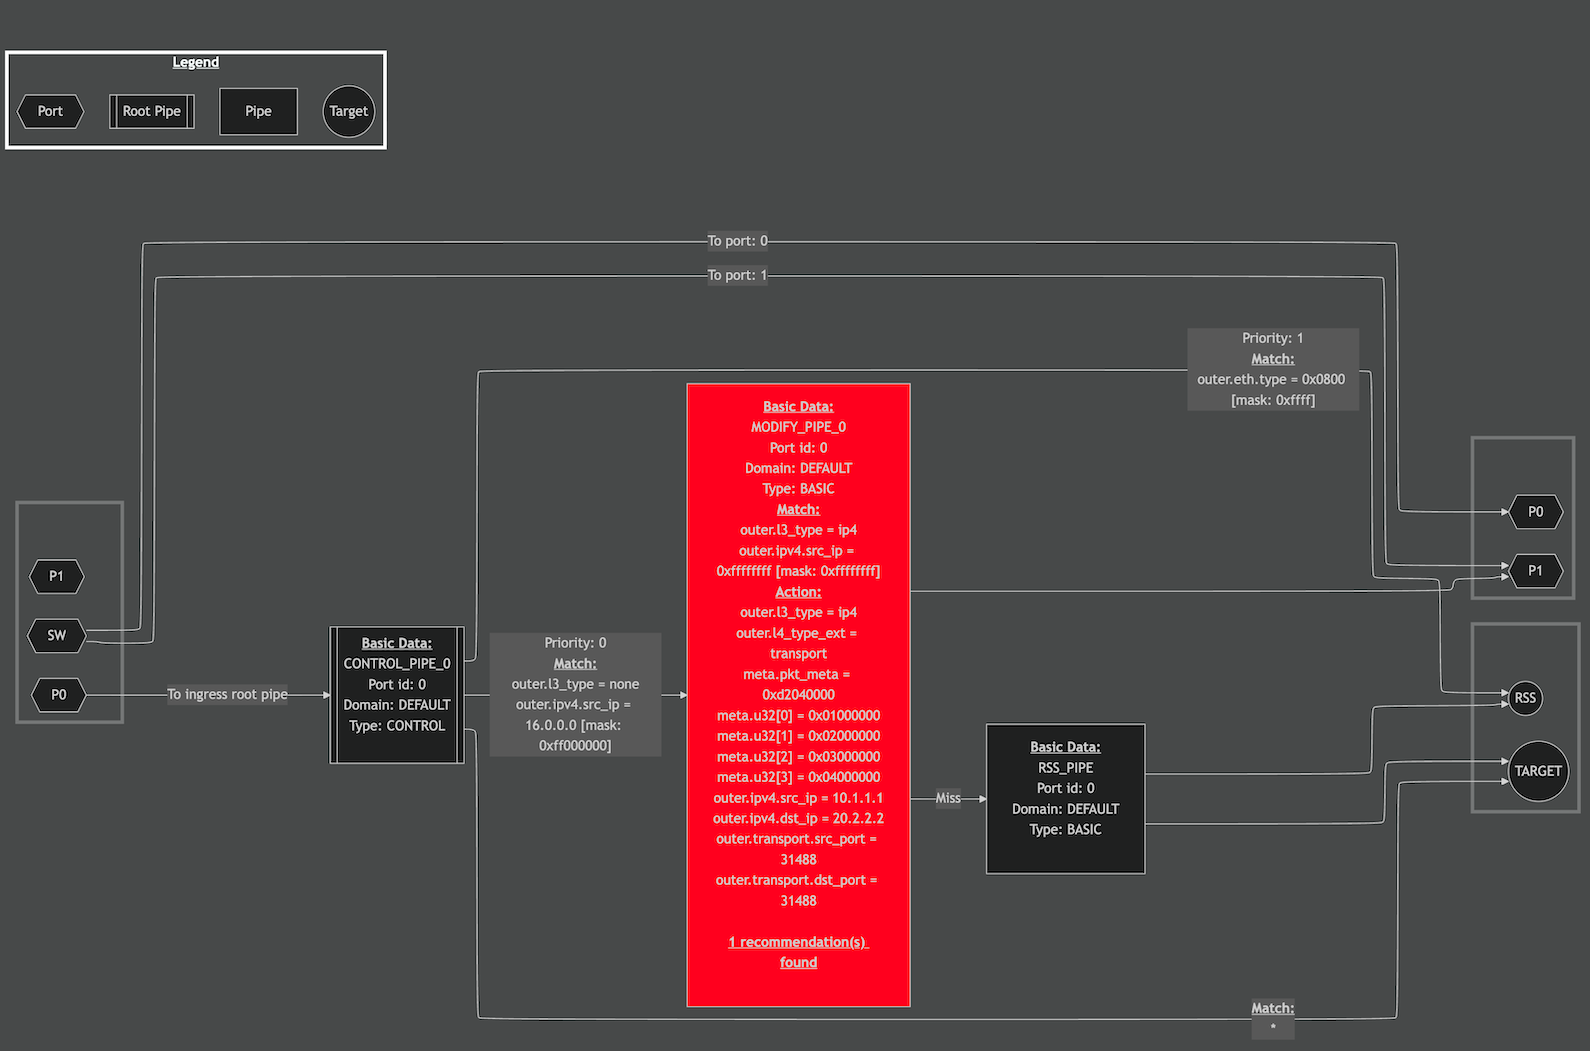
This mode allows users to produce a graphical representation of their steering pipeline (as built using the DOCA Flow API), allowing developers to quickly understand their program's pipeline, and compare it with their intended architecture.
The following diagram represents DOCA Flow Switch to Wire sample:
Mermaid Graph
The DOCA Flow Tune Mermaid graph visually represents the pipeline structure and metadata. It uses the following conventions:
-
Shapes:
-
Square: Represents a pipe (root pipes denote with two additional lines inside the figure).
-
Hexagon: Represents a port.
-
Circle: Represent a pipeline target (drop, RSS, Kernel, etc).
-
Arrow: Indicates a possible connection between pipes and ports.
-
-
Pipe Data Layers:
Pipe metadata is organized into multiple visual layers. Layers can be stacked and selectively displayed when analyzing the pipeline.-
Base Layer (default):
-
Includes general pipe attributes:
-
Name, label, type, domain, port id, hash algorithm
-
-
Match fields, action data and monitor configuration
-
Mask fields if provided.
-
-
Cost Layer:
-
Displays the minimum and maximum cost a packet can incur while traversing the pipe.
-
Overlays on top of the base layer.
-
-
Critical Path Layer:
-
Highlights the pipeline path with the highest total processing cost.
-
If multiple paths have the same cost, a single one is arbitrarily highlighted.
-
-
Resources Layer:
-
Shows resource utilization per pipe, including:
-
Number of counters
-
Number of meters
-
Action memory usage
-
RAM consumption
-
-
This layer is an overlay on the base layer.
-
-
Packet Trace Layer:
Given a PCAP packet and port ID, show the packet path in the pipeline in green.
-
For more information about this mode, refer to section "DOCA Flow Tune Tool | Visualize Mode".
For more information on running DOCA Flow Tune in this mode, refer to section "DOCA Flow Tune Tool | Visualize Command".
Dependencies
DOCA Flow Tune depends on the following DOCA SDK libraries:
Prerequisites
-
DOCA 3.0.0 and higher.
-
For optimal experience, it is recommended to comply with the prerequisites of all the listed dependencies, and especially with their recommended firmware versions.
Execution
To execute DOCA Flow Tune tool:
Usage: doca_flow_tune [Program Commands] [DOCA Flags] [Program Flags]

Program Commands:
  analyze                           Run Flow Tune in Analyze mode
  monitor                           Run Flow Tune in Monitor mode
  visualize                         Run Flow Tune in Visualize mode

DOCA Flags:
  -h, --help                        Print a help synopsis
  -v, --version                     Print program version information
  -l, --log-level                   Set the (numeric) log level for the program <10=DISABLE, 20=CRITICAL, 30=ERROR, 40=WARNING, 50=INFO, 60=DEBUG, 70=TRACE>
  --sdk-log-level                   Set the SDK (numeric) log level for the program <10=DISABLE, 20=CRITICAL, 30=ERROR, 40=WARNING, 50=INFO, 60=DEBUG, 70=TRACE>
  --log-filter                      Filter logs from specific modules, separated by comma
  -j, --json <path>                 Parse command line flags from an input json file
This usage printout can be printed to the command line interface (CLI) using the -h (or --help) option:
doca_flow_tune -h
The same applies for each of the tool's commands (and subcommands). For instance:
doca_flow_tune monitor -h
Monitor Command
The monitor command presents software KPIs and hardware counters. Each component offers various options, which can be specified in the configuration file under the monitor section, or through the CLI.
Usage: doca_flow_tune monitor [Program Commands] [DOCA Flags] [Program Flags]

Program Commands:
  background                        Collect SW key performance indicators and HW counters on the background

DOCA Flags:
  -h, --help                        Print a help synopsis
  -l, --log-level                   Set the (numeric) log level for the program <10=DISABLE, 20=CRITICAL, 30=ERROR, 40=WARNING, 50=INFO, 60=DEBUG, 70=TRACE>
  --sdk-log-level                   Set the SDK (numeric) log level for the program <10=DISABLE, 20=CRITICAL, 30=ERROR, 40=WARNING, 50=INFO, 60=DEBUG, 70=TRACE>
  --log-filter                      Filter logs from specific modules, separated by comma

Program Flags:
  --enable-dump                     Enable counters data dumping to file
  --disable-dump                    Disable counters data dumping to file
  --dump-file-name                  Counters dump file name to create
  --dump-file-format                Counters dump file format {json, csv}
  --hw-profile                      Register hardware profile {basic, full}
  --sw-profile                      Register software profile
  -f, --cfg-file                    JSON configuration file
Supported sub-commands:
-
background– This subcommand allows performing file dumping without displaying the output on the screen. This is useful for scenarios where one wants to log counters without cluttering the terminal. It also supports high-rate dumping for hardware counters which may be activated using the--high-rateflag.Usage: doca_flow_tune monitor background [DOCA Flags] [Program Flags] DOCA Flags: -h, --help Print a help synopsis -l, --log-level Set the (numeric) log level for the program <10=DISABLE, 20=CRITICAL, 30=ERROR, 40=WARNING, 50=INFO, 60=DEBUG, 70=TRACE> --sdk-log-level Set the SDK (numeric) log level for the program <10=DISABLE, 20=CRITICAL, 30=ERROR, 40=WARNING, 50=INFO, 60=DEBUG, 70=TRACE> --log-filter Filter logs from specific modules, separated by comma Program Flags: --high-rate Enable dumping HW counters data to file in high rate --hw-profile Register hardware profile {basic, full} --sw-profile Register software profile
CLI Examples
-
To launch the
monitorcommand with a given configuration file:doca_flow_tune monitor -f /tmp/flow_tune_cfg.json -
To launch the
monitorcommand with both a given configuration file and a CLI parameter for specifying the desired hardware counters profile:doca_flow_tune monitor -f /tmp/flow_tune_cfg.json --hw-profile basic -
To launch the
monitorcommand with thebackgroundsubcommand and the request to perform a high-rate collection and export for the hardware counters:doca_flow_tune monitor -f /tmp/flow_tune_cfg.json background --high-rateThe tool silently creates and updates the
flow_tune{.csv, .json}file.
Analyze Command
The analyze command runs a specified set of analysis methods over the target DOCA Flow program. The analysis supports the ability to export a JSON description of the steering pipeline, as is used by the visualize command, and could later be used for future analysis methods (both online or offline).
The analyze command also supports the ability to trace a packet path in the pipeline and output the path in JSON format.
Usage: doca_flow_tune analyze export [DOCA Flags] [Program Flags]

DOCA Flags:
  -h, --help                        Print a help synopsis
  -l, --log-level                   Set the (numeric) log level for the program <10=DISABLE, 20=CRITICAL, 30=ERROR, 40=WARNING, 50=INFO, 60=DEBUG, 70=TRACE>
  --sdk-log-level                   Set the SDK (numeric) log level for the program <10=DISABLE, 20=CRITICAL, 30=ERROR, 40=WARNING, 50=INFO, 60=DEBUG, 70=TRACE>
  --log-filter                      Filter logs from specific modules, separated by comma
  -j, --json <path>                 Parse command line flags from an input json file

Program Flags:
  --file-name                       File name on which the pipeline information will be saved
  -f, --cfg-file                    JSON configuration file

--------------------------------------------------------------------------------------------------------------------------------------------------------------------

Usage: doca_flow_tune analyze packet-trace [DOCA Flags] [Program Flags]

DOCA Flags:
  -h, --help                        Print a help synopsis
  -l, --log-level                   Set the (numeric) log level for the program <10=DISABLE, 20=CRITICAL, 30=ERROR, 40=WARNING, 50=INFO, 60=DEBUG, 70=TRACE>
  --sdk-log-level                   Set the SDK (numeric) log level for the program <10=DISABLE, 20=CRITICAL, 30=ERROR, 40=WARNING, 50=INFO, 60=DEBUG, 70=TRACE>
  --log-filter                      Filter logs from specific modules, separated by comma

Program Flags:
  --pcap-file                       Input PCAP file path
  --output-file                     Output file path
  --port-id                         Ingress port ID for packet trace
  -f, --cfg-file                    JSON configuration file
Supported subcommands:
-
export– This command allows the tool to export a running DOCA Flow program's pipeline into a JSON file. This file is the main input for other features of the tool, such as the graphical visualization. -
packet-trace- This command allows the tool to trace a given packet in the DOCA Flow program's pipeline, and dump the path in JSON format.
CLI Examples
Export subcommand
-
To launch the analyze command without a configuration file:
doca_flow_tune analyze exportThe JSON file is stored into its default path.
-
To launch the
analyzecommand with a given configuration file that specifies the desired values for all configurations necessary:doca_flow_tune analyze export -f /tmp/flow_tune_cfg.json -
To launch the
analyzecommand with a configuration file while also configuring the output path for the exported JSON file through the CLI:doca_flow_tune analyze export -f /tmp/flow_tune_cfg.json --file-name my_program_pipeline_desc.jsonThe exported pipeline is stored as
my_program_pipeline_desc.jsoninto the chosen/default output directory.
Packet Trace Subcommand
-
To launch the
packet-tracecommand without a configuration file:doca_flow_tune analyze packet-trace --pcap-file /path/to/pcap/file --output-file /path/to/output/file -
To launch the
packet-tracecommand with a given configuration file that specifies the desired values for all necessary configurations:doca_flow_tune analyze packet-trace -f /tmp/flow_tune_cfg.json -
To launch the
packet-tracecommand with a configuration file while configuring the output path for the packet trace JSON file through the CLI:doca_flow_tune analyze packet-trace -f /tmp/flow_tune_cfg.json --output-file /path/to/output/file
Visualize Command
The visualize command visualizes the steering pipeline of a given DOCA Flow program. The command works on a given JSON file as input. This file can either be generated by the analyze export command or queried dynamically from a running program, in which case the command would dump the pipeline from the program and then generate the visualization output file.
The visualization output file is a Mermaid markdown format.
This file can be fed to any of the widely available Mermaid visualization tools, as explained in depth in the corresponding section "DOCA Flow Tune Tool | Visualize Mode".
Usage: doca_flow_tune visualize [DOCA Flags] [Program Flags]

DOCA Flags:
  -h, --help                        Print a help synopsis
  -l, --log-level                   Set the (numeric) log level for the program <10=DISABLE, 20=CRITICAL, 30=ERROR, 40=WARNING, 50=INFO, 60=DEBUG, 70=TRACE>
  --sdk-log-level                   Set the SDK (numeric) log level for the program <10=DISABLE, 20=CRITICAL, 30=ERROR, 40=WARNING, 50=INFO, 60=DEBUG, 70=TRACE>
  --log-filter                      Filter logs from specific modules, separated by comma
  -j, --json <path>                 Parse command line flags from an input json file

Program Flags:
  --pipeline-desc                   Input JSON file that represents the Flow application pipeline
  --file-name                       File name on which the visualization information will be saved
  -f, --cfg-file                    JSON configuration file
  --cost                            Show cost
  --critical-path                   Show critical path
  --resources                       Show resources
  --distribution                    Show distribution
  --tag                             Add mermaid tag (```mermaid) to the .md file
  --enhanced                        Enable enhanced graph coloring
CLI Examples
-
Launching the
visualizecommand without a configuration file triggers a live query of the pipeline from the currently running DOCA Flow program. In the absence of an input JSON file, the tool automatically generates and dumps a JSON representation of the active pipeline to be used for Mermaid diagram generation.doca_flow_tune visualizeExample output:
2025-04-09 15:06:44 - flow_tune - INFO - Pipeline description file not provided or doesn't exist, dumping pipeline description to /tmp/tmp_pipeline_desc.json 2025-04-09 15:06:44 - flow_tune - INFO - Flow program pipeline information was exported to "/tmp/tmp_pipeline_desc.json" 2025-04-09 15:06:44 - flow_tune - INFO - Mermaid graph exported to /tmp/flow_tune/flow_tune_pipeline_vis.md 2025-04-09 15:06:44 - flow_tune - INFO - DOCA Flow Tune finished successfully -
Launching the
visualizecommand with a given configuration file that specifies the desired values for all needed configurations:doca_flow_tune visualize -f /tmp/flow_tune_cfg.json -
To launch the
visualizecommand with a configuration file while configuring the output path for the Mermaid file through the CLI and providing an offline pipeline file:doca_flow_tune visualize -f /tmp/flow_tune_cfg.json --file-name my_program_pipeline_viz.md --pipeline-desc my_program_pipeline_desc.jsonThe exported Mermaid file is stored as
my_program_pipeline_viz.mdinto the chosen/default output directory. Because the pipeline description file is explicitly provided, this command could be used offline, as it would not need connection with the DOCA Flow program to visualize.To launch the
visualizecommand with the--critical-pathor--costflags, thelow_level_infosetting must be enabled (true):-
When using a configuration file, the
low_level_infofield must be set totruein theanalyzesection of the provided configuration file. For example:doca_flow_tune visualize --cost -f /tmp/flow_tune_cfg.json # flow_tune_cfg.json must include: "low_level_info": true -
When using an offline pipeline JSON file, the file must have been generated with
low_level_infoenabled at the time of the dump:doca_flow_tune visualize --cost --pipeline-desc my_program_pipeline_desc.json # my_program_pipeline_desc.json must have been dumped with "low_level_info": true
-
Configuration
DOCA Flow Tune has a configuration file which allows customizing various settings.
The configuration file is divided into sections to simplify its usage.
Config File Default Values
If a configuration file is not provided, DOCA Flow Tune uses its default values for fields which are mandatory.
A list of all default values can be seen in the appendix.
In Monitor mode, if a software KPIs or hardware counters query is not needed, removing the hardware or software fields from the configuration file disables the respective feature.
Custom Config File
Instead of using default configuration values, users can create a file of their own and provide a file path when running DOCA Flow Tune (-f/--cfg-file).
Once used, DOCA Flow Tune loads all provided values directly from the file, while the rest of the fields (if any) use their respective default values.
Overriding Config Values from CLI
Setting some of the fields in the configuration file is supported through CLI using the --file-name flag. If used, the values provided from the CLI would override the values of the fields from the configuration file. This allows for easier configuration of common values without the need to create a new custom file or to modify an existing configuration file.
Common Configuration Values
Some sections of the configuration file are shared between multiple runtime modes of DOCA Flow Tune (i.e., Monitor, Analyze, Visualize) and generally have to do with the output/input file paths and interaction with the live DOCA Flow program.
{
...
 	"outputs_directory": "/tmp/flow_tune/",
...
	"network": {
		"server_uds": "/tmp/tune_server.sock",
		"uds_directory": "/var/run/doca/flow_tune/"
	},
...
}
Output Directory
outputs_directory defines the main directory on which all output products are saved. This field does not have a default value. If no value is provided, DOCA Flow Tune files are saved at the following directories:
-
Counters dump file {.json, .csv} –
/tmp/flow_tune/ -
Analyze export pipeline description file –
/tmp/flow_tune/ -
Pipeline visualization file –
/tmp/flow_tune/
Connection to DOCA Flow Tune Server
Some features of DOCA Flow Tune work by interacting with a live DOCA Flow based program. This is enabled through a server that is running in the background as part of the DOCA Flow library, and requires all the following to be applied:
-
DOCA Flow based program should explicitly enable the server.
More information is available in the relevant DOCA Flow Tune Server programming guide.
-
The DOCA-Flow-based program should run using the trace-enabled DOCA Flow library.
More information is available in the "Debug and Trace Features" section of the DOCA Flow programming guide.
DOCA Flow Tune should be configured in a way to allow it to connect to the matching server. This can be done by modifying the following variables under the network section of the configuration file:
-
server_uds– DOCA Tune Server Unix Domain Socket (UDS) path. Default value is/tmp/tune_server.sock. -
uds_directory– Directory on which all local UDSs are created. Default value is/var/run/doca/flow_tune/.
Monitor Mode
Hardware Counters
This table provides the supported hardware counters and their associated profiles.
|
Counter Name |
Description |
Unit |
Profile Basic |
Profile Full |
|---|---|---|---|---|
|
RX Packet Rate |
The number of received packets per second |
pkt/sec |
(tick) |
(tick) |
|
RX Bandwidth |
The data transfer rate based on the number of packets received per second |
Gb/s |
(tick) |
(tick) |
|
RX Packet Average Size |
The average size of received data packets |
Bytes |
(tick) |
(tick) |
|
TX Packet Rate |
The number of packets transmitted per second |
pkt/sec |
(tick) |
(tick) |
|
TX Bandwidth |
The data transfer rate based on the number of packets transmitted per second |
Gb/s |
(tick) |
(tick) |
|
TX Packet Average Size |
The average size of transmitted data packets |
Bytes |
(tick) |
(tick) |
|
RX SW Drops |
The number of packets dropped due to a lack of WQE for the associated QPs/RQs (excluding hairpin QPs/RQs) |
drops/sec |
(tick) |
(tick) |
|
Hairpin Drops |
The number of packets dropped due to a lack of WQE for the associated hairpin QPs/RQs |
drops/sec |
(tick) |
(tick) |
|
RX HW Drops |
The number of packets discarded due to no available data or descriptor buffers in the RX buffer |
drops/sec |
(tick) |
(tick) |
|
ICM Cache Miss Rate |
The rate of data requests that miss in the ICM (interconnect context memory) cache |
events/sec |
(cross) |
(tick) |
|
ICM Cache Miss per Packet |
The number of data requests that miss per packet |
events/pkt |
(cross) |
(tick) |
|
PCIe Inbound Bandwidth |
The number of bits received from the PCIe toward the device per second. |
Gb/s |
(cross) |
(tick) |
|
PCIe Outbound Bandwidth |
The number of bits transmitted from the device toward the PCIe per second |
Gb/s |
(cross) |
(tick) |
|
PCIe AVG Read latency |
The average PCIe read latency for all read data |
nsec |
(cross) |
(tick) |
|
PCIe Max Latency |
The maximum latency (in nanoseconds) for a single PCIe read from the device |
nsec |
(cross) |
(tick) |
|
PCIe Min Latency |
The minimum latency (in nanoseconds) for a single PCIe read from the device |
nsec |
(cross) |
(tick) |
|
RX Hops Per Packet |
The number of hops per packet in RX domain |
hops/pkt |
(cross) |
(tick) |
|
TX Hops Per Packet |
The number of hops per packet in TX domain |
hops/pkt |
(cross) |
(tick) |
Software Key Performance Indicators
The following table lists the supported software Key Performance Indicators (KPIs) and their associated profiling categories:
|
Key Performance Indicator |
Description |
Units |
Profile |
|---|---|---|---|
|
Insertion rate |
Number of successful table entry insertions per queue per second |
actions/sec |
|
|
Deletion rate |
Number of successful table entry deletions per queue per second |
actions/sec |
|
|
Action resources |
Number of resources utilized by the program for all user-defined actions |
N/A |
|
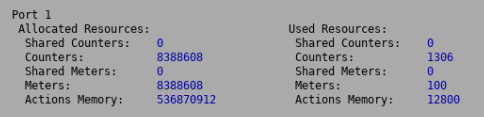
Action Resources Counters
The action_resources section displays the following per-port counters, including both the total allocated and currently used amounts:
-
Resource counters:Number of Shared CountersNumber of CountersNumber of Shared MetersNumber of MetersActions Memory
-
Used memory resources:
-
RAM
-
Configuration
Counters Dumper
Hardware Counters
|
Counter Name |
Units |
|---|---|
|
Rate of RX packets on port 0 |
Packets per second |
|
Rate of RX packets on port 1 |
Packets per second |
|
RX bandwidth on port 0 |
Gb/s |
|
RX bandwidth on port 1 |
Gb/s |
|
Average RX packet size on port 0 |
Bytes |
|
Average RX packet size on port 1 |
Bytes |
|
Rate of TX packets on port 0 |
Packets per second |
|
Rate of TX packets on port 1 |
Packets per second |
|
TX bandwidth on port 0 |
Gb/s |
|
TX bandwidth on port 1 |
Gb/s |
|
Average TX packet size on port 0 |
Bytes |
|
Average TX packet size on port 1 |
Bytes |
|
ICMC misses rate |
Events per second |
|
ICMC misses per packet |
Events per packet |
|
The bandwidth of bytes received from PCIe toward the device |
Gb/s |
|
The bandwidth of bytes transmitted from the device toward PCIe |
Gb/s |
|
The average PCIe read latency |
Nanoseconds |
|
The total latency for all PCIe read from the device |
Nanoseconds |
|
The total number of PCIe packets |
Events |
|
The maximum latency for a single PCIe read from the device |
Nanoseconds |
|
The minimum latency for a single PCIe read from the device |
Nanoseconds |
|
RX software drops |
Drops per second |
|
Hairpin drops |
Drops per second |
|
RX hardware drops |
Drops per second |
|
RX Hops Per Packet |
[Hops/Packet] |
|
TX Hops Per Packet |
[Hops/Packet] |
Software KPI Counters
|
Counter Name |
Units |
|---|---|
|
Queue <i> Insertion Rate |
Deletions per second |
|
Queue <i> Deletion Rate |
Insertions per second |
|
Total Insertion Rate |
Insertions per second |
|
Total Deletion Rate |
Insertions per second |
|
Total Allocated Counters |
|
|
Total Used Counters |
|
|
Total Used Shared Counters |
|
|
Total Allocated Meters |
|
|
Total Used Meters |
|
|
Total Used Shared Meters |
|
|
Total Allocated Actions memory |
Bytes |
|
Total Used Actions memory |
Bytes |
|
Used RAM Memory |
Bytes |
CSV Format
The CSV format stores two types of rows, specific to each counter module:
-
Hardware Counter Rows
Module Name
HW Counter Name
Counter Value
Timestamp
HW
Hairpin drops
8
142623139459
HW
TX Hops Per Packet
197503959728
142623139459
-
Module Name – Hardware module name
-
HW CounterName – Hardware counter name
-
Counter Value – Counter value
-
Timestamp – Hardware timestamp
-
-
Software KPI Rows
Module Name
Port ID
SW Counter Name
Counter Value
Timestamp
SW
0
Queue 0 Insertion Rate
34511
1727345744137828
SW
1
Queue 2 Insertion Rate
37050
1727345755137828
SW
0
Allocated Counters
4
1727345755137828
SW
0
Total Allocated Counters
3
1727345755137828
-
Module Name – Software module name
-
Port ID – Software port ID
-
SW KPI Name – KPI name
-
KPI Value – KPI value
-
Timestamp – Software timestamp
-
JSON Format
The JSON output consists of a root object where each key represents a timestamp. The value associated with each timestamp is a nested JSON object containing the performance counters and metrics recorded at that specific point in time.
JSON output example:
{
  "171106550167": {
    "Hairpin Drops Rate": 0.0,
    "ICMC Miss Rate": 0.0,
    "ICMC Miss per Packet": 18.944444444444443,
    "PCIe AVG Read Latency": 6028.0,
    "PCIe Inbound BW": 0.0,
    "PCIe Max Read Latency": 396.0,
    "PCIe Min Read Latency": 346.0,
    "PCIe Outbound BW": 0.0,
    "RX Bandwidth Port0": 0.0,
    "RX Bandwidth Port1": 0.0,
    "RX HW Drops Rate": 0.0,
    "RX Hops Per Packet": 0.0,
    "RX Packet Avg Size Port0": 0.0,
    "RX Packet Avg Size Port1": 0.0,
    "RX Packet Rate Port0": 0.0,
    "RX Packet Rate Port1": 0.0,
    "SW Drops Rate": 0.0,
    "TX Bandwidth Port0": 0.0,
    "TX Bandwidth Port1": 0.0,
    "TX Hops Per Packet": 0.0,
    "TX Packet Avg Size Port0": 0.0,
    "TX Packet Avg Size Port1": 0.0,
    "TX Packet Rate Port0": 0.0,
    "TX Packet Rate Port1": 0.0
  },
  ...
}
Configuration File
DOCA Flow Tune's configuration file consists of two main parts of relevance for Monitor mode:
-
dumperdump object -
monitorconfiguration object
The following is an example for both sections:
{
...
 	 "dumper": {
		"enable": true,
		"high-rate": false,
		"file_name": "flow_tune.json",
		"stats_time": 1,
		"format_type": "json", // types: {csv, json}
		"max_files": 3,
		"max_size_bytes": 1000000
	},

...

 	 "monitor": {
		"screen_mode": "dark",	// modes: {light, dark}
		"hardware": {
			"pci_addresses": [
				"b1:00.0",
				"b1:00.1"
			],
			"profile": "full"  // profiles: {basic, full}
		},
		"software": [
			{
				"flow_port_id": 0,
				"profiles": [
					"entries_ops_rates"  // profiles: {entries_ops_rates, action_resources}
				]
			},
			{
				"flow_port_id": 1,
				"profiles": [
					"entries_ops_rates"
				]
			}
		]
	}
...
}
Dumper Configuration Section
The dumper allows exporting the hardware and software counters collected by the tool into a output file for further analysis or record keeping. This is particularly useful for logging performance metrics over time.
How to Enable Counters Dumper
To enable CSV dumping, modify the configuration in the JSON file as follows:
{
  "dumper": {
		"enable": true,
		"file_name": "flow_tune.csv",
		"format_type": "csv",
	},
}
To enable JSON dumping, modify the configuration in the JSON file as follows:
{
  "dumper": {
		"enable": true,
		"file_name": "flow_tune.json",
		"format_type": "json",
	},
}
The supported fields are:
-
enable– Set totrueto enable counters dumping orfalseto disable it. Default value isfalse. -
file_name– The name of the dump file where the data will be saved. By default when enabling the dumper, format type isJson. -
format_type– The dump file formatCSVorJson. -
max_size_bytes– The maximum size (in bytes) of the dump file. Once this limit is reached, a new file is created based on themax_filessetting. -
max_files– The maximum number of CSV files to keep. When this limit is reached, the oldest files are deleted.
The counters dumping can also be enabled or disabled from the CLI using the --enable-dump or --disable-dump flags, respectively. For example:
doca_flow_tune monitor -f /tmp/flow_tune_cfg.json --enable-dump
Additionally, the format type and filename can be updated by using the --dump-file-name and --dump-file-format flags, for example:
doca_flow_tune monitor -f /tmp/flow_tune_cfg.json --dump-file-name "counters_dump.csv" --dump-file-format "csv"
Monitor Configuration Section
Screen Mode
The Monitor module supports two screen modes: dark and light.
Hardware
The hardware section includes the pci_addresses and profile fields:
-
The
pci_addressesfield expects an array of PCIe addresses for NIC ports. The tool uses these addresses to retrieve the corresponding NIC device and the desired port IDs.PCIe addresses must belong to the same device.
The tool supports up to two ports per device.
-
The
profilefield expects to receive either abasicorfullprofile.basic profile – includes packet- and port-related counters (i.e., Bandwidth, Packets Per Second, Average Packet Size, Packet Drops)full profile – includes all the basic counters and adds additional debug counters (e.g., ICMC and PCIe counters) For more information about the counters please refer to section "Hardware Counters".
The hardware counters profile can be set from the CLI by adding --hw-profile. For example:
doca_flow_tune monitor -f /tmp/flow_tune_cfg.json --hw-profile basic
Software
The software section includes the flow_port_id and profiles fields:
-
flow_port_idfield – expects a single DOCA Flow port identification number. Flow port ID should be set by the DOCA Flow program, by calling thedoca_flow_port_cfg_set_devargs()API call with a proper port ID string. -
profilesfield – accepts one or more of the supported profiling categories. entries_ops_rates profile – includes both insertion and deletion rates KPIs action_resources profile – provides data on allocated and in-use resources, including counters, meters, and actions memory.
The software profile can be set from the CLI by adding --sw-profile, for example:
doca_flow_tune monitor -f /tmp/flow_tune_cfg.json --sw-profile entries_ops_rates
Analyze Mode
Analyze mode gathers (and later analyzes) information in order to assist users to better understand and debug their DOCA-Flow-based program.
Pipeline Export
This command export an internal state of the DOCA-Flow-based program in a proprietary JSON format. This allows the tool to provide offline information about a given program which can be later be analyzed. One such example is the ability to visualize the pipeline of the target program without having said program run on real hardware.
While the pipeline export operation is meant to encode all relevant information for future analysis, the format itself is proprietary and is only meant to be consumed by other DOCA tools.
Packet Trace
This command parses a PCAP packet from a PCAP file, and simulates the packet's path in the DOCA Flow based-program pipeline and outputs the path in JSON format. This command is useful for debugging and discovering where do packets go in complex pipelines.
This sub-command does not support all pipe and action types. Consequently, results may be inaccurate for pipelines containing unsupported types.
Requirements:
-
A PCAP file must be provided via the
--pcap-fileflag or in the configuration file. Note that if the PCAP file includes more than one packet, only the first packet will be traced. -
A port ID must be provided via the
--port_idflag or in the configuration file. If no port ID was provided then the default is zero -
An output file path must be provided via the
--output-fileflag or in the configuration file.
Output data:
-
A JSON file detailing the path that the packet took, including the match and action values.
Example:
Here we use the DOCA Flow Port FWD Sample, using a PCAP file representing this packet that should match the PORT_FWD_PIPE in the sample:
Ether()/IP(src='1.2.3.4', dst='8.8.8.8')/TCP(sport=1234, dport=80)/Raw(load=b'Sent to port 0, forwarded from port 1')
And then using the analyze command with the --packet-trace sub-command:
doca_flow_tune analyze packet-trace --port-id 0 --pcap-file flow_port_fwd.pcap --output-file /tmp/flow_port_fwd_trace.json
We would get this JSON file (at /tmp/flow_port_fwd_trace.json):
{
	"paths" :
	[
		[
			{
				"entry_id" : 0,
				"match" :
				{
					"fields" :
					[
						"match.packet.outer.l3_type",
						"match.packet.outer.l4_type_ext",
						"match.packet.parser_meta.packet_type.l3_outer",
						"match.packet.parser_meta.packet_type.l4_outer",
						"match.packet.outer.ipv4.src_ip",
						"match.packet.outer.ipv4.dst_ip",
						"match.packet.outer.tcp.src_port",
						"match.packet.outer.tcp.dst_port"
					],
					"values" :
					[
						"DOCA_FLOW_L3_TYPE_IP4",
						"DOCA_FLOW_L4_TYPE_EXT_TCP",
						"DOCA_FLOW_L3_META_IPV4",
						"DOCA_FLOW_L4_META_TCP",
						"1.2.3.4",
						"8.8.8.8",
						"1234",
						"80"
					]
				},
				"name" : "PORT_FWD_PIPE",
				"result" : "hit",
				"type" : "pipe"
			},
			{
				"name" : "port 1",
				"type" : "port"
			}
		]
	]
}
This JSON describes that there is only one path (because there is only one element in the "paths" array), and the path includes:
-
PORT_FWD_PIPEThe packet matched on the pipe ("result": "hit").The entry that matched was the first entry ("entry_id": 0).Includes the details on the fields that matched and their values.
-
Port 1
Know Issues:
-
Actions of the following types are not supported:Crypto/Crypto EncapNAT64Push VLAN
-
Pipes of the following types are not supported:LPMCTACL
Visualize Mode
The doca_flow_tune visualize command generates a visual representation of a DOCA Flow pipeline using the Mermaid diagram format.
Supported Pipe Types
The following pipe types are supported in visualization mode:
-
Basic
-
Control
-
Hash
-
CT – Fully supported in the Base and Resources layers. For other layers, the visualization results may be inaccurate.
-
Ordered List – Fully supported in the Base and Resources layers. For other layers, the visualization results may be inaccurate.
Viewing the Pipeline
Running the visualize command produces a Mermaid-format file representing the pipeline structure. Mermaid is a text-based diagramming language supported by many documentation tools and editors. One commonly used online editor is Mermaid Live, which can be used to render and inspect the generated pipeline diagram.
To view the pipeline:
-
Open Mermaid Live.
-
Copy the contents of the generated
.mmdfile. -
Paste the contents into the editor to visualize the pipeline.
Visualization Layers
Each Mermaid diagram can include multiple layers, each offering a distinct view into pipeline characteristics. If no specific layer is selected, the base layer is used by default.
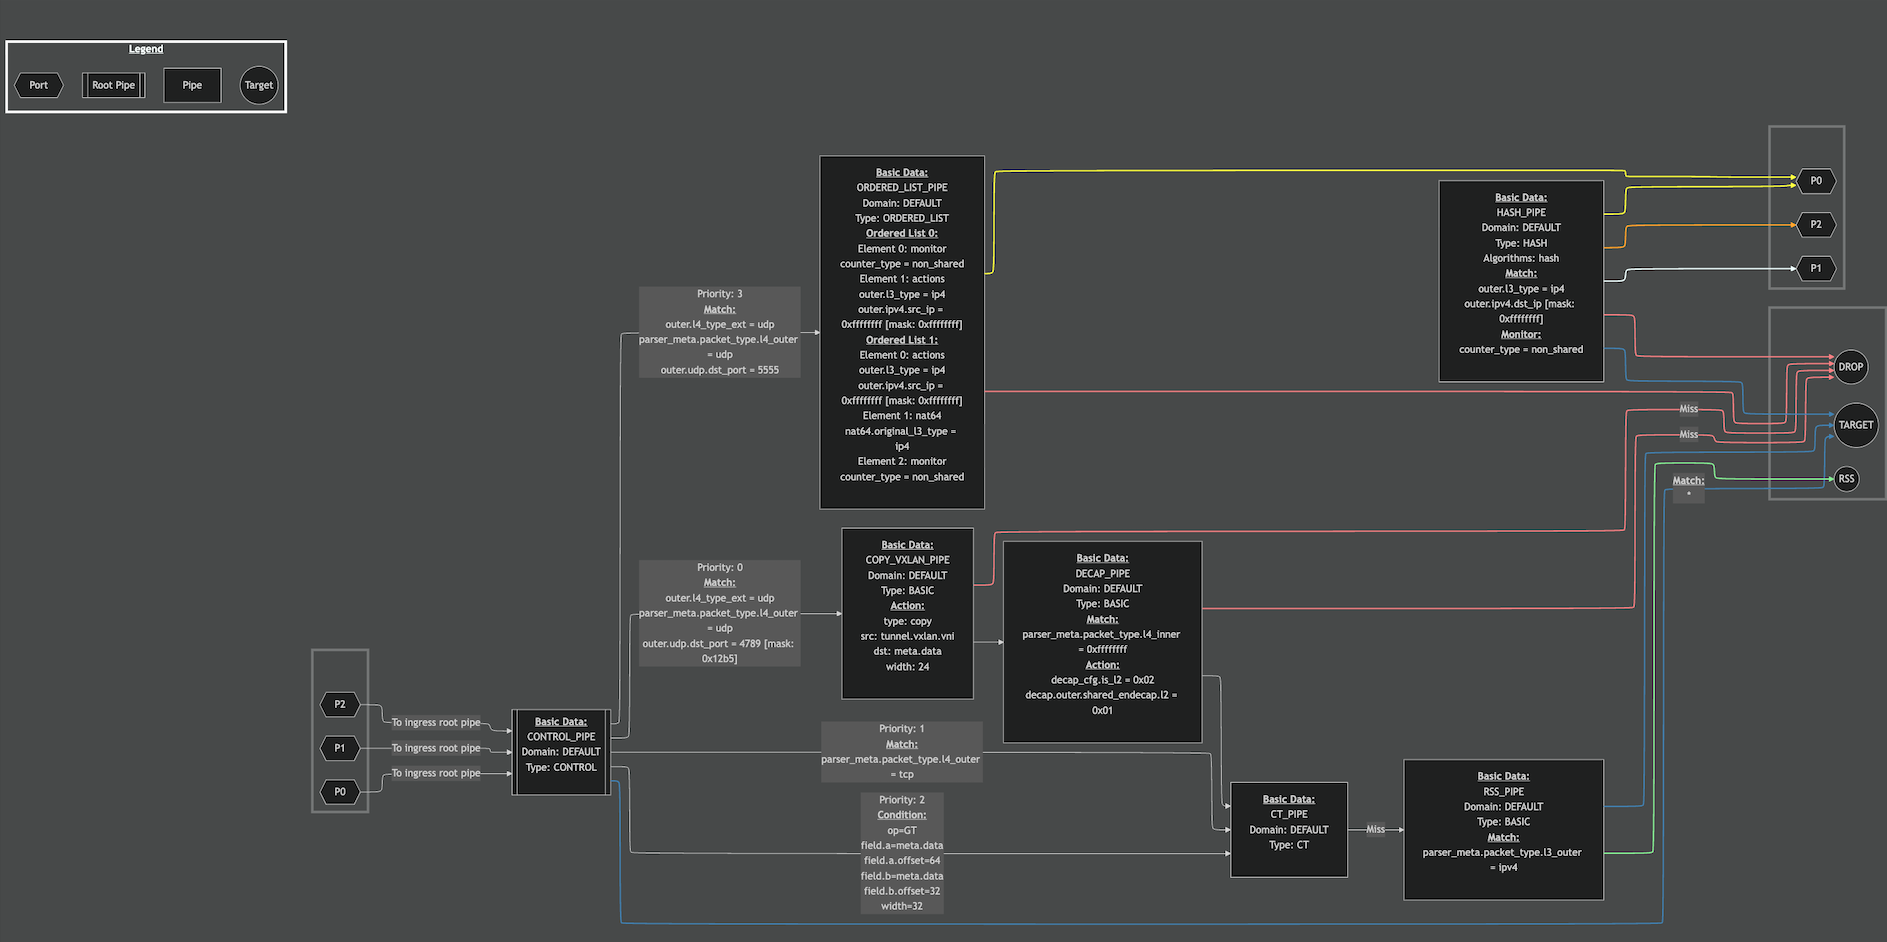
Base Layer
This layer visualizes the static configuration of the DOCA Flow pipeline, including:
-
Pipe node data:NameLabelPort IDDomainTypeMask configurationDefined actionsMonitor attributes
-
Pipe link (arrow) data:For Control pipes: Priority, condition and matching values (e.g., * indicates match-all).For other pipes: Miss links are marked accordingly.
Using --enhanced, pipe links going into DROP/TARGET/RSS/PORT will be colored to ease the paths identification.
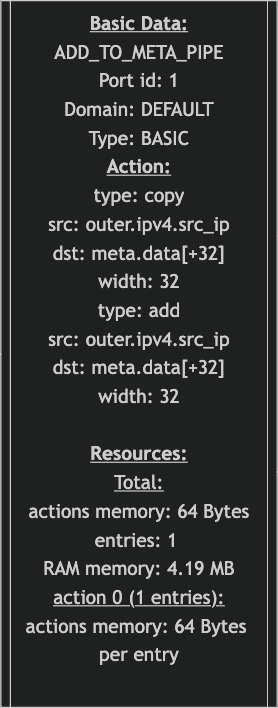
Resources Layer
Enabled via the --resources flag, this layer adds information about resource utilization:
-
Pipe node data:Total number of actions in use by entries (all pipe types)Resource breakdown per action (non-Control pipes only)
-
Resources visualized:CountersMetersActions memoryEntry countRAM usage
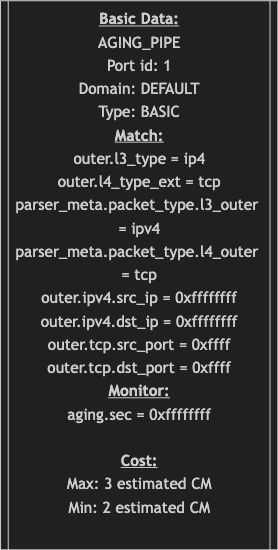
Cost Layer
Enabled via the --cost flag, this layer estimates the cache impact of processing packets through the pipeline:
-
Minimum and maximum estimated cache misses per pipe
-
Helps identify high-cost areas in the pipeline
Critical Path Layer
Enabled via the --critical-path flag, this layer highlights the pipeline path with the highest estimated processing cost (i.e., the path with the most cache misses). If multiple paths are tied, one is selected arbitrarily.
Distribution Layer
The Distribution Layer is not supported in DOCA version 3.4. Refer to DOCA 3.3 for supported functionality.
Enabled via the --distribution flag, this layer simulates traffic flow through the pipeline using a PCAP input file.
This layer does not support all pipe types. Consequently, results may be inaccurate for pipelines containing unsupported types.
Requirements:
-
A PCAP file must be provided via the
--pcap-fileflag or in the configuration file. -
The
low_level_infoparameter must be set totruein the configuration when performing offline analysis.
Output data:
-
Pipe node data:Distribution: Displays the percentage of total packets that passed through this specific pipe.Example: Total: 62%
-
Pipe link data:Distribution: Displays the percentage of packets from the source pipe that traversed this specific link.Example: Pipe: 78%
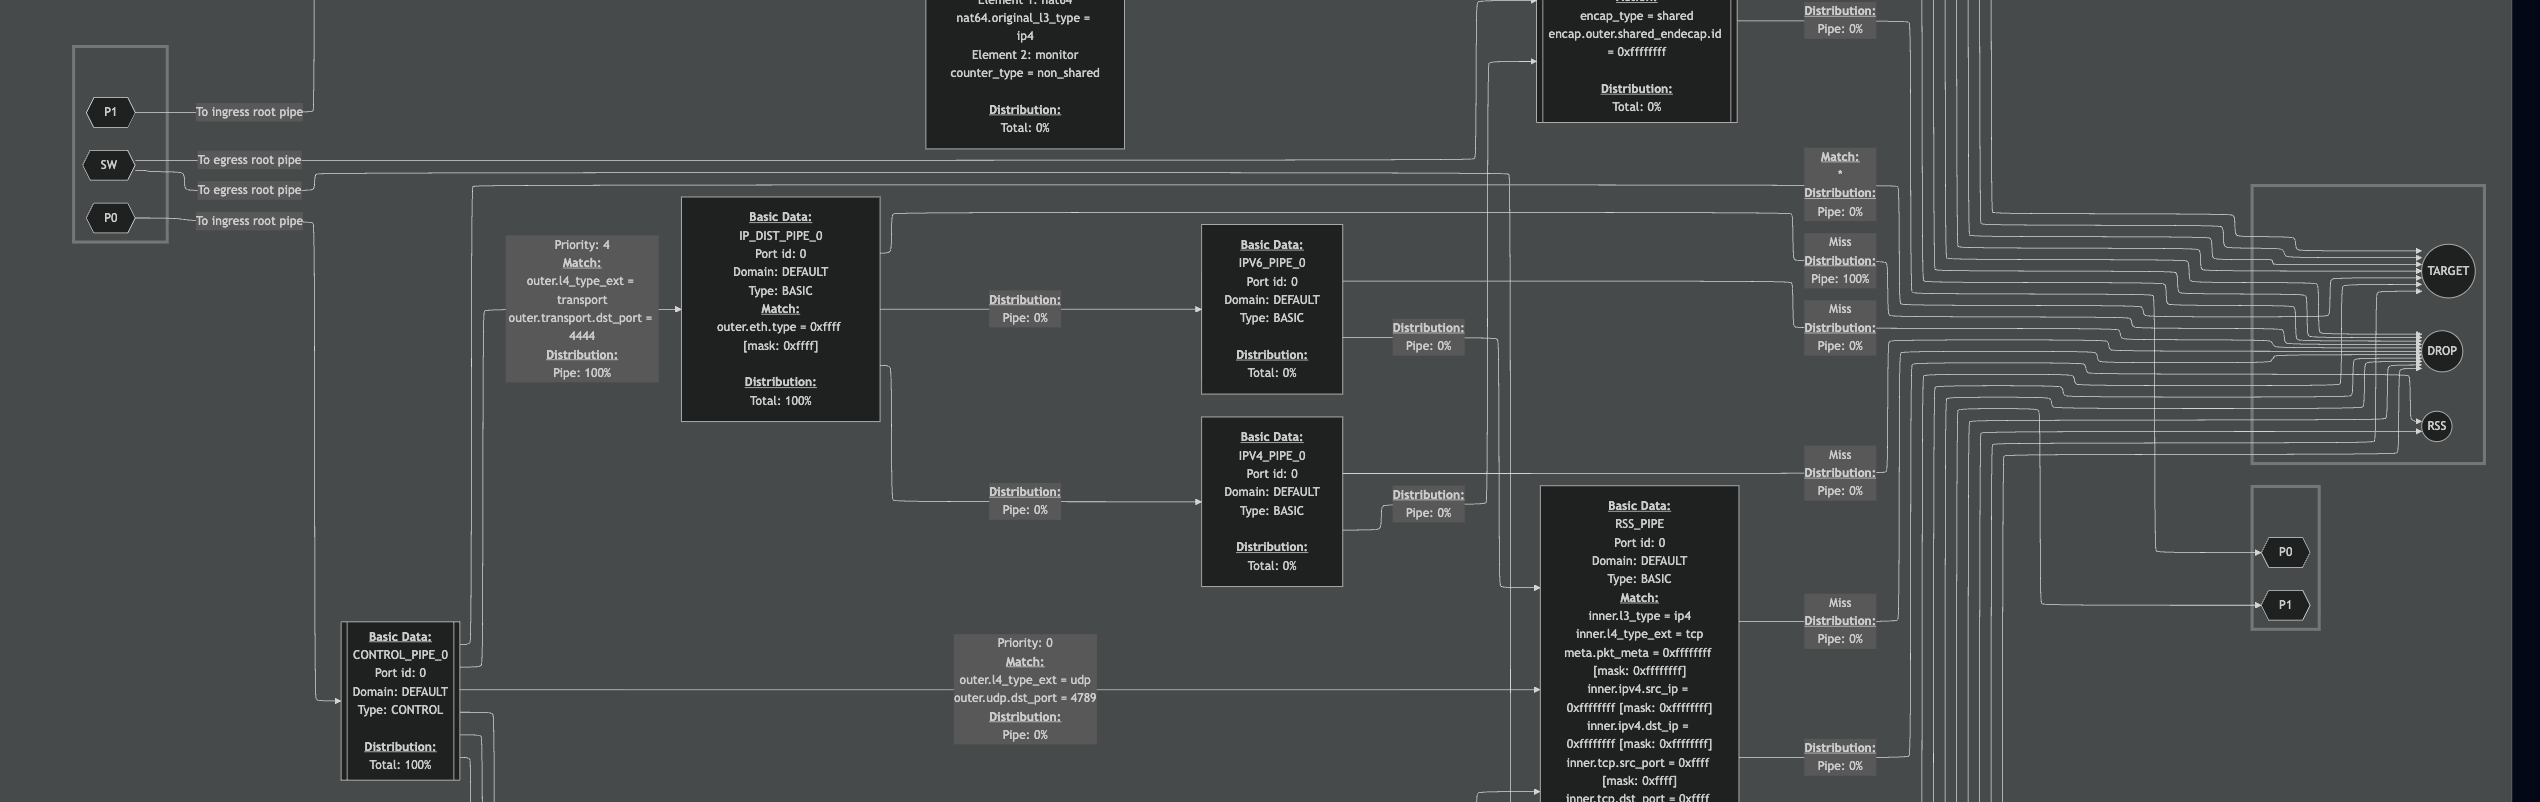
In the partial diagram above, packets can be observed flowing along the following path: Port 0 → CONTROL_PIPE_0 → IP_DIST_PIPE_0 → DROP.
Known Issues
-
Match values for the following fields are not supported:
-
outer.l2_type -
outer_l3_type -
outer_l4_type -
tun.gre.protocol -
tun.key_present
-
-
The Distribution layer functions only when using supported match fields. Unsupported fields may result in inaccurate or incomplete packet flow analysis.
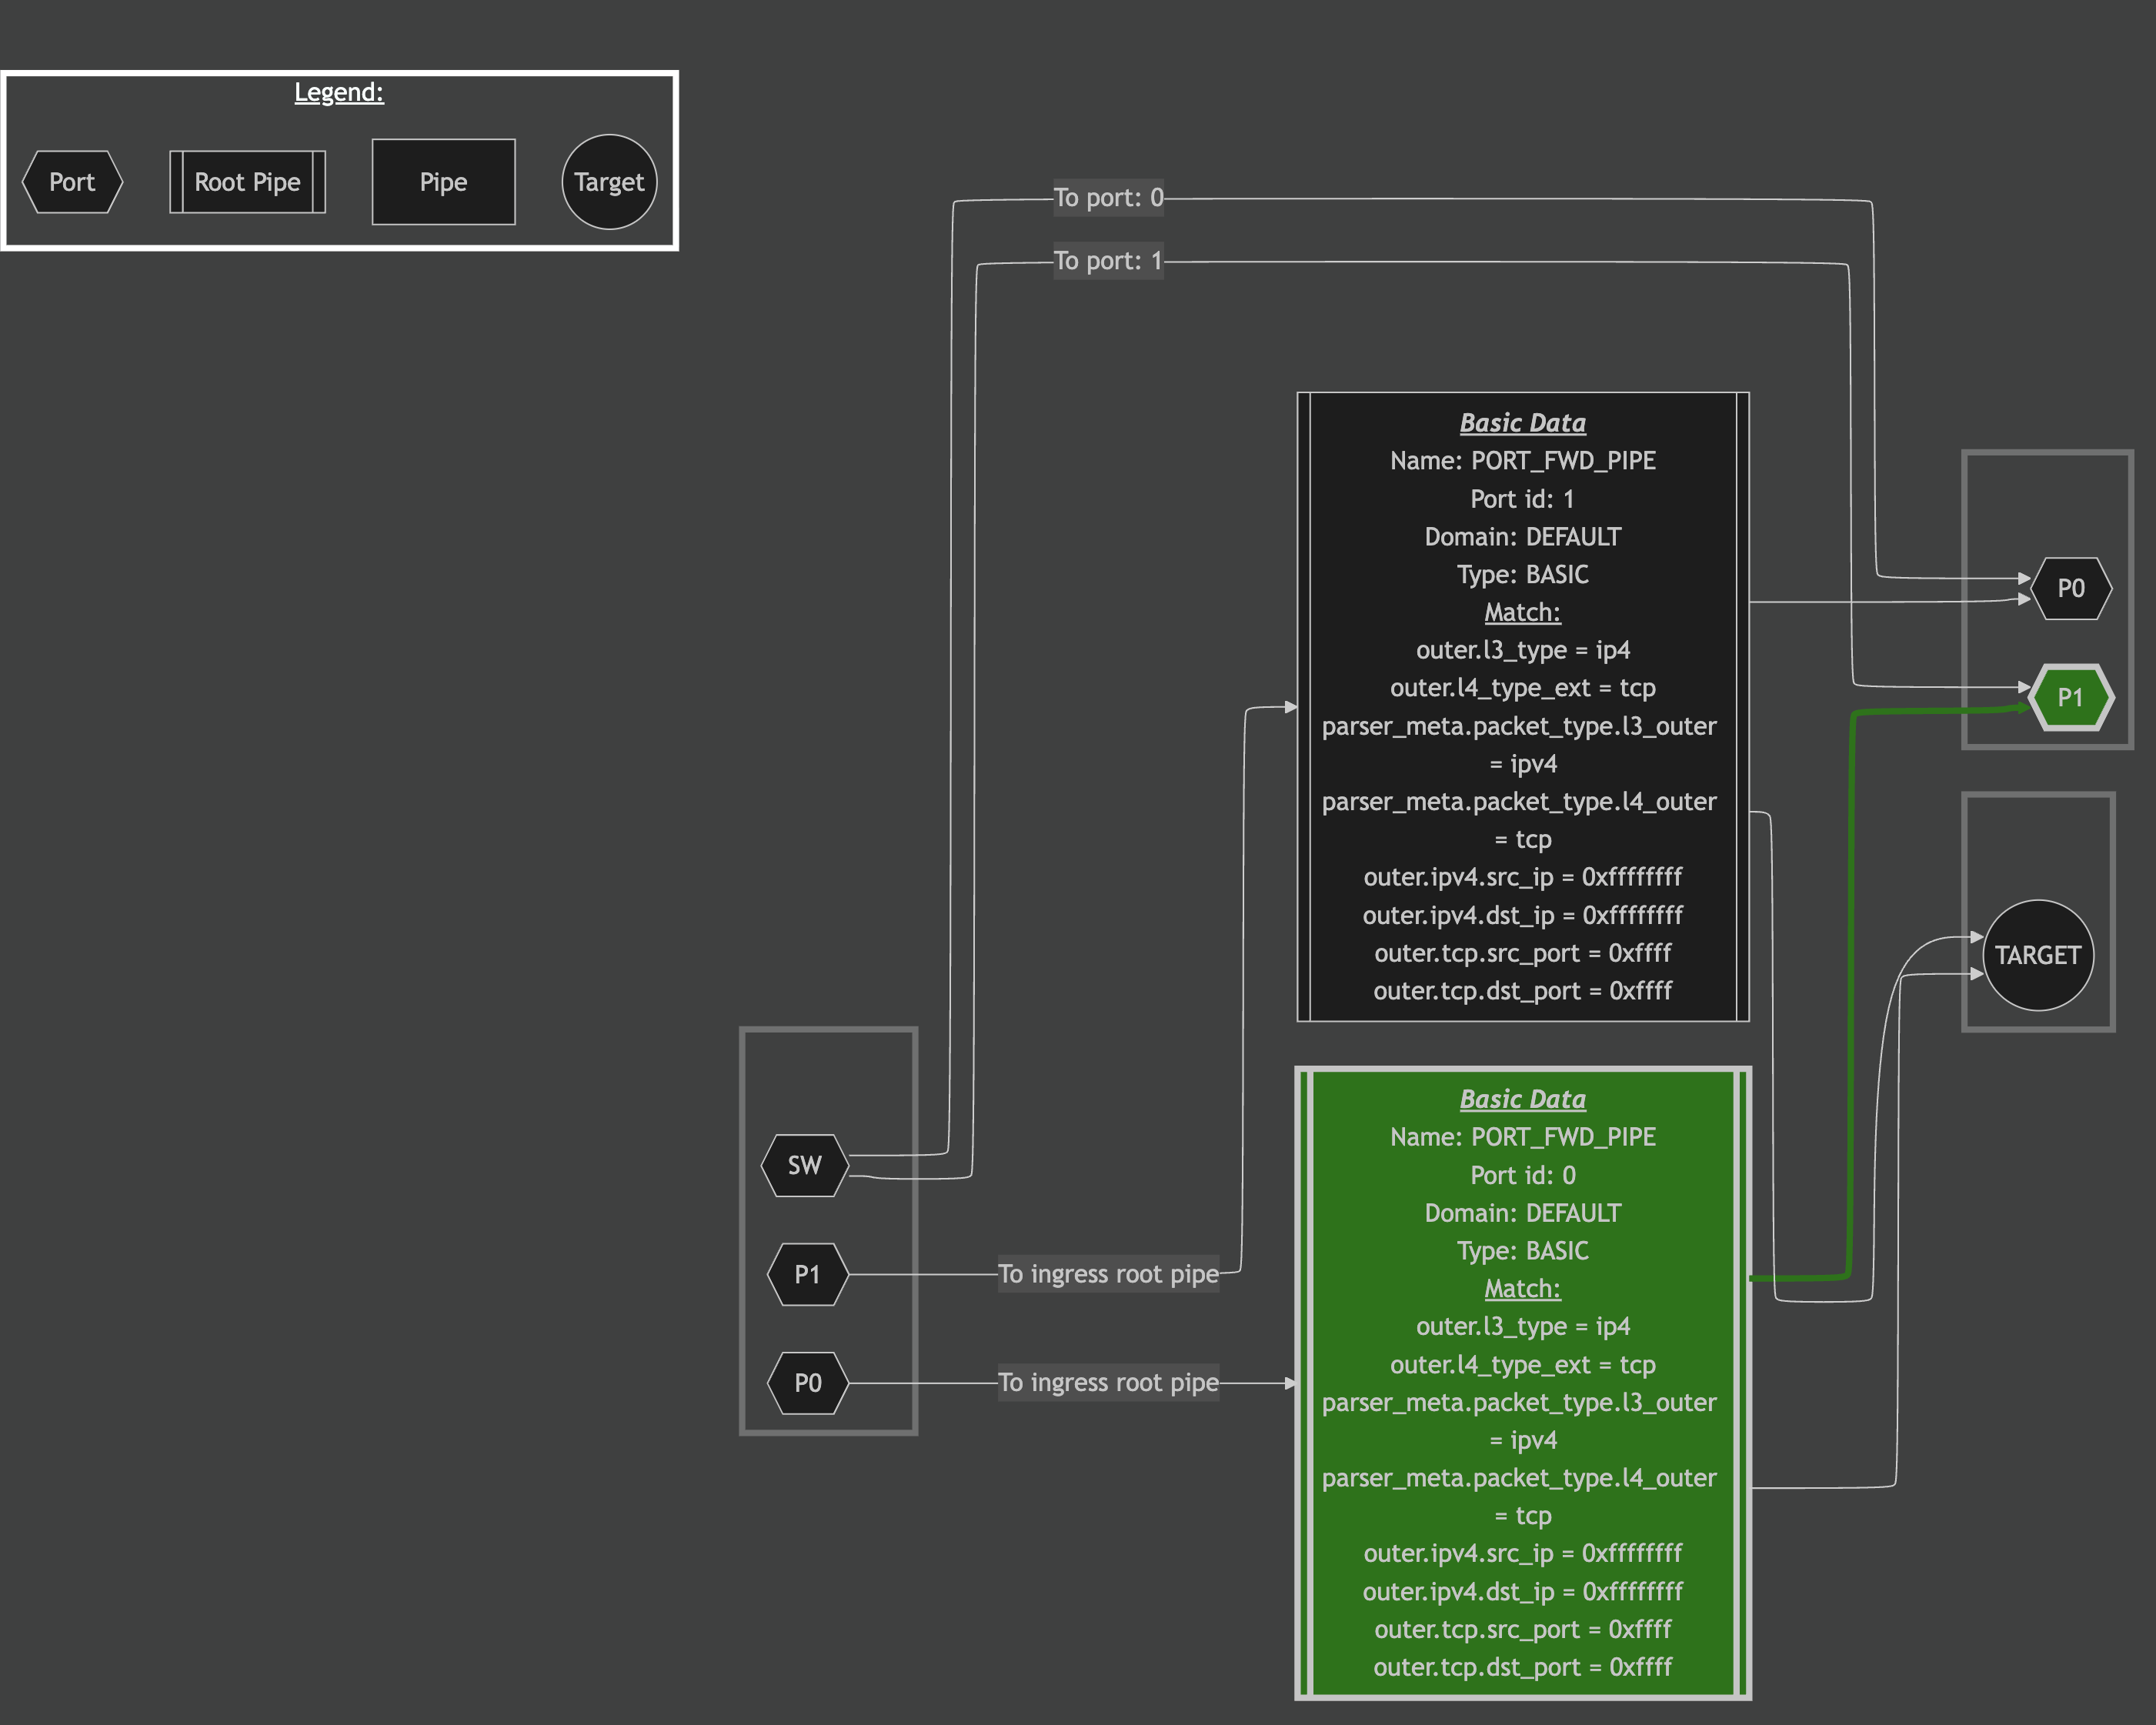
Packet Trace Level
Enabled via the --packet-trace flag, this layer simulates a packet's path through the pipeline.
This layer does not support all pipe and action types. Consequently, results may be inaccurate for pipelines containing unsupported types.
Requirements:
-
A PCAP file must be provided via the
--pcap-fileflag or in the configuration file. (Note: If the PCAP file includes more than one packet, only the first packet will be traced). -
A port ID must be provided via the
--port-idflag or in the configuration file. If no port ID is provided, the default is0.
Output data:
-
The path (nodes and links) that the packet traversed will be colored green.
In this example, the DOCA Flow Port FWD Sample is used alongside a PCAP file representing a packet that should match the PORT_FWD_PIPE:
Ether()/IP(src='1.2.3.4', dst='8.8.8.8')/TCP(sport=1234, dport=80)/Raw(load=b'Sent to port 0, forwarded from port 1')
Use the visualize command with the --packet-trace flag:
doca_flow_tune visualize --packet-trace --port-id 0 --pcap-file flow_port_fwd.pcap
This generates the following Mermaid diagram:
Known Issues
-
Actions of the following types are not supported:
-
Crypto/Crypto Encap
-
NAT64
-
Push VLAN
-
-
Pipes of the following types are not supported:
-
LPM
-
CT
-
ACL
-
-
The Packet Trace layer functions properly only when using supported actions. Unsupported actions may result in inaccurate or incomplete packet flow analysis.
Recommendations Layer
When enabled using the --recommendations flag, this layer identifies and highlights pipeline components that can be optimized for better performance.
Supported insights:
-
Action and action description split recommendations. This insight enables the tune tool to suggest splitting pipes that contain actions which can benefit from separation. By dividing these pipes into two, the system optimizes the steering processing path, improving overall performance.
Use Cases
Actions Memory Calculation
The DOCA Flow API requires the application to configure the maximum actions memory using the doca_flow_port_cfg_set_actions_mem_size() function. There are two strategies for determining the optimal value:
Measured Strategy
-
Configure the application with the maximum supported actions memory.
-
Run the application under expected load.
-
Execute the Flow Tune tool in Monitor mode.
-
Use the reported memory usage from the tool to determine the optimal actions memory size.
-
Update the application configuration to match the measured usage, ensuring compliance with the DOCA Flow API.
Calculated Strategy
-
Start with a minimal actions memory size in the application configuration.
-
After pipe creation (but before adding entries), run the Flow Tune tool in Visualization mode with the Resources Layer enabled.
-
For each pipe:
-
Multiply the expected number of entries by the reported actions memory per entry.
-
-
Sum the memory requirements across all pipes to obtain the total actions memory needed.
-
Set this value in the application using the appropriate DOCA Flow API.
Counter Observation
Use the tool in Monitor mode to observe hardware and software counters in real time. The tool provides per-second updates on:
-
Entry insertion and deletion rates
-
Memory and resource utilization
-
Other performance metrics
This helps identify performance bottlenecks and track system behavior under load.
Program Pipeline Visualization
By running the tool in Visualization mode, the developer can:
-
Generate a graphical representation of the DOCA Flow program pipeline
-
Understand the packet processing path and logic
-
Debug and validate flow construction
-
Optimize the pipeline for performance and correctness
Identifying Bottle Neck Pipes
Running the tool in Visualization mode with the --cost and --critical-path flags enables detection of performance-critical paths:
-
Highlights pipes with the highest cache miss estimates
-
Marks the most critical path (i.e., the slowest or most resource-intensive)
-
Helps developers focus optimization efforts on the slowest segments of the pipeline
Troubleshooting
Telemetry fwctl driver is not loaded
Error
When running the DOCA Flow Tune in Monitor mode, the following log messages are encountered at startup:
[DOCA][WRN][priv_doca_telemetry_fwctl.cpp:121][priv_doca_telemetry_fwctl_find_device_by_pci] Failed finding fwctl device: Opening directory /sys/class/fwctl/ failed. Make sure you have the fwctl driver loaded
[DOCA][ERR][priv_doca_telemetry_fwctl.cpp:201][priv_doca_telemetry_fwctl_open_by_devinfo] devinfo 0x55c572286520: Failed to open fwctl device: Failed to find matching fwctl device
Solution
The DOCA Telemetry SDK uses the fwctl driver to query the hardware counters, so it is essential to have it installed and loaded.
Step 1: Verify the Driver Installation
First, check if the driver is installed as follow:
-
Debian/Ubuntu:
$ sudo apt list --installed | grep fwctl
-
RHEL:
$ sudo yum list installed | grep fwctl
If the driver is not installed, install it by running the following commands:
-
Debian/Ubuntu:
$ sudo apt search fwctl
>> <fwctl-package-name>/....

$ sudo apt install -y <fwctl-package-name>
-
RHEL:
$ sudo yum search fwctl
>> <fwctl-package-name>/....

$ apt/yum install -y <fwctl-package-name>
Step 2: Check if the Driver is Loaded
After installing the driver, verify that it is loaded by executing:
$ sudo lsmod | grep fwctl
You should see output similar to:
> mlx5_fwctl 20480 0
> fwctl 16384 1 mlx5_fwctl
> mlx5_core 2134016 2 mlx5_fwctl,mlx5_ib
> mlx_compat 69632 14 rdma_cm,ib_ipoib,mlxdevm,mlxfw,mlx5_fwctl,iw_cm,ib_umad,fwctl,ib_core,rdma_ucm,ib_uverbs,mlx5_ib,ib_cm,mlx5_core
If the driver is not loaded, load it by running:
$ sudo modprobe mlx5_fwctl
Mermaid visualization in Visual Studio Code
Visual Studio Code provides extensions to view Mermaid markdown format, these extensions can be used to view the Mermaid output from DOCA Flow Tune tool.
However, for these extension to work, DOCA Flow Tune tool should run with --tag.
Limited Feature Set – Could Not Detect Running DOCA Flow Program
Error
When running DOCA Flow Tune, the following log message is encountered at startup, followed by some features failing to work/load:
[DOCA][WRN][flow_tune.cpp:195][get_flow_app_data] Could not detect a running DOCA Flow program, some features will be impacted
Solution
Some features of DOCA Flow Tune work by interacting with a live DOCA-Flow-based program. This is enabled through a server running in the background as part of the DOCA Flow library, and requires all of the following to be applied:
-
DOCA-Flow-based program should explicitly enable the server. More information is available in the DOCA Flow Tune Server programming guide.
-
DOCA-Flow-based program should run using the "trace enabled" DOCA Flow library. More information is available in the "Debug and Trace Features" section of the DOCA Flow programming guide.\
visualize --cost or --critical-path Not Working
Error
When running DOCA Flow Tune in visualize mode with the --cost or --critical-path flags, the following error may occur:
2025-04-14 12:24:20 - flow_tune - ERROR - Low level info need to be enabled to visualize cost or critical path
2025-04-14 12:24:20 - flow_tune - ERROR - Failed to export mermaid graph
2025-04-14 12:24:20 - flow_tune - ERROR - DOCA Flow Tune failed during "visualize" command: Invalid input
2025-04-14 12:24:20 - flow_tune - ERROR - DOCA Flow Tune finished with errors
Solution
The --cost and --critical-path options require low-level pipeline information, which is not enabled by default.
To resolve this issue, ensure that "low_level_info": true is specified in one of the following ways:
-
Option 1 – configuration file:
Make sure the config file (doca_flow_tune visualize --cost -f /tmp/flow_tune_cfg.json
flow_tune_cfg.json) includes:"analyze": { "low_level_info": true } -
Option 2 – offline pipeline description:
Ensure thatdoca_flow_tune visualize --cost --pipeline-desc my_program_pipeline_desc.json
my_program_pipeline_desc.jsonwas originally exported with"low_level_info": trueenabled during analysis or dump.
Appendix – Configuration File Example
{
	"outputs_directory": "/tmp/flow_tune/",
    "logging": {
		"developer_log": "/var/log/doca/flow_tune/flow_tune_dev.log",
		"operational_log": "/var/log/doca/flow_tune/flow_tune.log"
	},
	"network": {
		"server_uds": "/tmp/tune_server.sock",
		"uds_directory": "/var/run/doca/flow_tune/"
	},
	"dumper": {
		"enable": false,
		"file_name": "flow_tune.csv",
	    "format_type": "csv",
		"max_size_bytes": 1000000000,
		"max_files": 1
	},
	"analyze": {
		"file_name": "flow_tune_pipeline_desc.json",
	    "low_level_info": false
	},
	"visualize": {
		"pipeline_desc_file": "/tmp/flow_tune/flow_tune_pipeline_desc.json",  // Non-mandatory field
		"file_name": "flow_tune_pipeline_vis.md",
		"pcap_file": "sample_pcap.pcap"
	},
	"monitor": {
		"screen_mode": "light",
		"hardware": {
			"pci_addresses": [
				"08:00.0",
				"08:00.1"
			],
			"profile": "full"
		},
		"software": [
			{
				"flow_port_id": 0,
				"profiles": [
					"entries_ops_rates",
					"action_resources"
				]
			},
			{
				"flow_port_id": 1,
				"profiles": [
					"entries_ops_rates",
					"action_resources"
				]
			}
		]
	}
}
Where:
-
outputs_directory– Main directory on which all output products are saved. This field does not have a default value. If no value is provided, DOCA Flow Tune files are saved at the following directories:Dumper file – /tmp/flow_tune/ Analyze export pipeline description file – /tmp/flow_tune/ Pipeline visualization file – /tmp/flow_tune/ -
logging- Log files directory.developer_log – developer level log file.operational_log – user level log file. -
network-
server_uds– DOCA Tune Server Unix Domain Socket (UDS) path. Default value is/tmp/tune_server.sock. -
uds_directory– Directory on which all local UDS is created. Default value is/var/run/doca/flow_tune/.
-
-
dumper-
enable– true if information should be saved into a dump file. Default value isfalse. -
file_name– Dump filename. Default value isflow_tune.json. -
format_type– The dump file formatCSVorJson. Default value isJson. -
max_size_bytes– The file maximum size in bytes. When the limit is reached, a new file is created. Default value is1Gb.. -
max_files– Maximum CSV files to create. Default value is1.
-
-
analyze-
file_name– Flow program pipeline description filename. File is created underoutputs_directorypath. Default value isflow_tune_pipeline_desc.json. -
low_level_info– Pipeline description JSON file to include low level information.
-
-
visualize-
pipeline_desc_file– Flow program pipeline description input file path. This file is the product of theanalyze exportcommand. If not provided, then thevisualizecommand triggers a creation of it (a run ofanalyze export). -
file_name– Flow program pipeline visualization filename. File is created under theoutputs_directorypath. Default value isflow_tune_pipeline_vis.md. -
pcap_file– PCAP file to use when running distribution algorithm.
-
-
monitor-
screen_mode– Monitor command theme to be used. Default value islight. -
hardware-
pci_addresses– List of PCIe addresses which DOCA Flow Tune should inspect. -
profile– Hardware profile to be used for each PCIe address given. Default value isfull.
-
-
software-
flow_port_id– Flow program port identification number which DOCA Flow Tune should inspect. -
profiles– List of software profiles to be used for the specific port identification number given. Default value is[entries_ops_rates].
-
-
Last updated: