

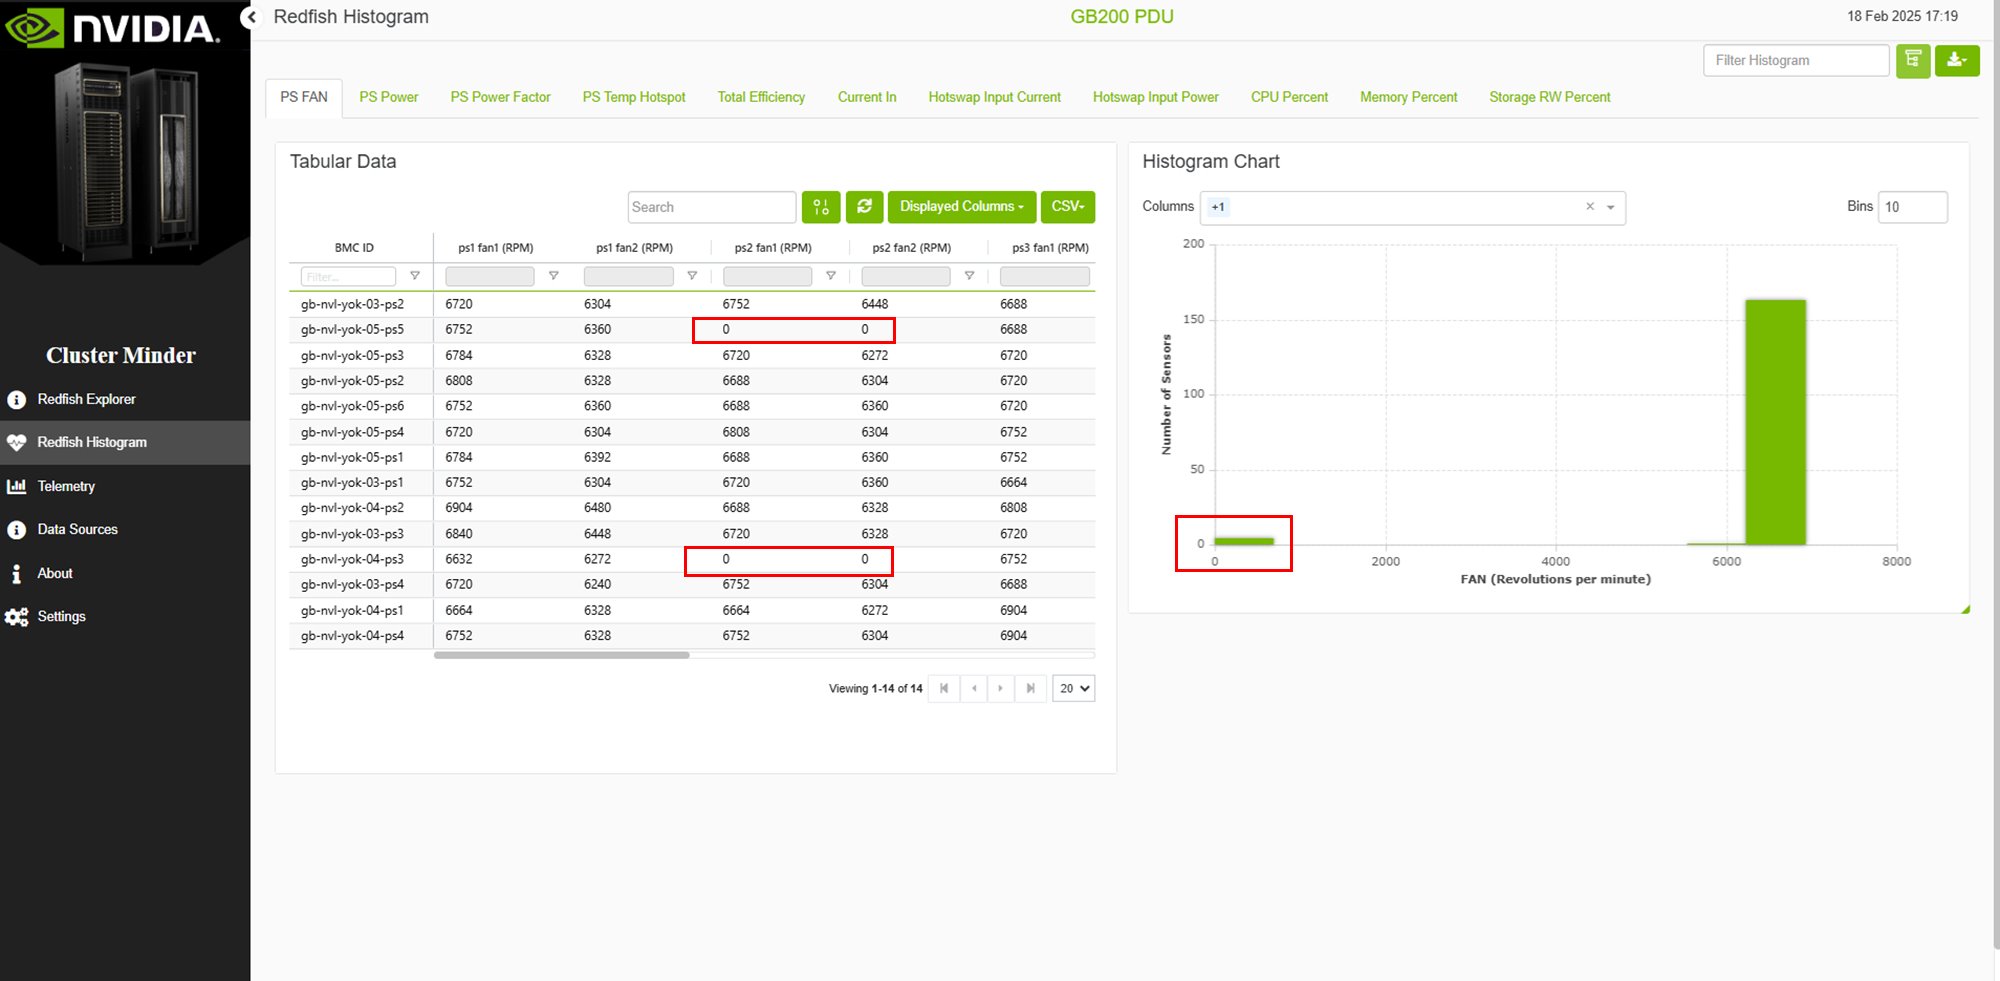
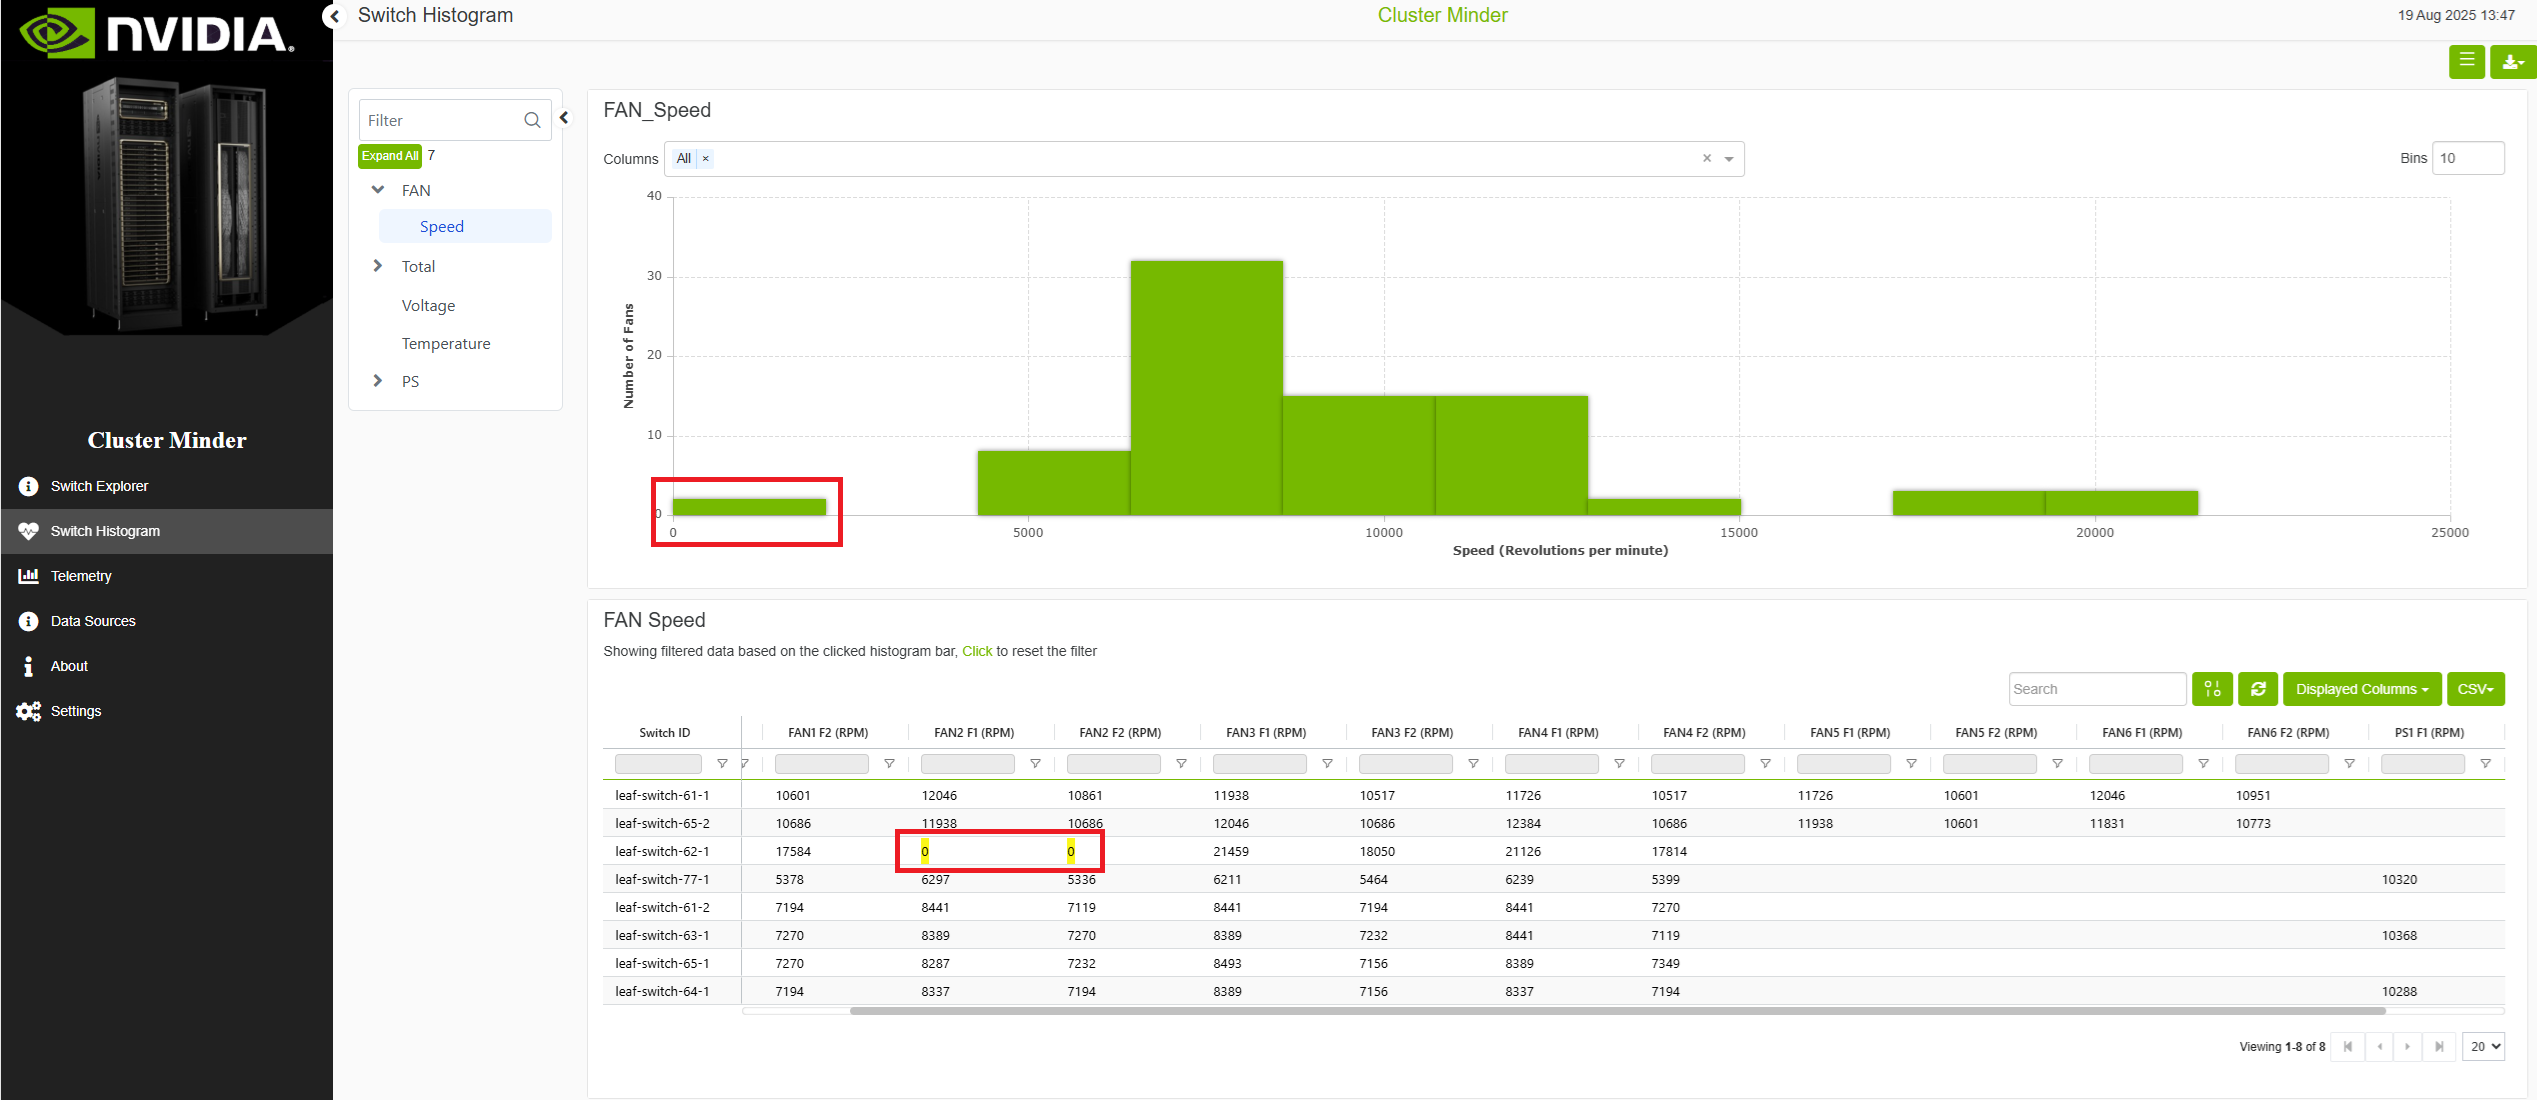
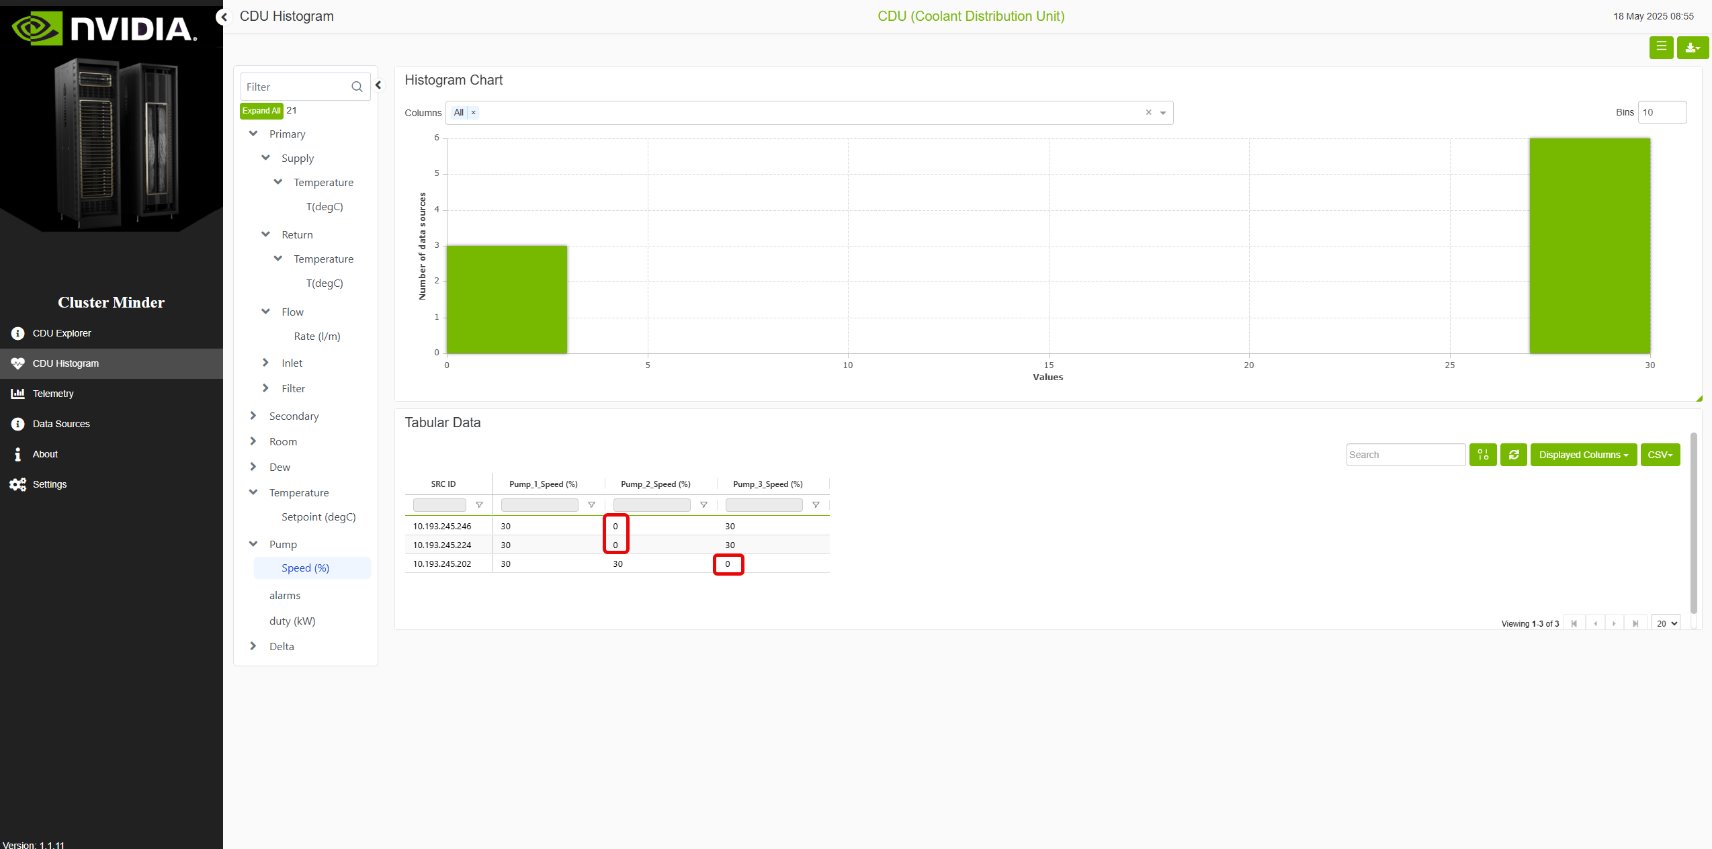
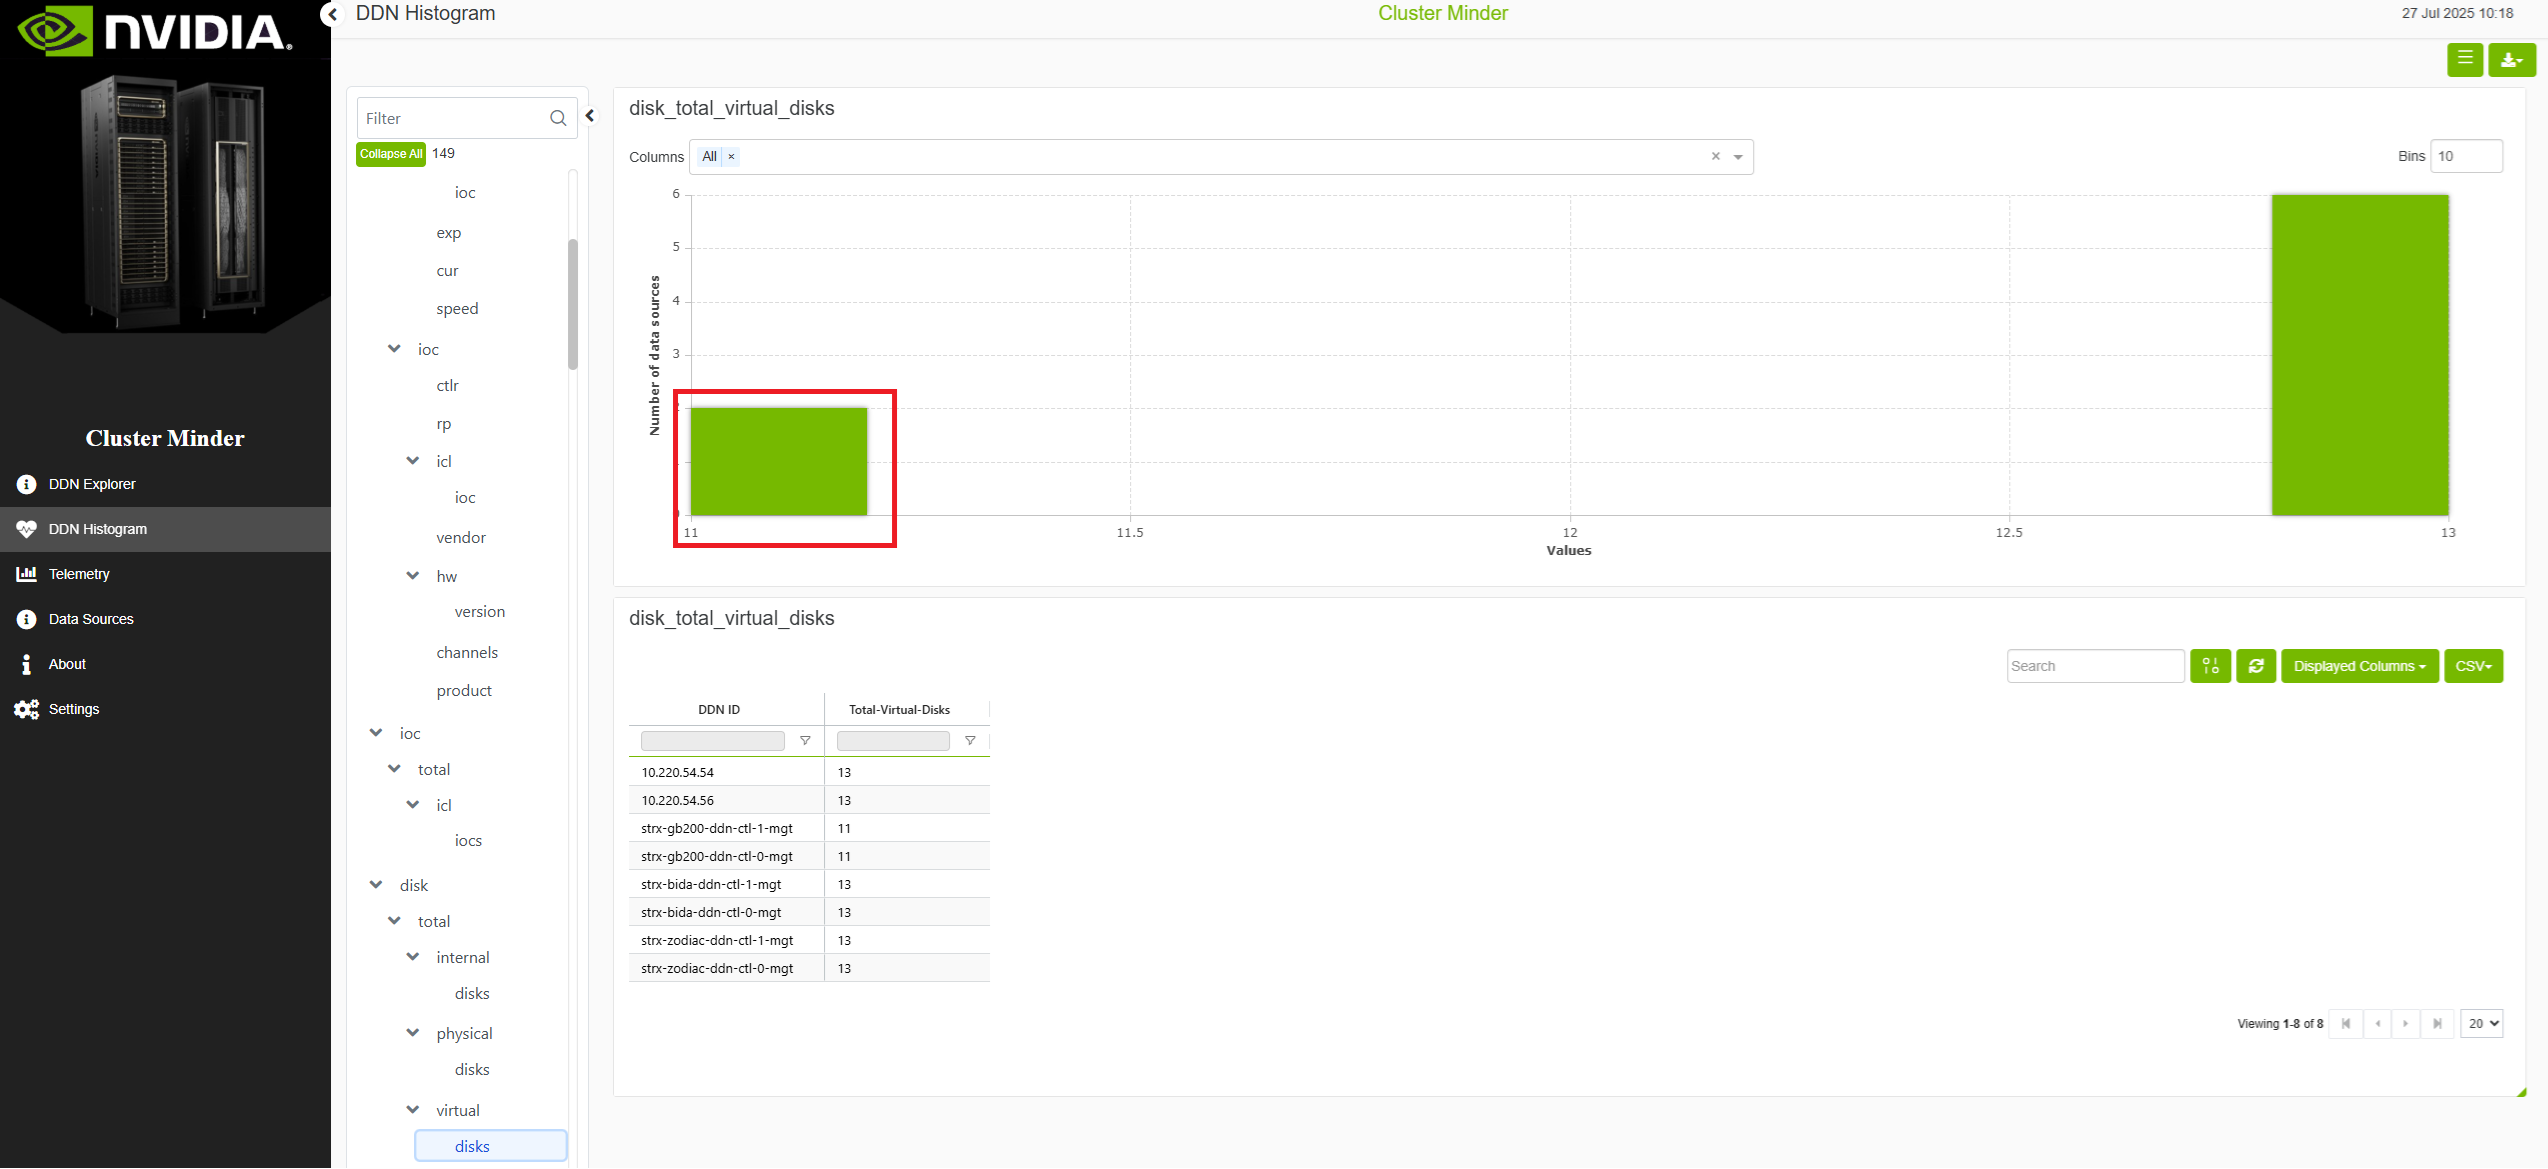
ClusterMinder's histogram feature makes data visualization straightforward. Histograms are premade according to the type of data source and the make and model, and cover quantities such as RPM speeds, voltages, wattage, amperage, temperatures (Celsius), and more. Clicking a histogram filters specific hosts or values for more targeted analysis, and the dropdown menu narrows the histogram bars further to focus on specific data subsets and attributes.
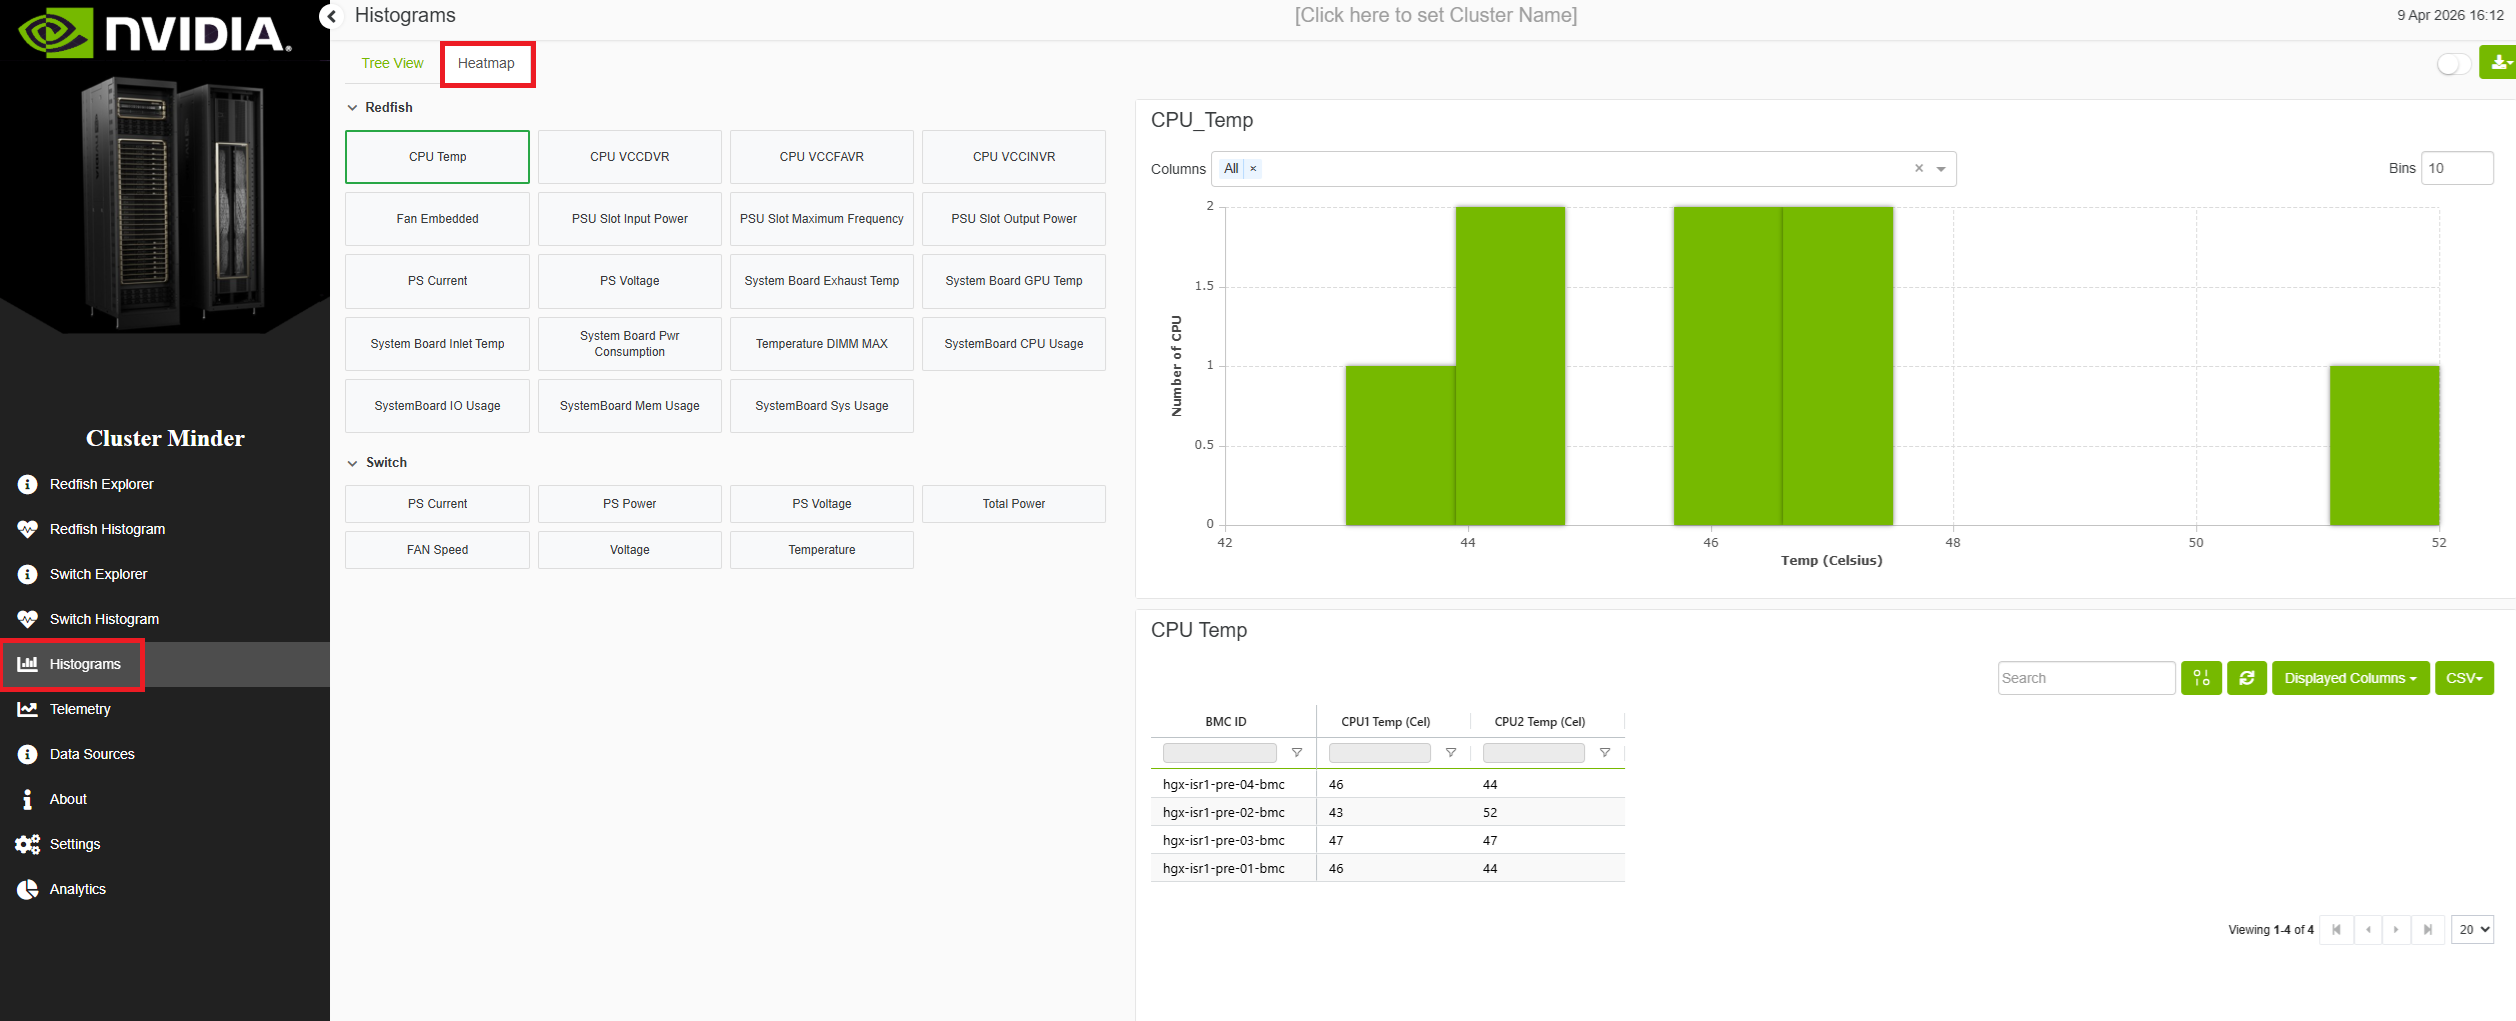
Each data module has its own histogram page containing the charts relevant to that module. In addition, the Histograms page lists every available histogram in one place, with charts grouped under the module they belong to, so all histograms can be browsed without switching modules.
A Heatmap tab is available on every histogram-related page, including each module's histogram view and the aggregate Histograms page. It presents the same histograms in a heatmap layout, making it possible to compare patterns across metrics at a glance.
Redfish Histogram Example
Switch Histogram Example
CDU Histogram Example
DDN Histogram Example
Additional Features
Icons
|
Icon |
Description |
|---|---|
|
|
Enables (from left to right) switching the histogram to tree view and downloading histograms. |
|
|
Enables (from left to right) updating data, refreshing data, selecting the columns to display, and downloading data in CSV format. |
|
|
Enables viewing histograms with outlier values only. |



Last updated: