

The Telemetry page lets you view and build graphs from collected data. Pre-built graphs are available depending on the data source. A tree view toggle is available.
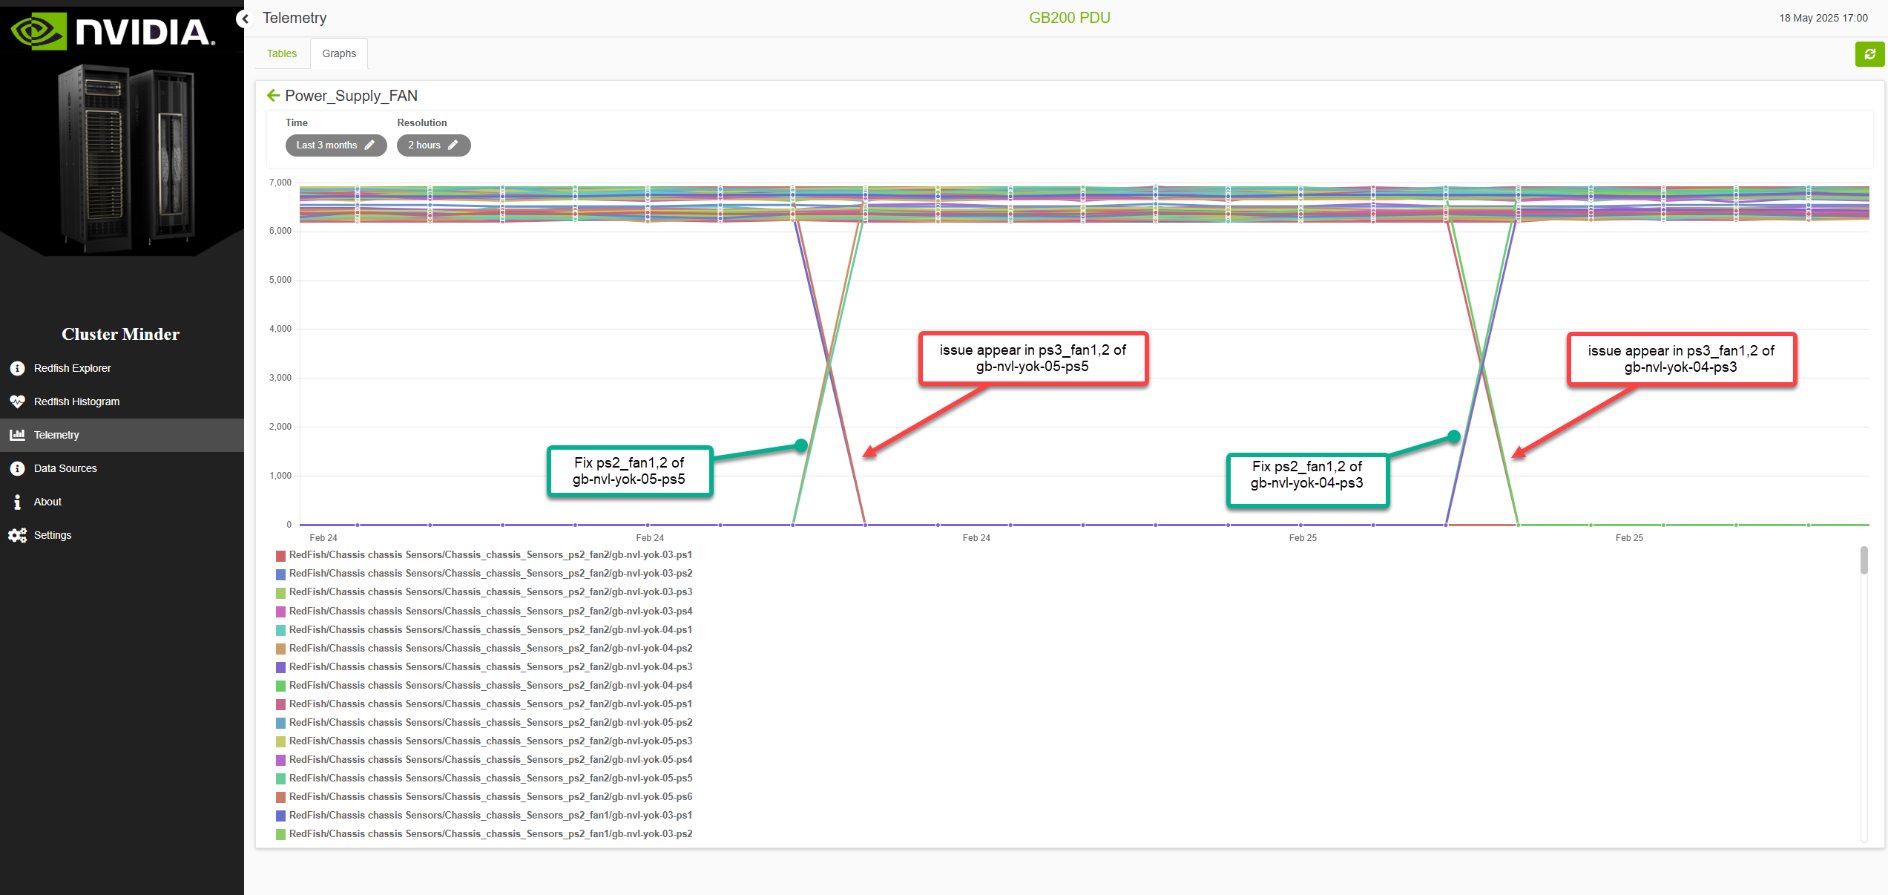
Redfish Telemetry Example
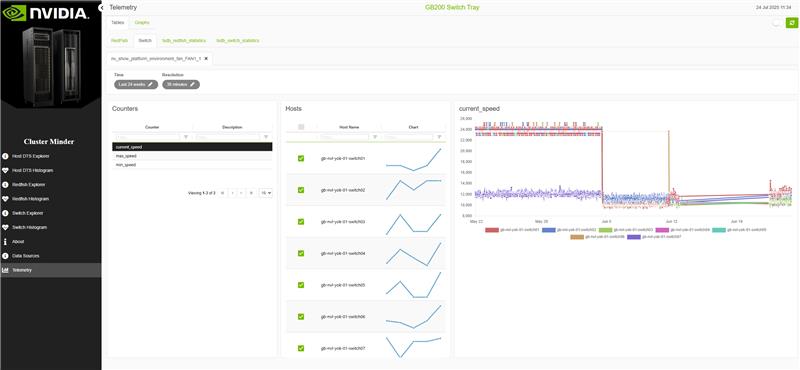
Switch Telemetry Example
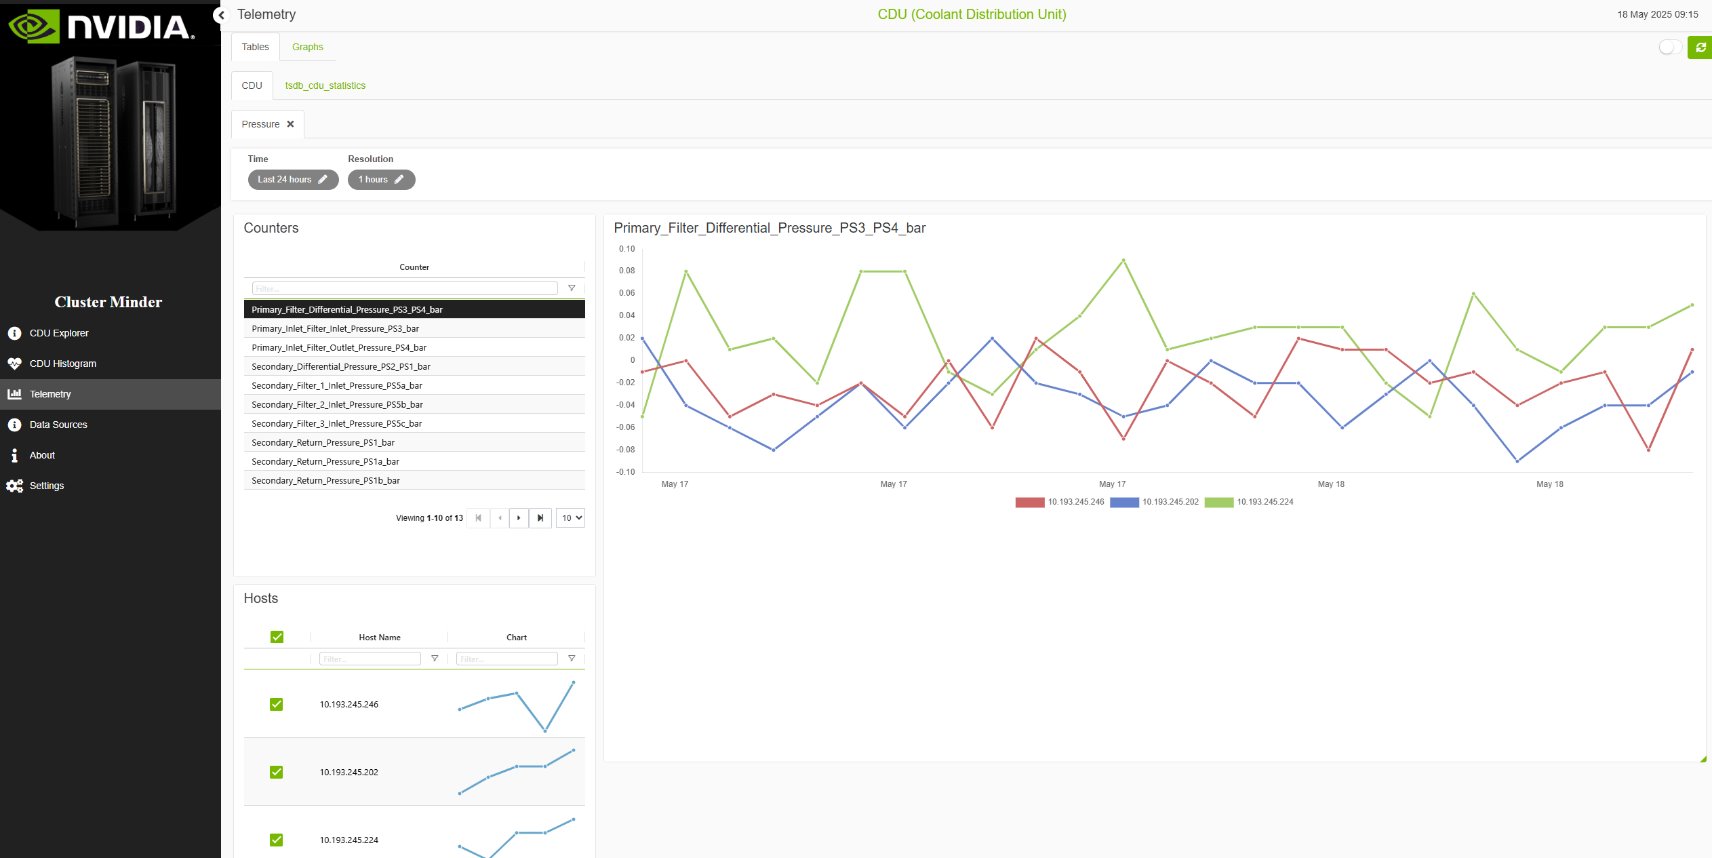
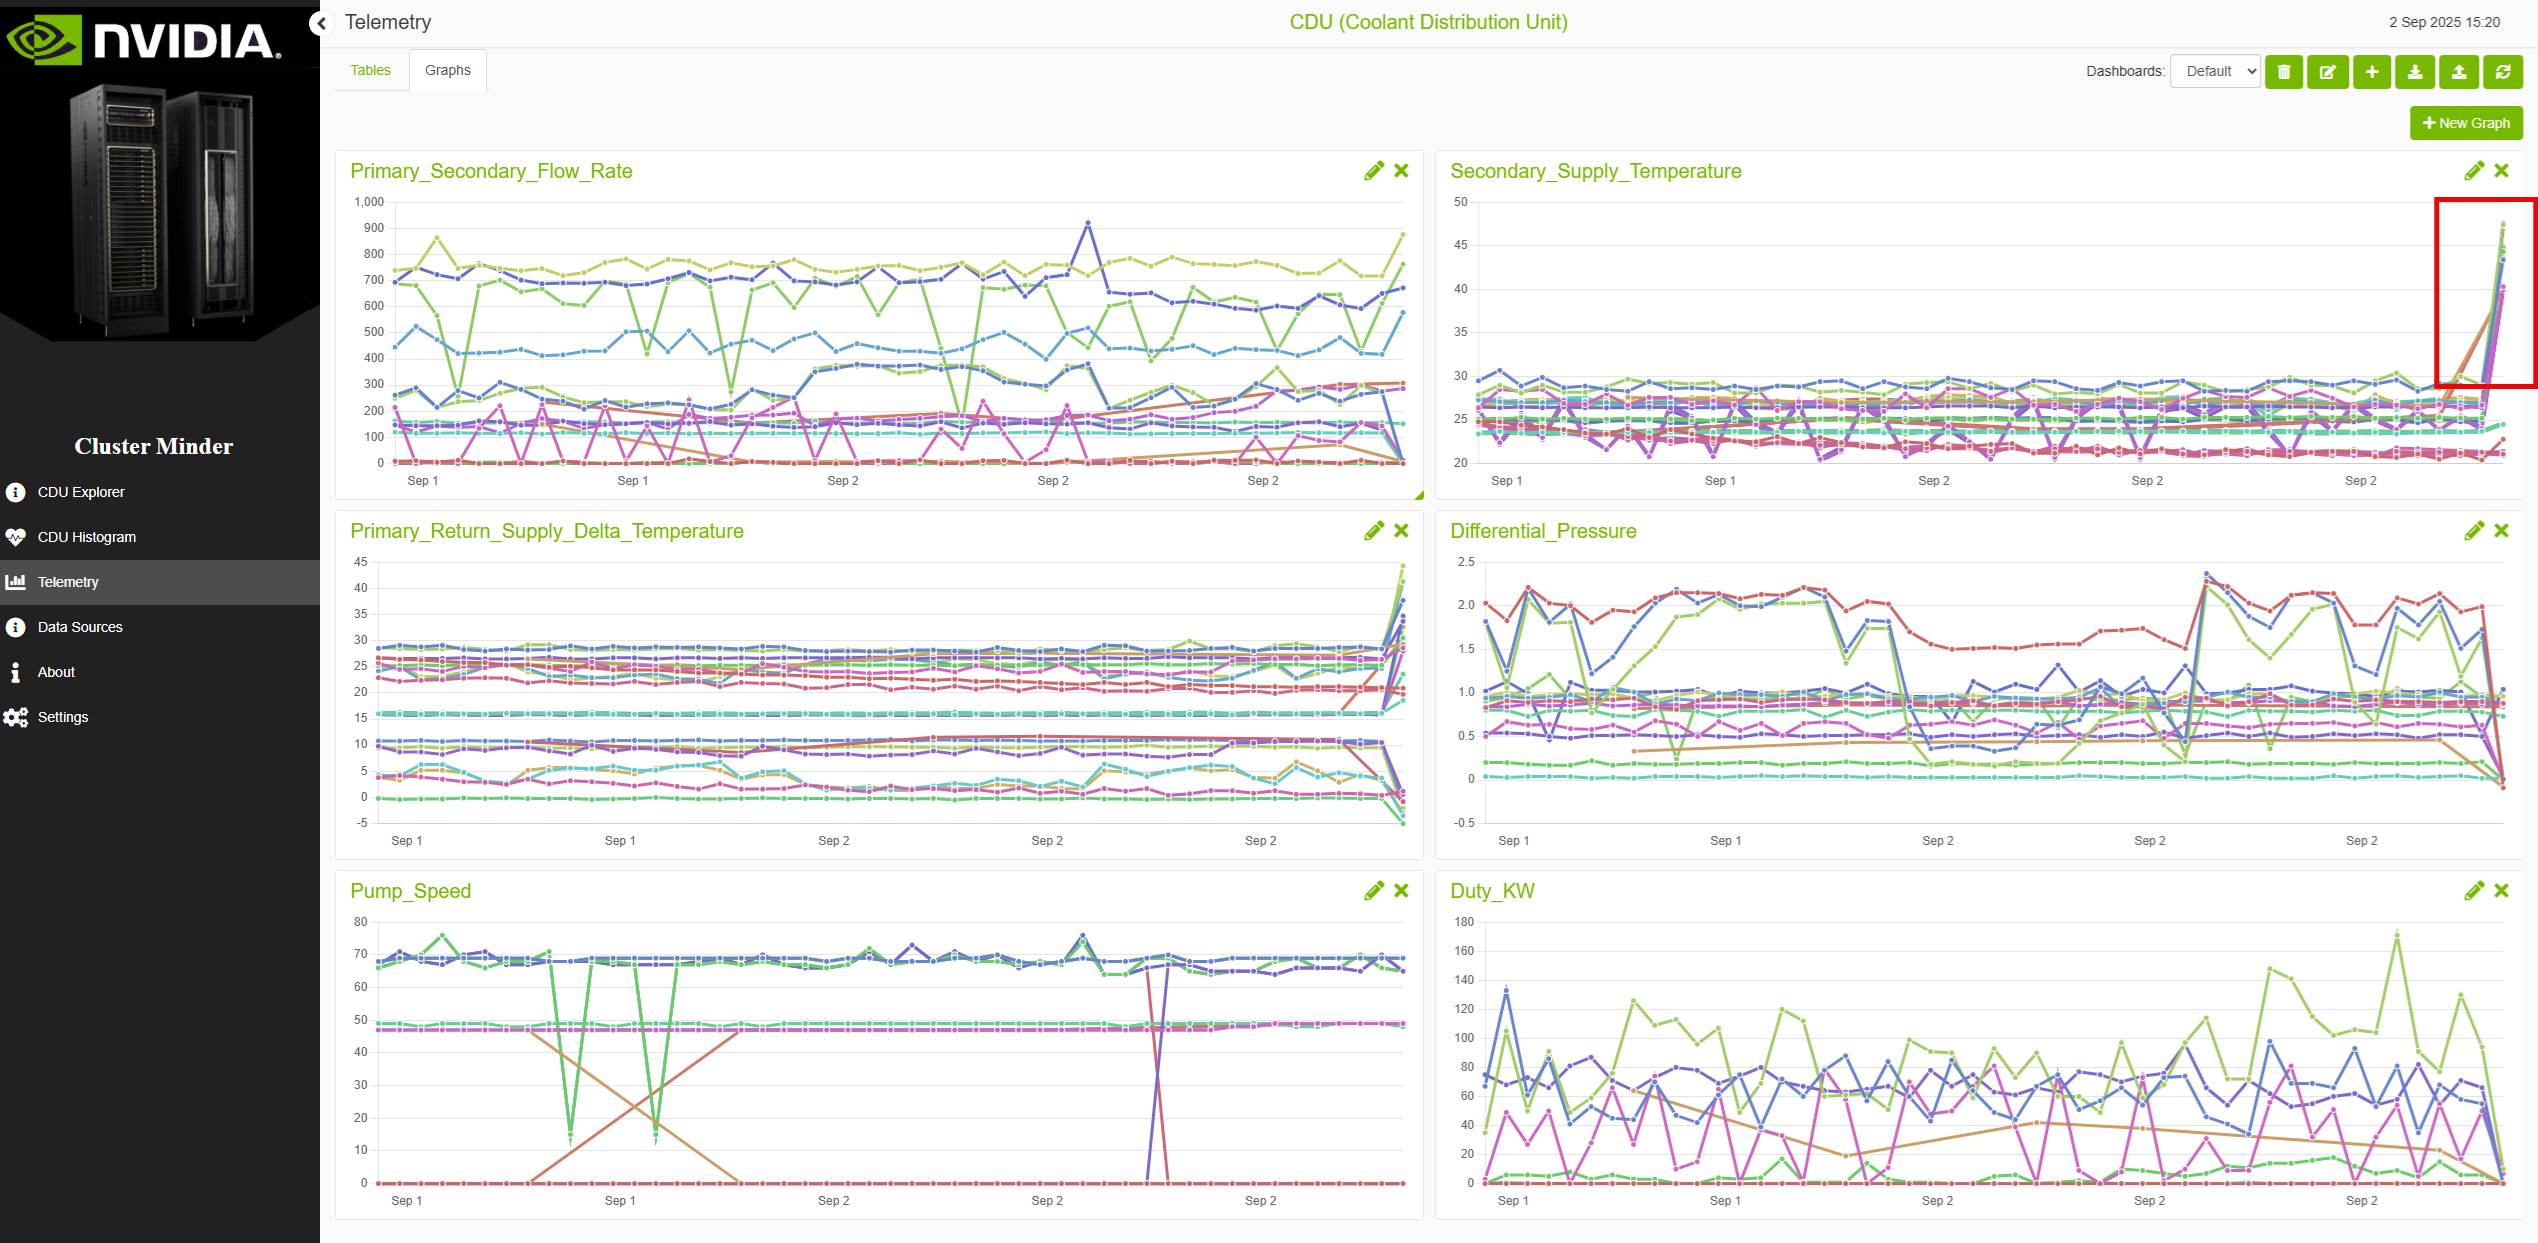
CDU Telemetry Example
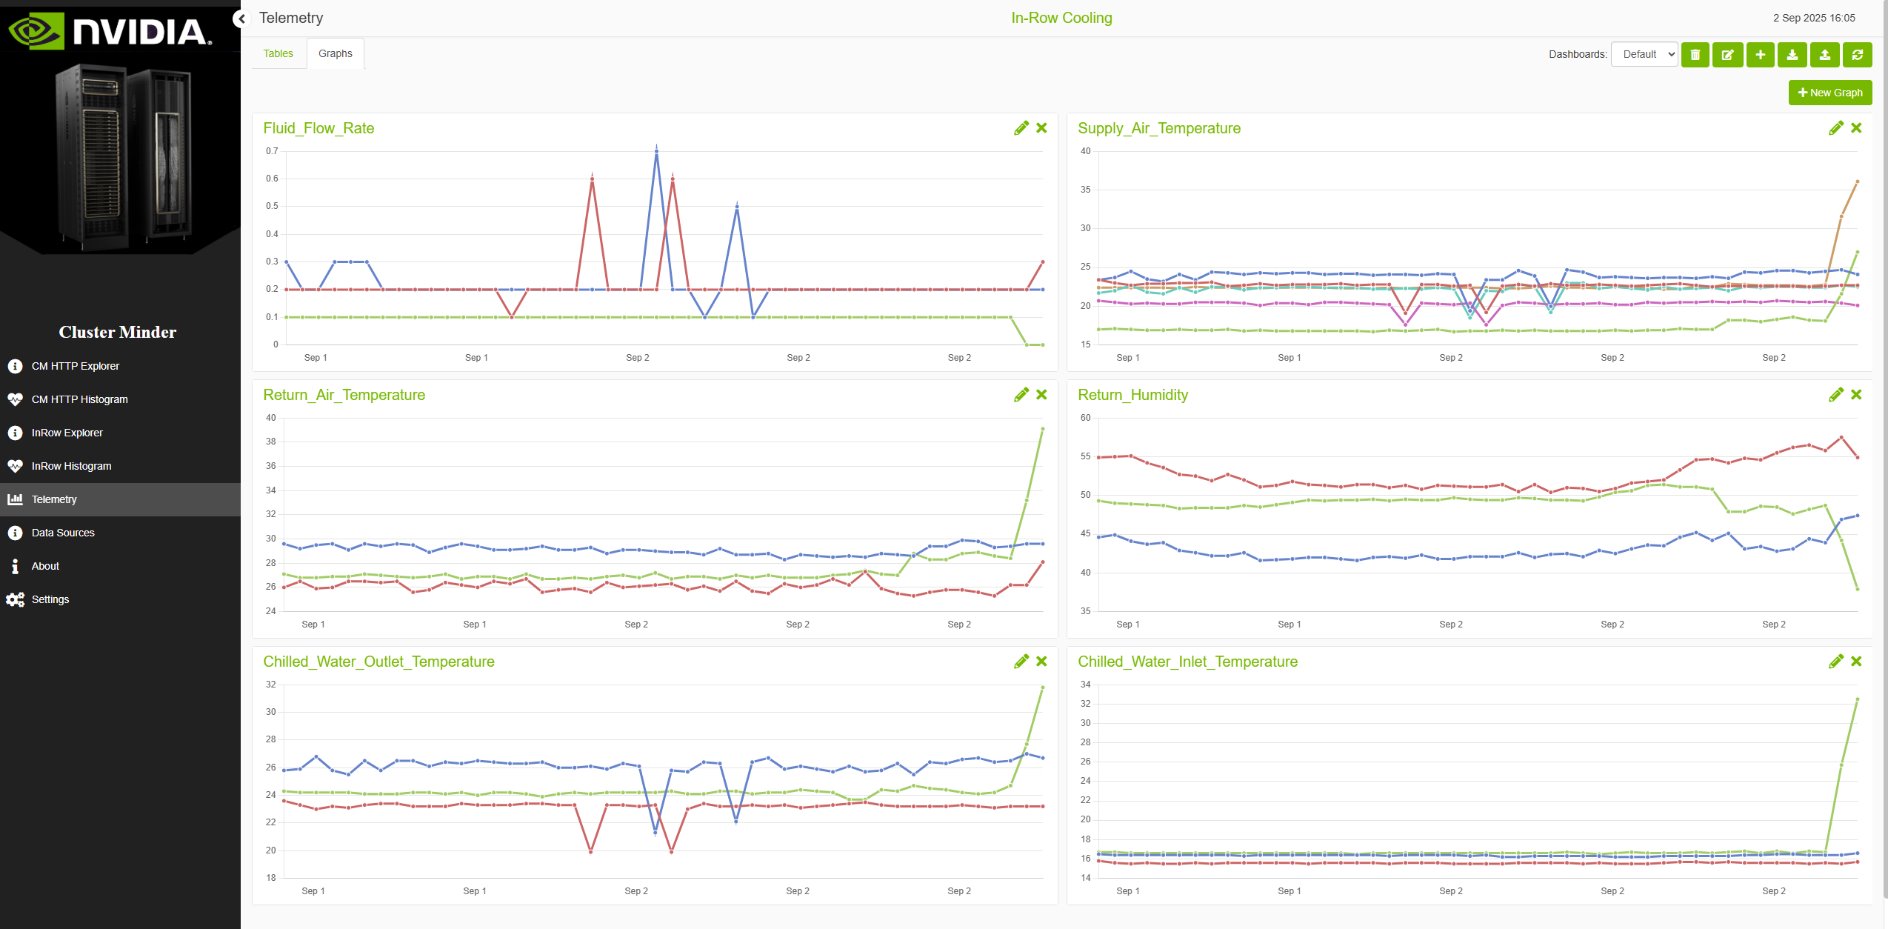
InRow Telemetry Example
Additional Features
Graphs Tab
To create a custom graph:
-
Navigate to the Graphs tab and click
-
Select a provider, device, and counter.
-
Name the graph and click Finish.
Graphs support time frame and resolution controls, and can be filtered by clicking a specific counter. Selecting a host on a graph highlights and isolates that host's data.
Dashboards
Dashboards enable users to collect and organize specific graphs they create, grouping related visualizations within a single dashboard for easier access and comparison. This allows users to save sets of graphs that serve a common purpose, and effortlessly switch between multiple dashboards to manage different groups of visualizations tailored to various needs.
Annotations
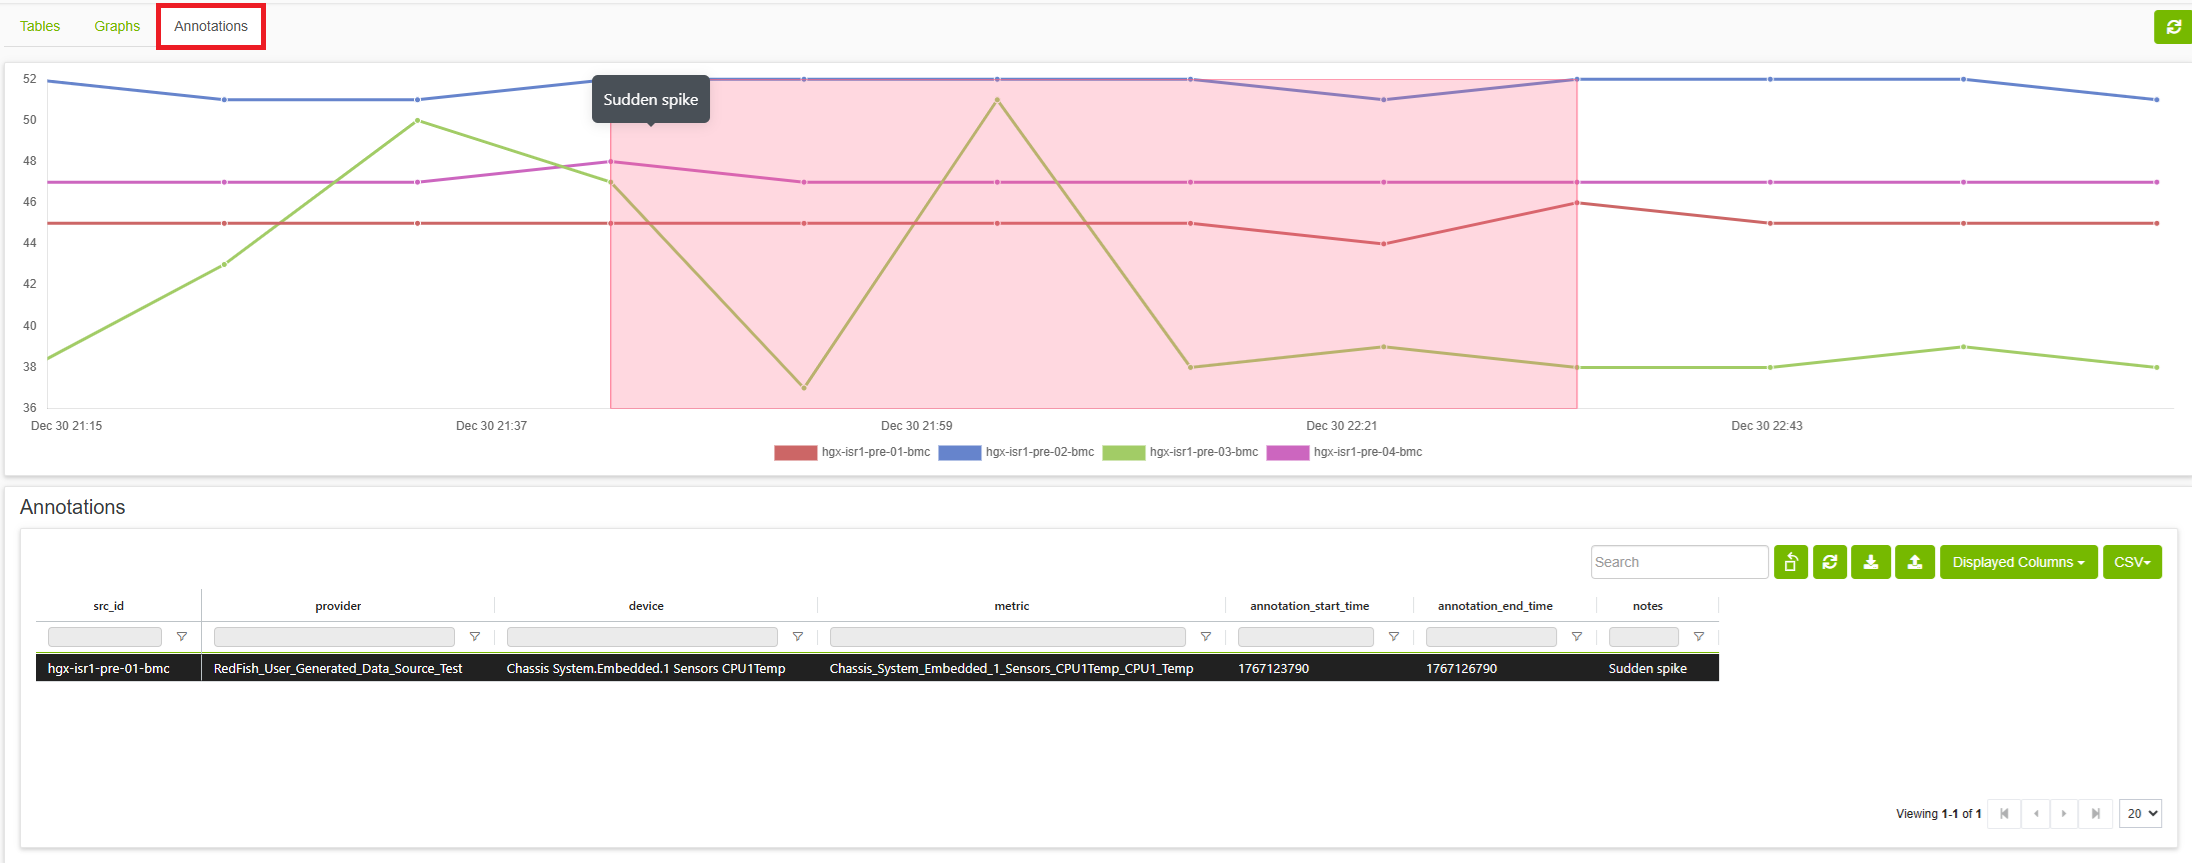
he Annotation tab allows users to mark and document specific time periods in telemetry data for devices and metrics. Annotations provide context for unusual patterns, incidents, maintenance windows, or other events of interest in the monitoring data.
Users can upload a JSON file containing an array of annotation objects, where each annotation requires src_id, device, provider, metric, annotation_start_time, annotation_end_time, and notes fields, with optional start_time, end_time, and query_resolution fields for customizing the displayed data range.
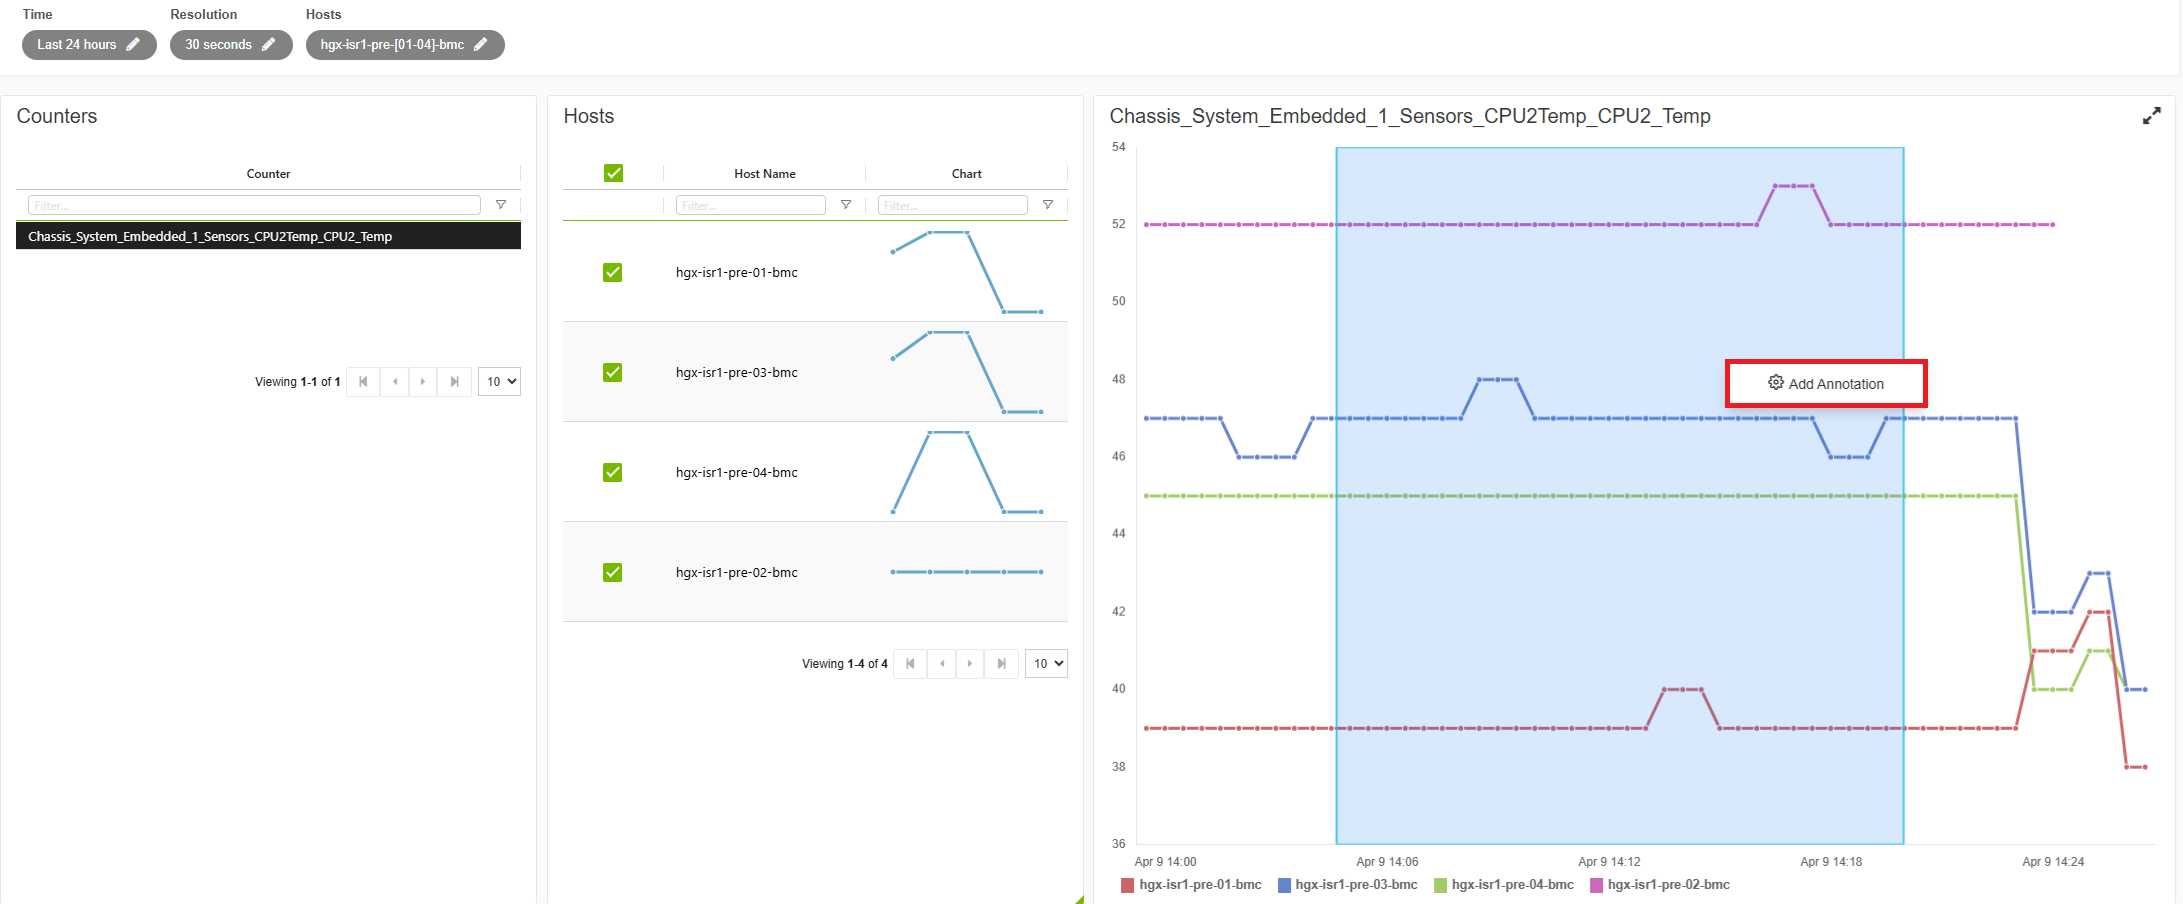
Users can also create annotations directly from a telemetry graph: hold Shift and drag on an existing graph to draw a time-range box. Right-click inside that box to add an annotation; the action uses the selected start and end time, query resolution, and hosts for the new annotation.
Icons
|
Icon |
Description |
|---|---|
|
|
Enables (from left to right) viewing the current dashboard, deleting a dashboard, renaming a dashboard, adding a dashboard, downloading a dashboard, uploading a dashboard, and refreshing data. |
|
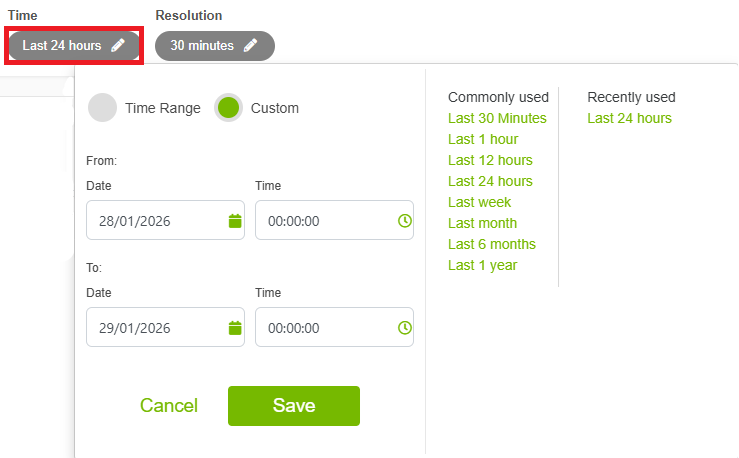
Enables selecting a specific time range (or a custom one) and the resolution for the telemetry graph.
|
|
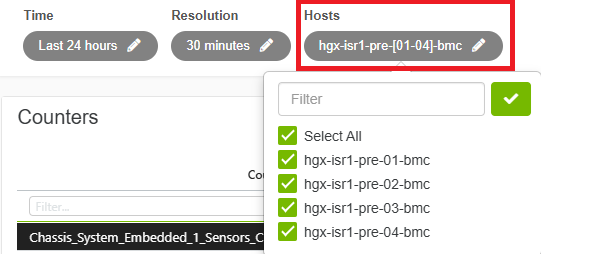
Enables selecting specific hosts for the telemetry graph.
|

Last updated: