This section describes the DPL Debugger Tools, used to debug pipeline packets that DPL programs are processing in NVIDIA® BlueField®.
The debugger works only with DPL programs that are compiled with -g flag.
Introduction
The DPL Debugger is a GUI application that can run a debug session or open a pre-recorded (through dpl_nspect debug) debug session file.
Debug session shows the flow of network packets throughout a DPL program's pipeline and lets the developer trace the details of each packet's course. See the documentation on the extern function nv_send_debug_pkt.
Running dpl_debugger.sh with no additional arguments will open the GUI application.
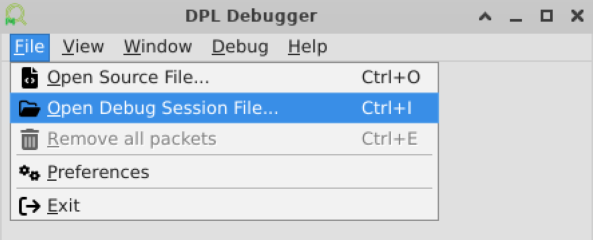
Opening Pre-recorded Debug Session File
The pre-recorded debug session file is a tar.gz archive and is the output of a recorded debug session created with the dpl_nspect debug command.
Option 1: Specify the file to open when running the debugger from the command line.
dpl_debugger.sh hello_packet.tar.gz
Option 2: Click File → Open Debug Session File and select your file.
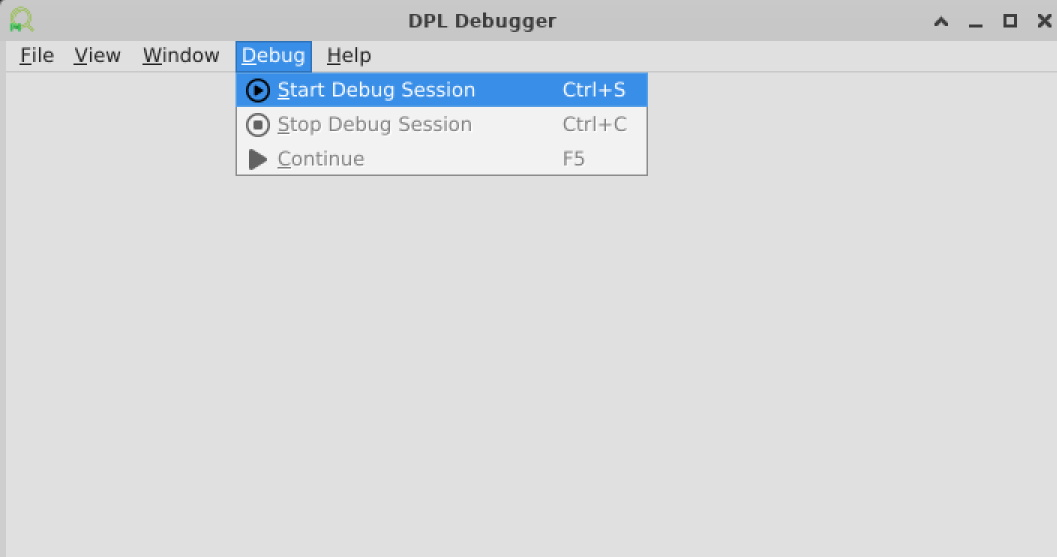
Starting Debug Session
Running a debug session from the debugger is possible and has the advantage of processing and inspecting the packets at runtime.
Click Debug → Open Debug Session File and select your file.
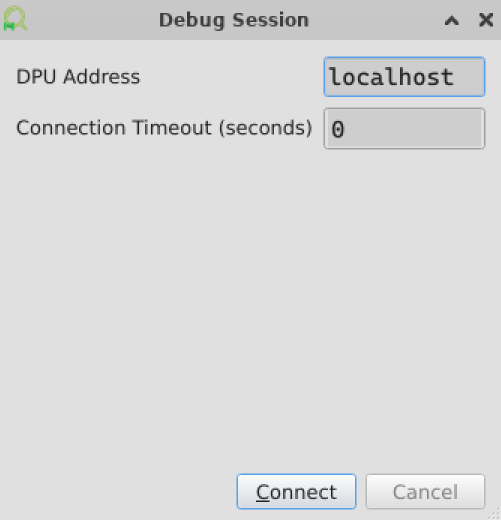
Set the DPU address and port (the default port is 9560), and the connection timeout if required (0 = no timeout), and click Connect.
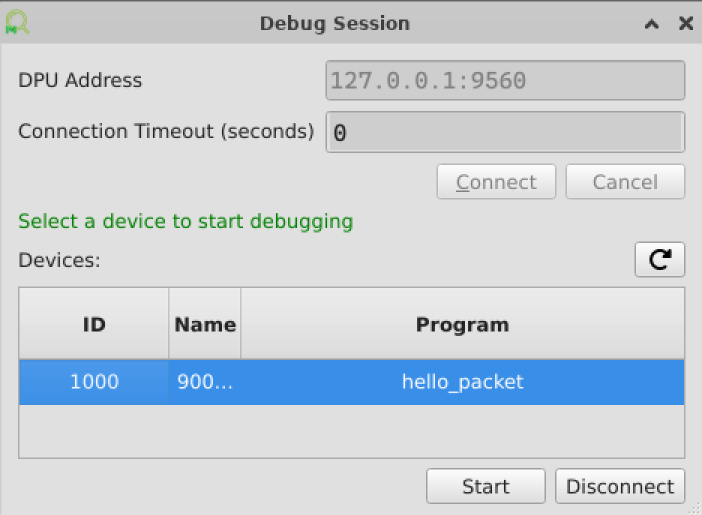
Select the desired device to debug and click Start
Enabling Debug Points
After a debug session is started from the debugger GUI application, all the debug points (i.e., calls to nv_send_debug_pkt) in the program are DISABLED by default and don't affect the pipeline of the packet. When a packet hits an enabled debug point, it is sent to the debugger, displayed, and can be injected back to the same point in the pipeline on user demand.
Enabling and disabling debug points is done the same as in traditional debugger GUI applications - open the source file of the program and click on the left margin next to a line with a call to nv_send_debug_pkt.
Debugging the Program Pipeline
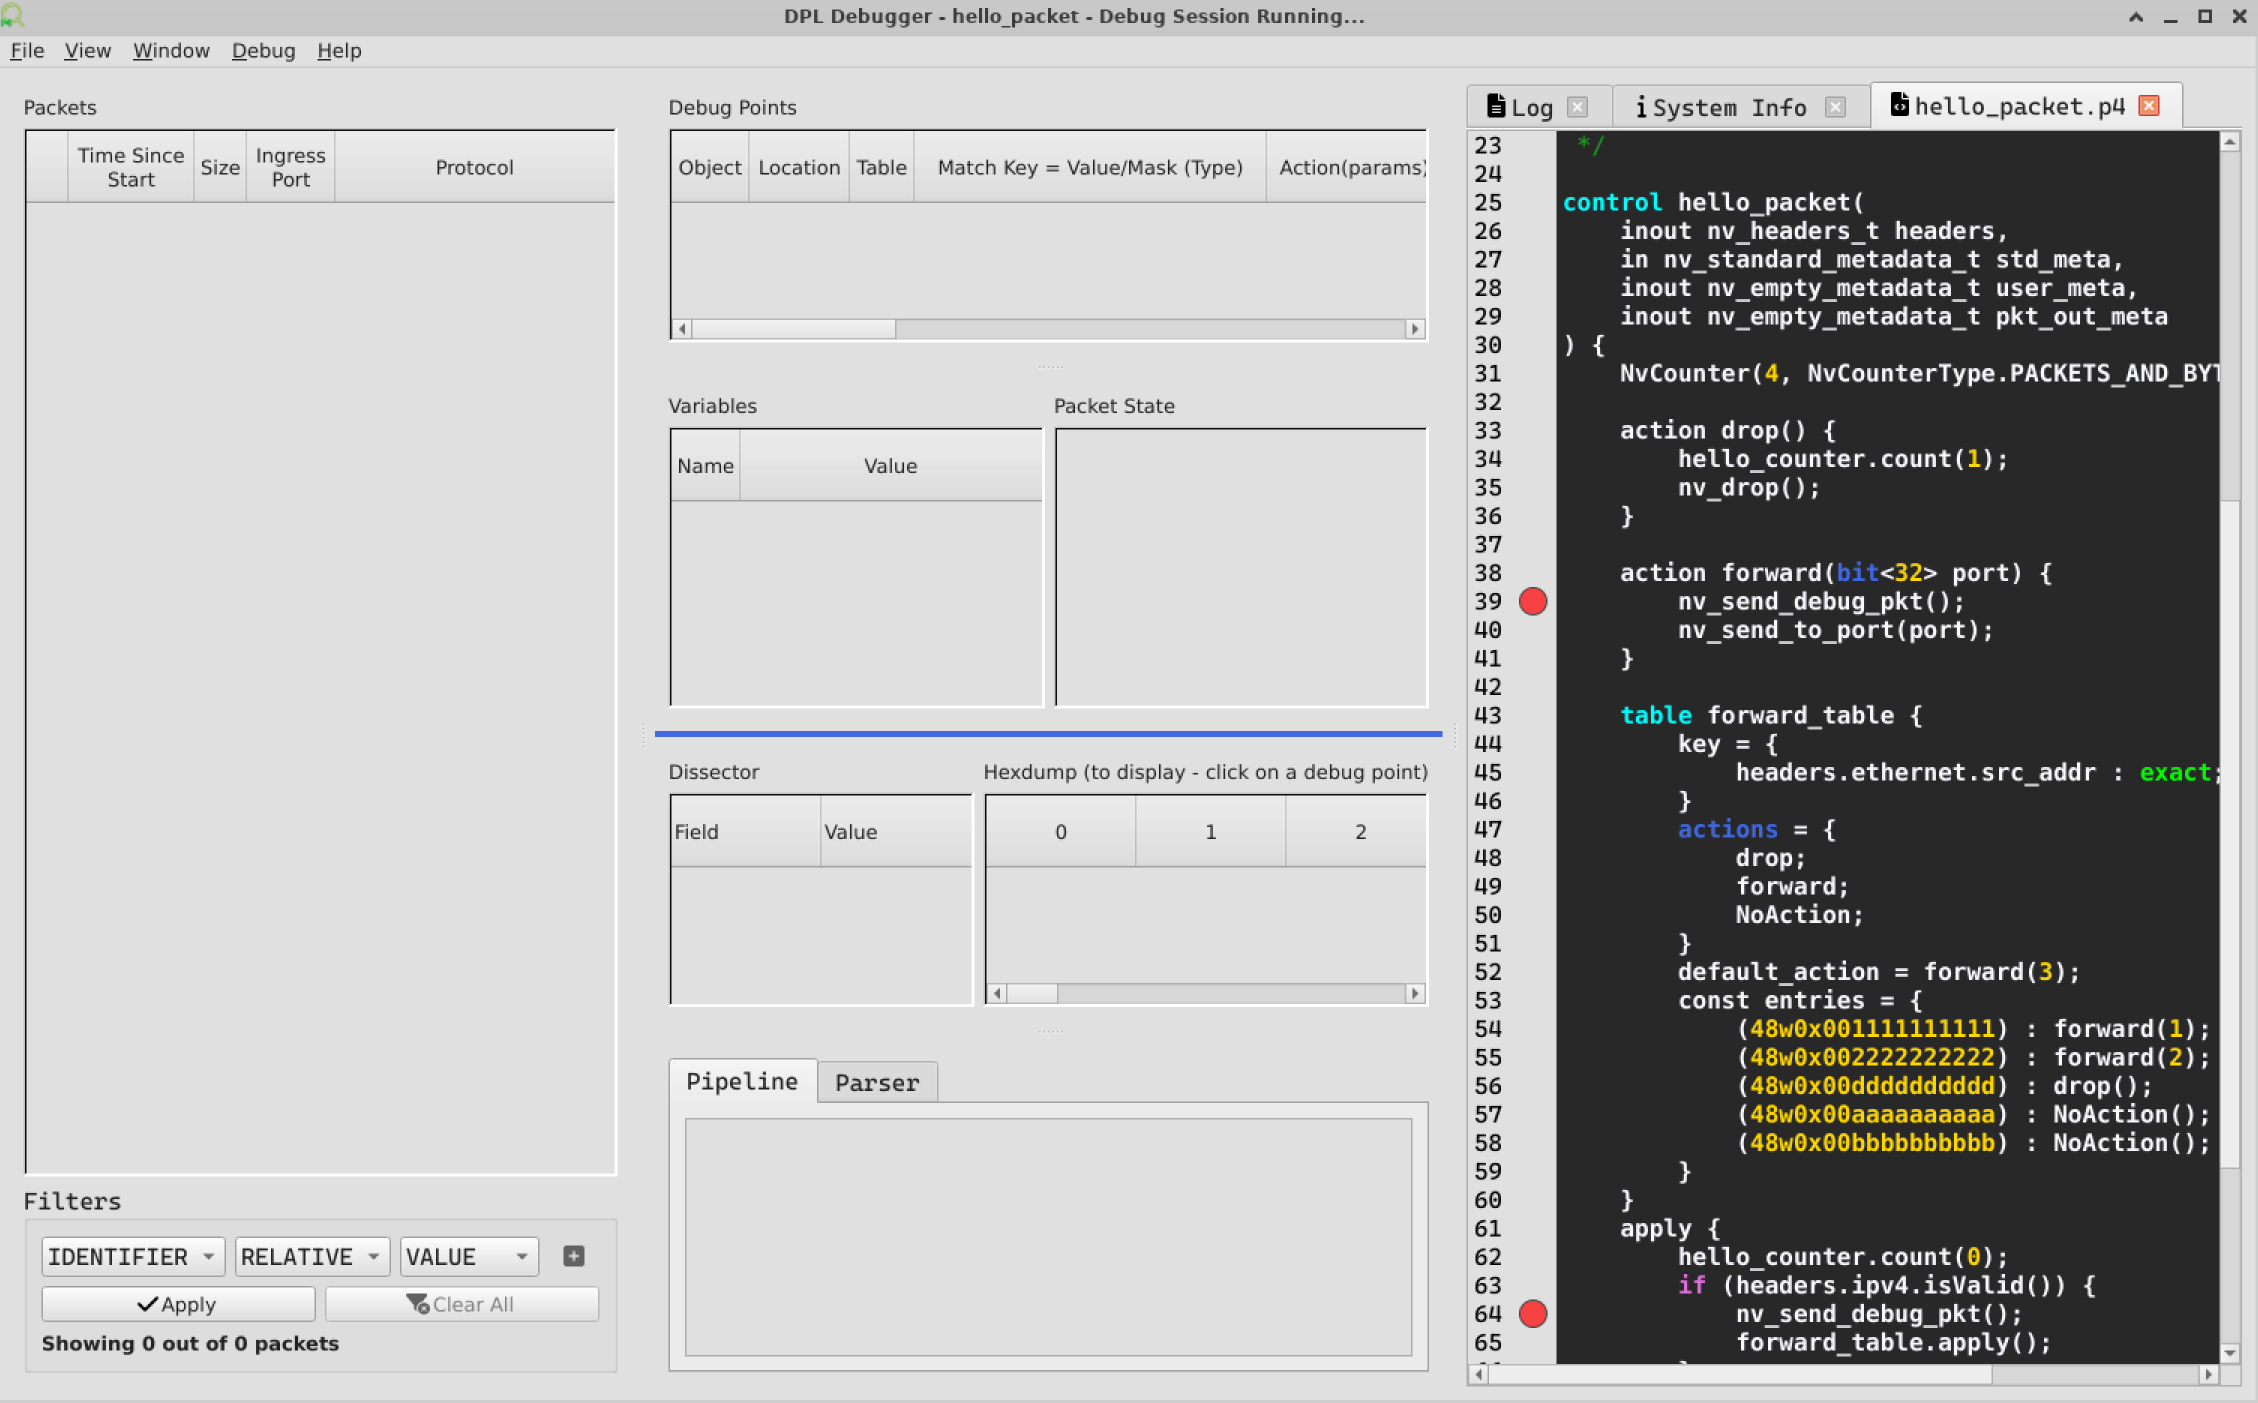
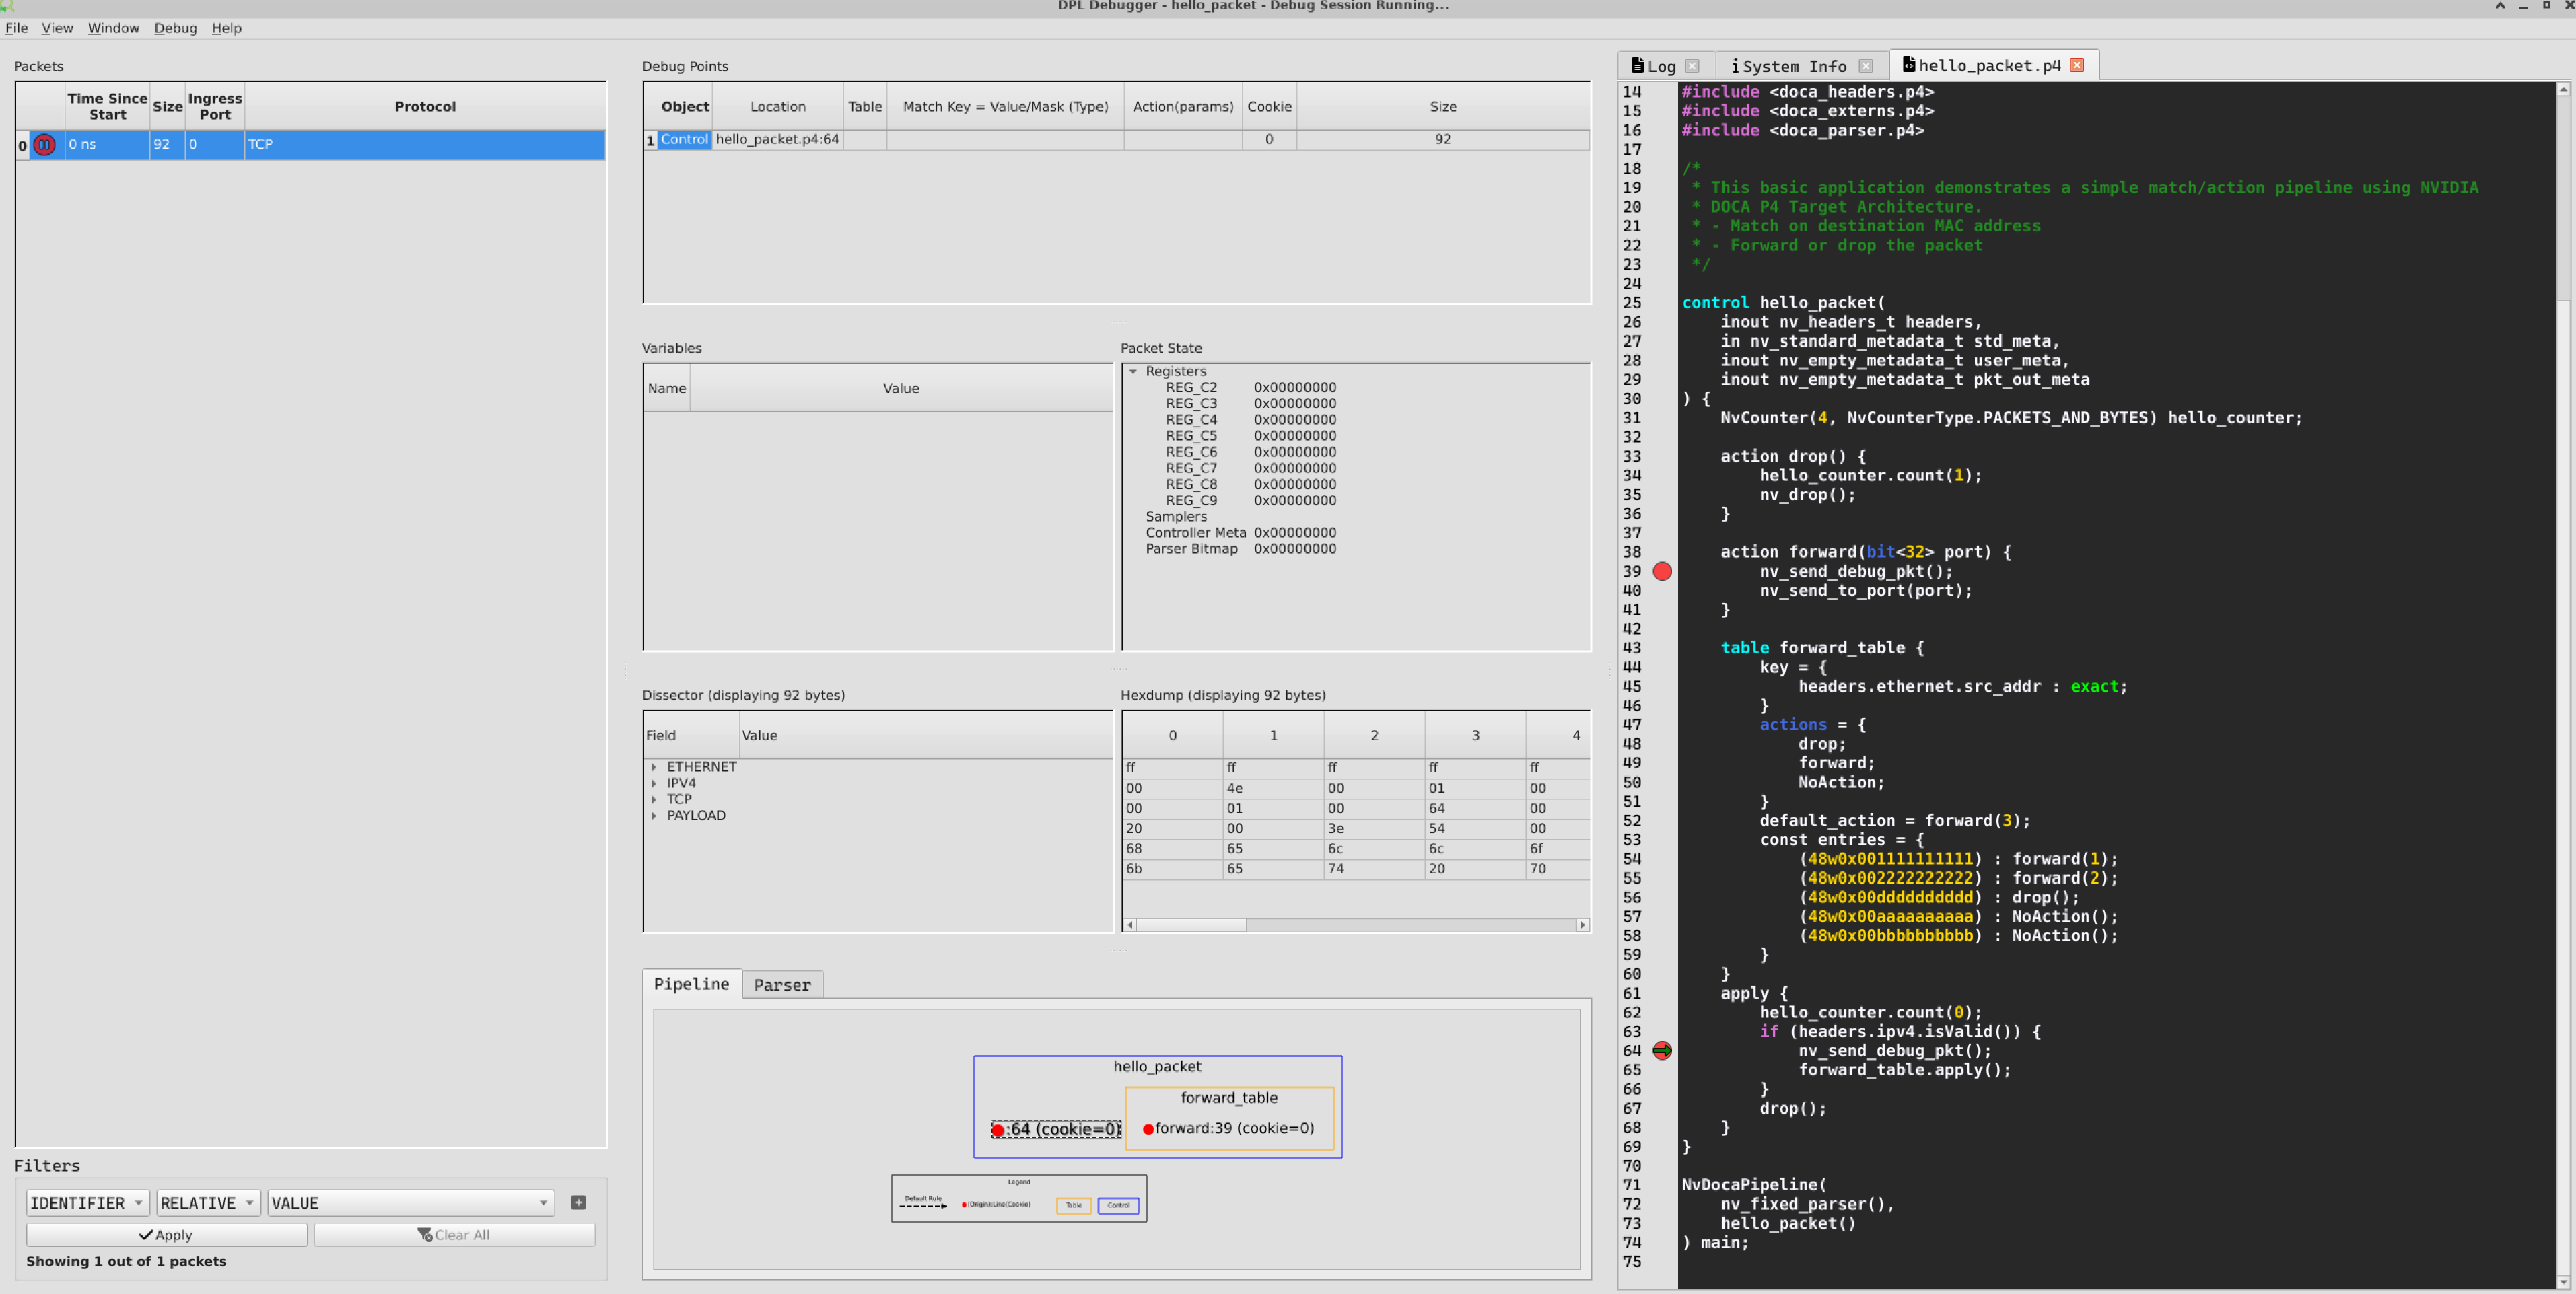
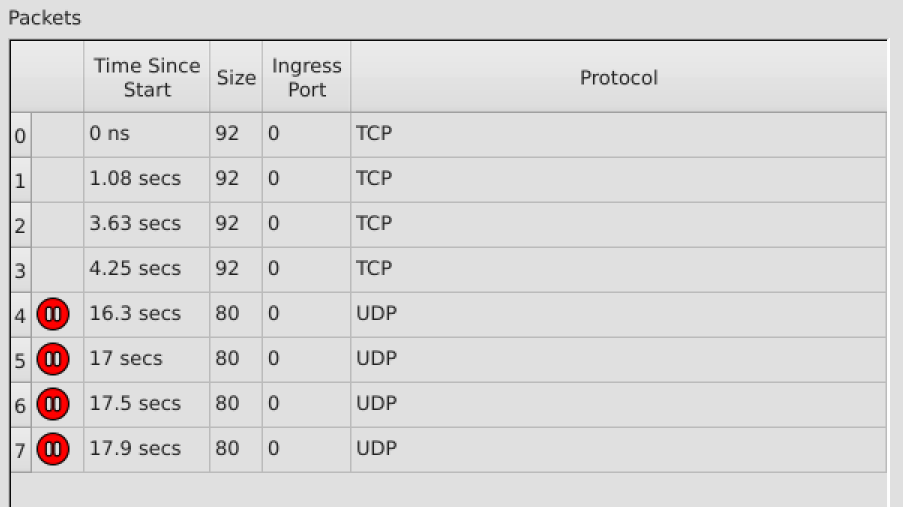
When a packet hits an enabled debug point, it is sent to the debugger and displayed. A red icon is shown to indicate that the packet is paused by the debugger. Clicking the packet reveals the packet data, state, and pipeline. A green arrow is shown to indicate the current debug-point the packet is paused on.
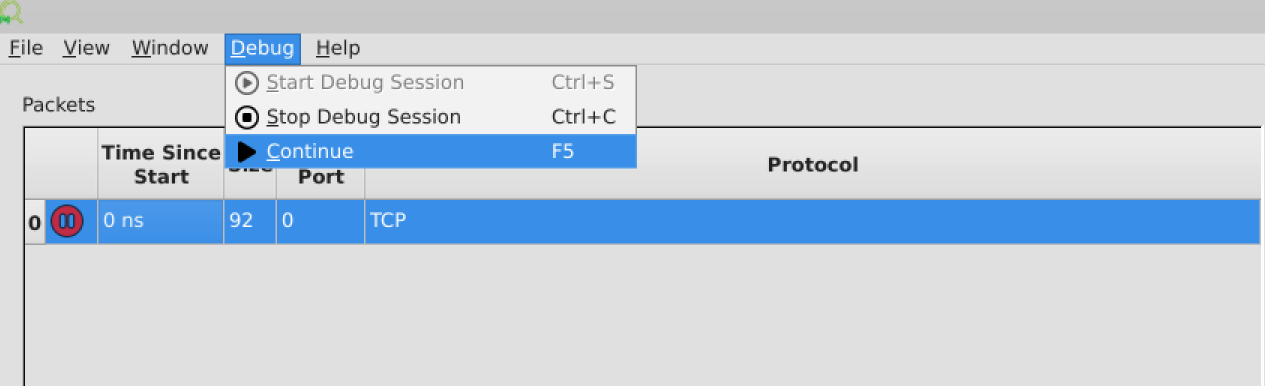
To inject the packet back to the same point at the pipeline, click Debug → Continue.
Note that there could be multiple paused packets. This operation continues all currently paused packets.
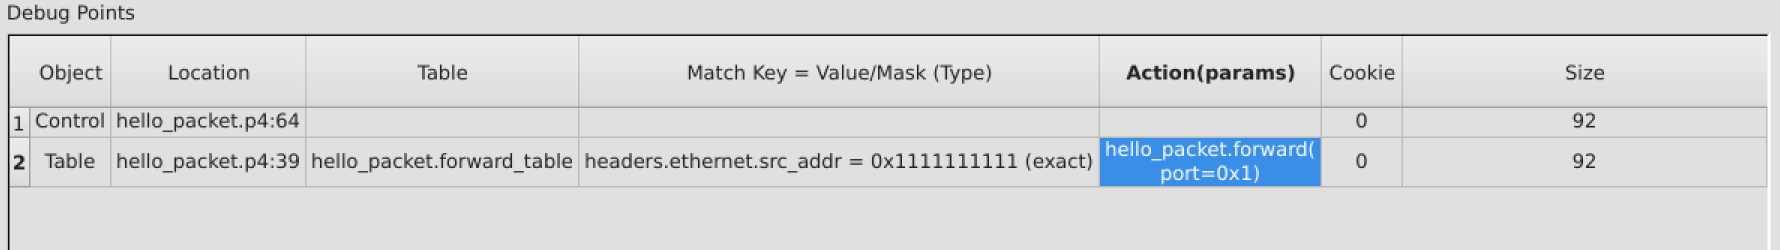
In this example, the packet hits an additional breakpoint, and a new row in the "Debug Points" widget is displayed.
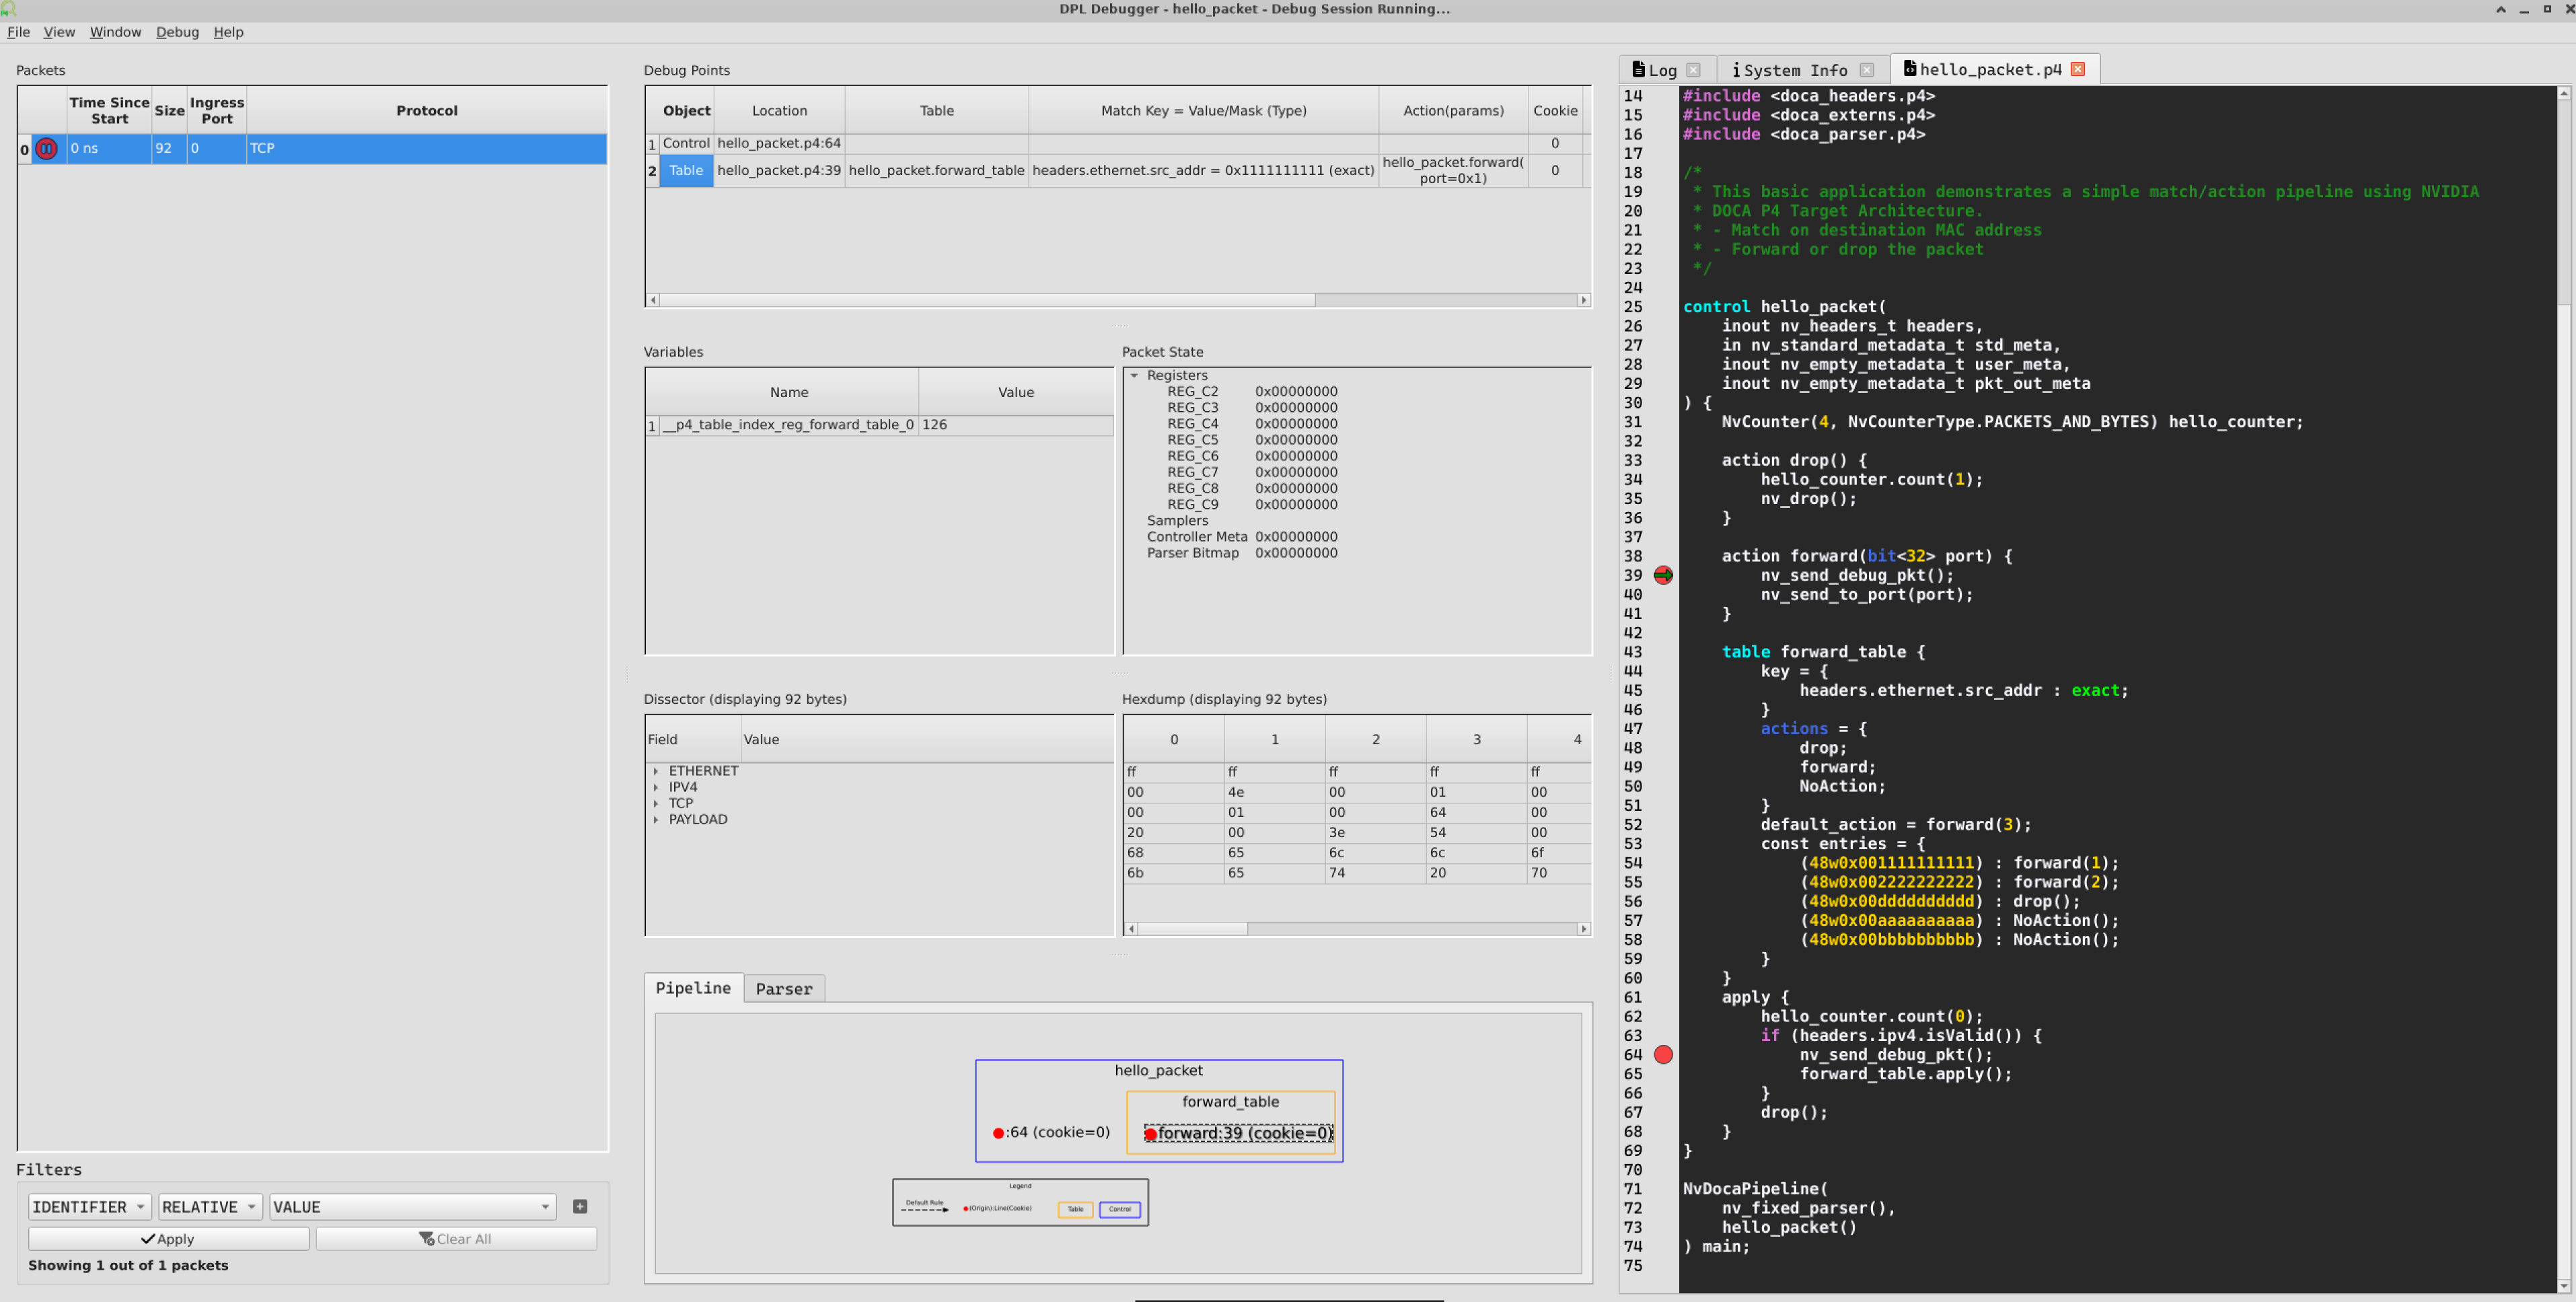
Continuing the packet once again causes the "Pause" icon to disappear, as there are no more debug points in the rest of the packet's pipeline.
Widgets
Packet List
Displays the packets that were sent to the debugger. Selecting a packet in the list reveals the debug-points visited by the packet.
The list can be cleared by clicking File → Remove all packets.
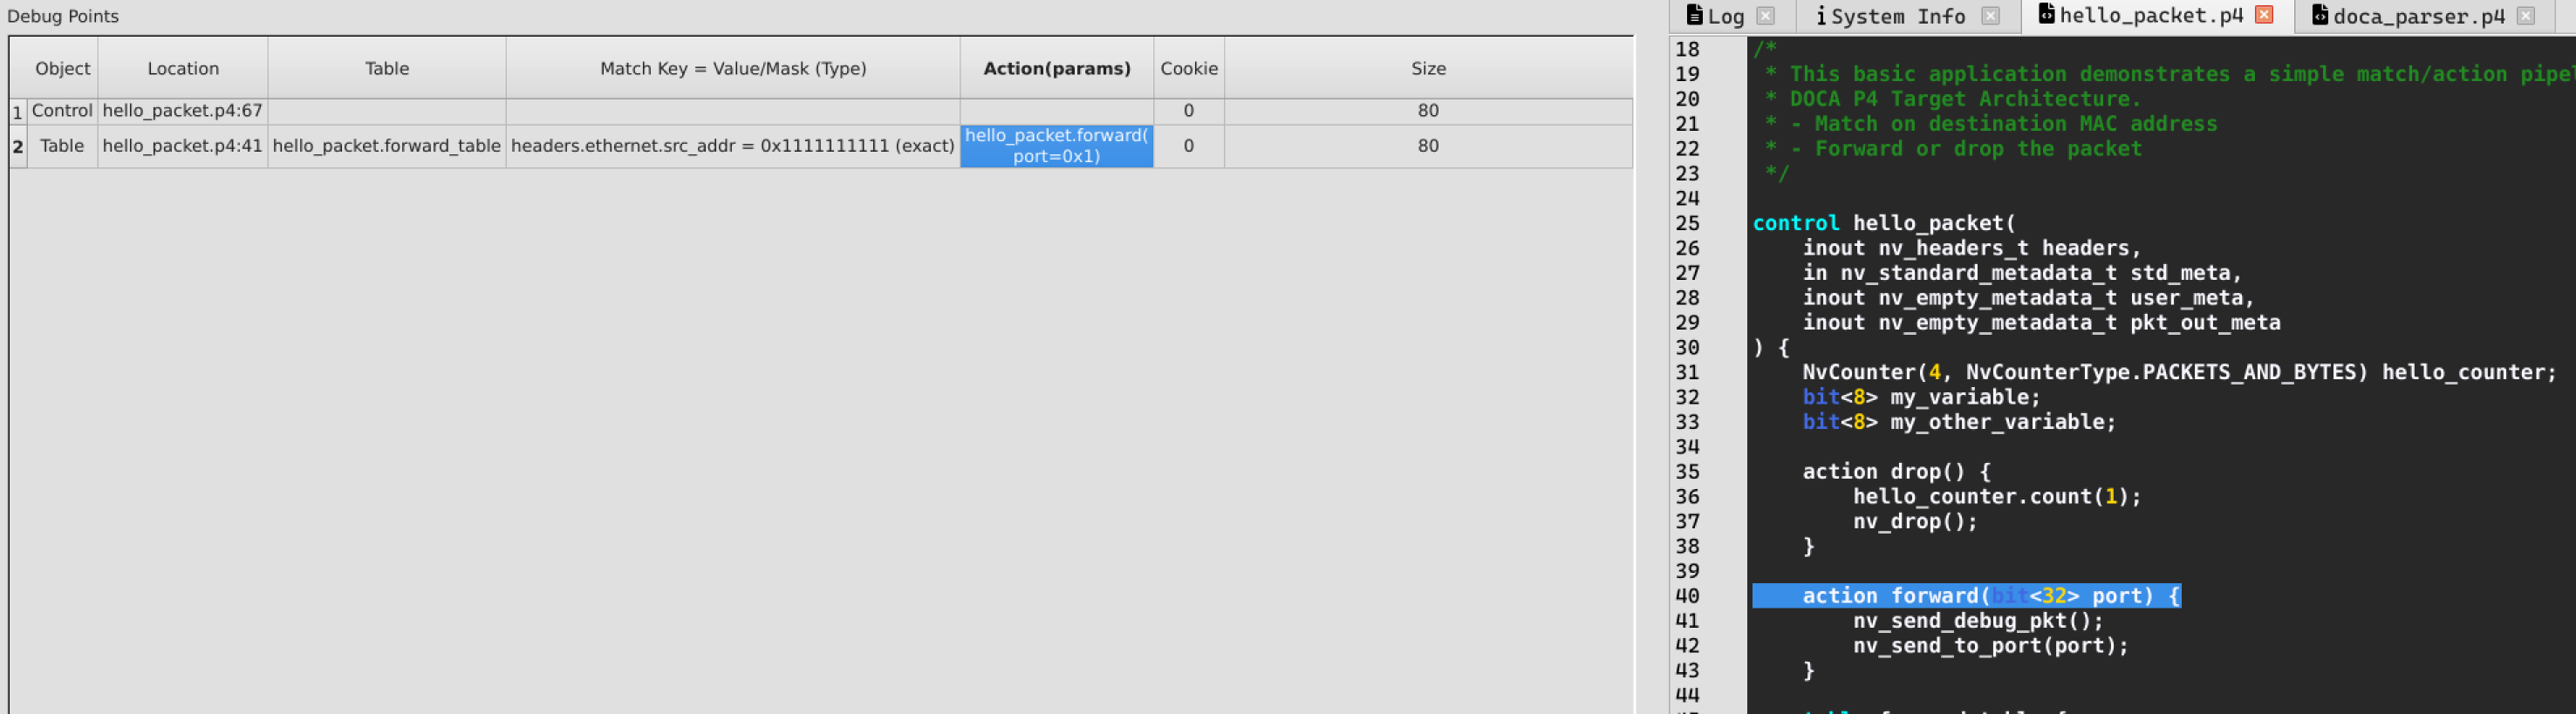
Debug Points
Each row represents a single debug point hit. Selecting a debug point reveals the packet data, state, and pipeline at the time the packet hit the debug point.
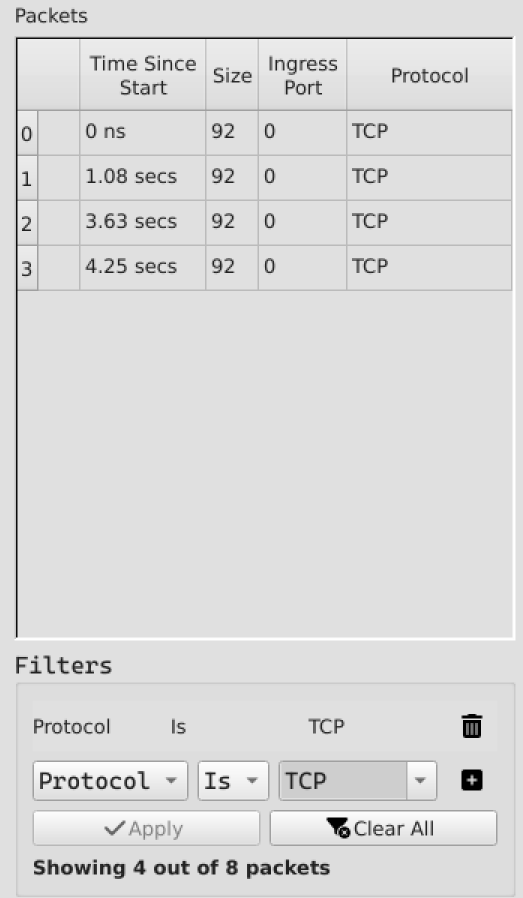
Filter
Packets can be filtered by:
-
Table name
-
Action
-
Match Type
-
Match Value
-
Ingress port
-
Packet Size
-
Protocol
Click the '+' button to add a filter, and the Apply button to apply the filters.
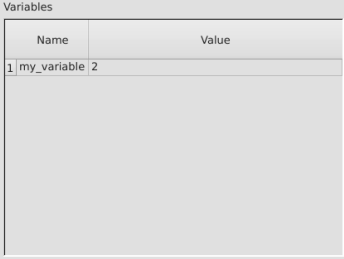
Variables
Shows the variables defined in the program, and their respective values at the time the selected debug-point was hit.
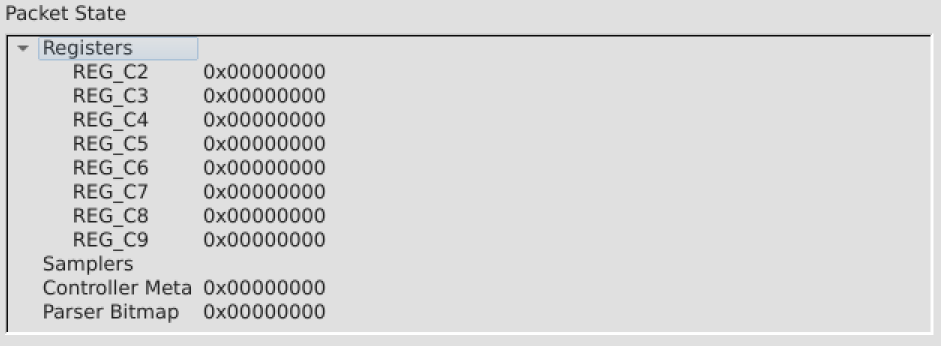
Packet State
Shows low level variables such as registers and controller meta.
For this version, Samplers and Parser Bitmap are not supported (always zero)
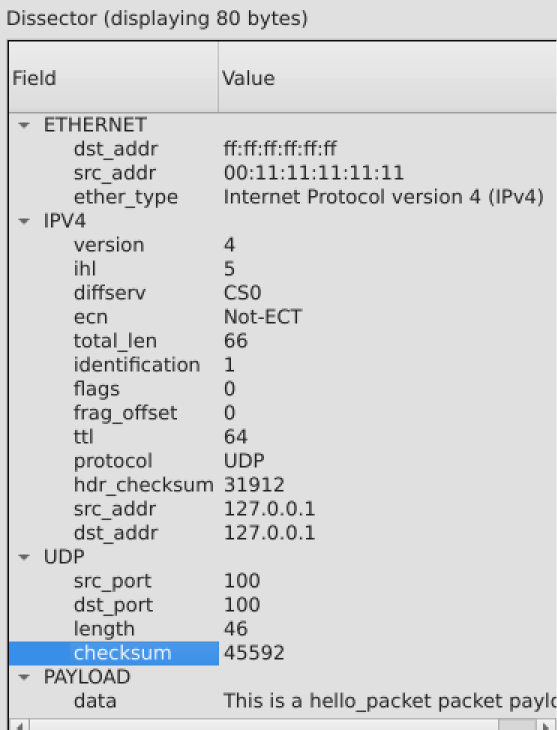
Packet Dissector
Shows the parsed packet.
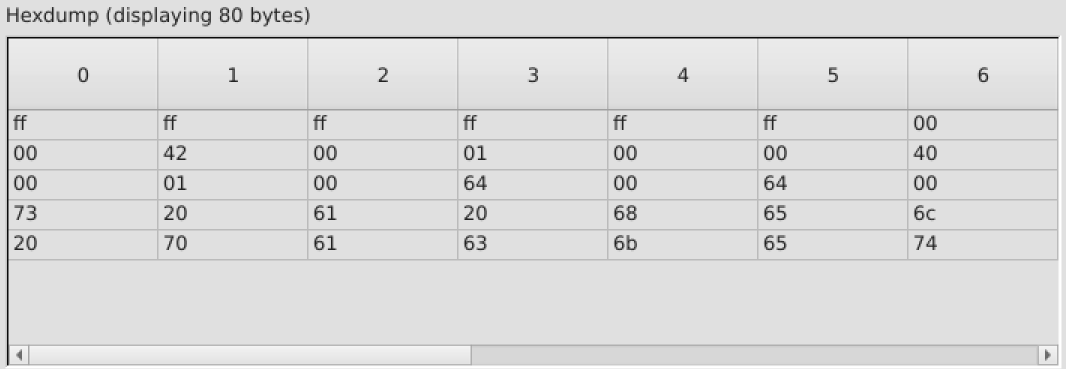
Hex Dump
Shows a raw hex dump of the packet.
Source Code
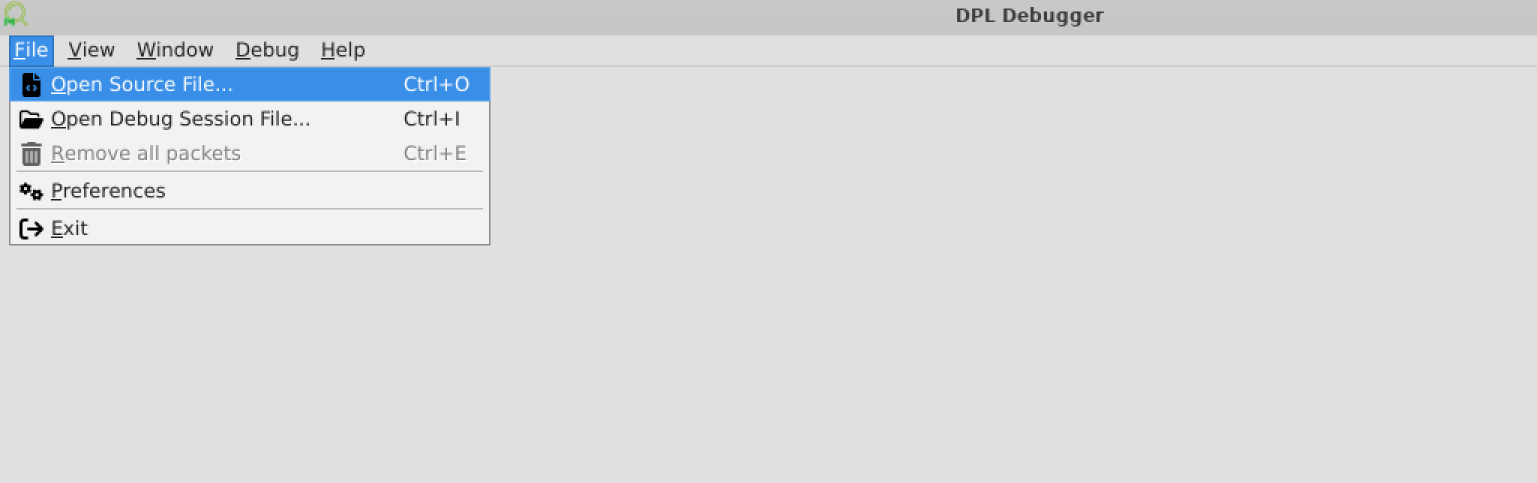
Source files can be opened by clicking File → Open Source File. Additionally, sources are displayed when clicking objects that have a correlation to a source location (e.g., debug points, tables, actions, etc...).
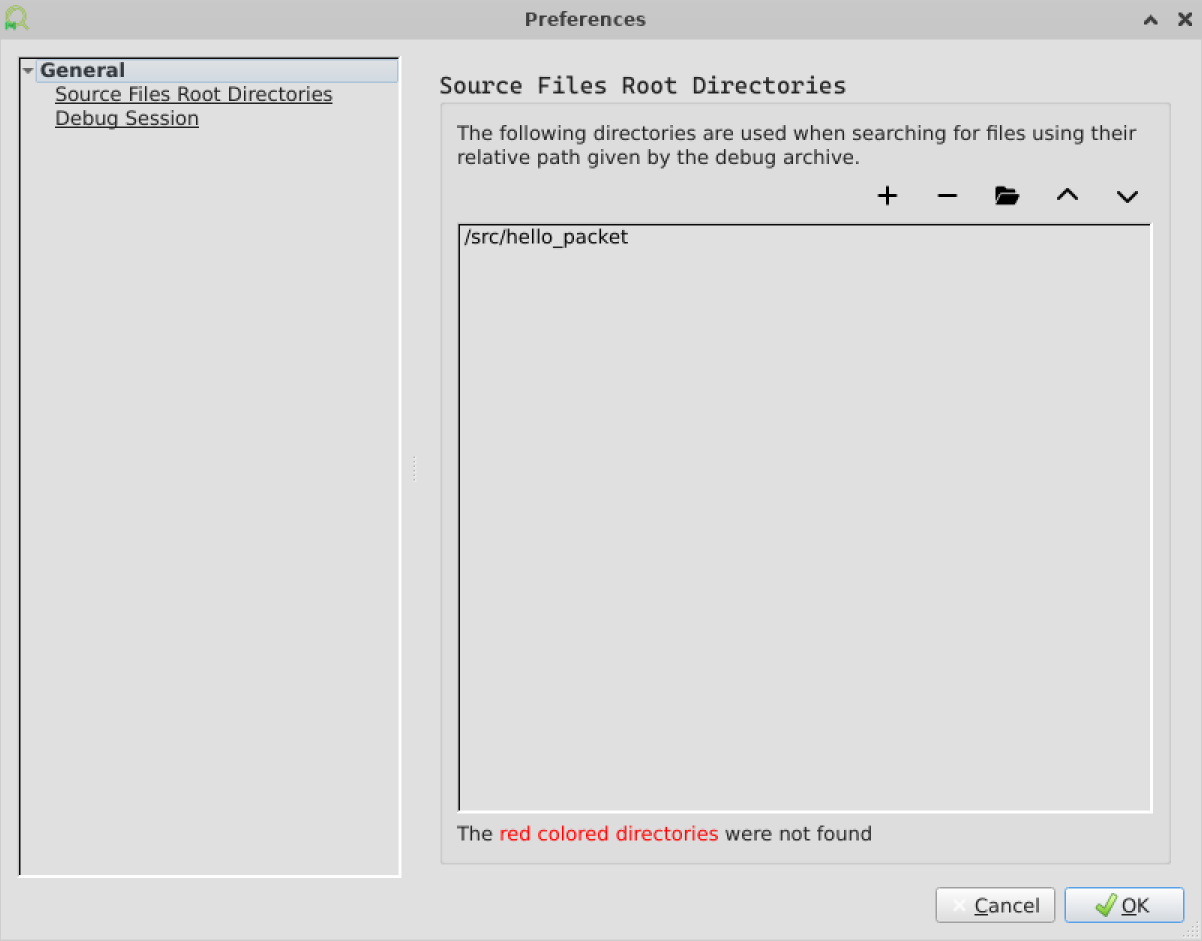
The debugger seeks the DPL source file using the search paths defined in the Settings, or by browsing manually for the file.
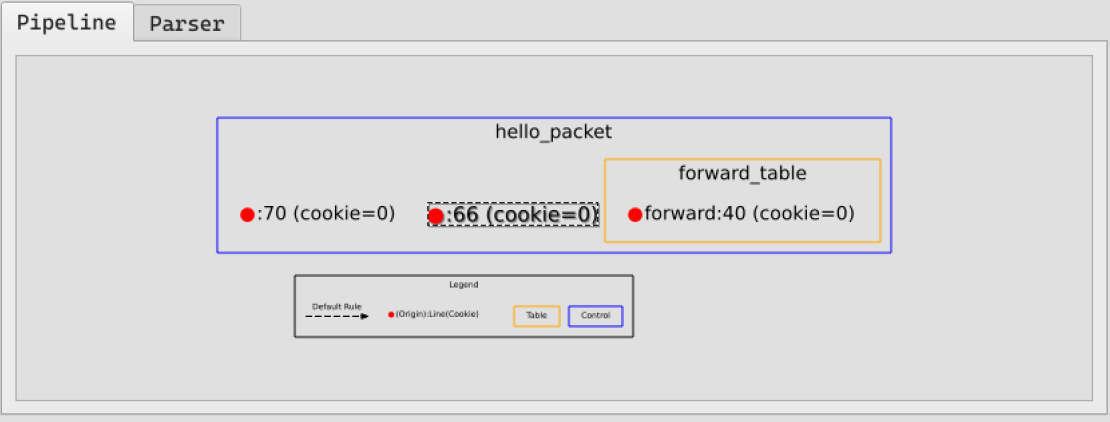
Pipeline
Shows the pipeline of the packet and the selected debug-point.
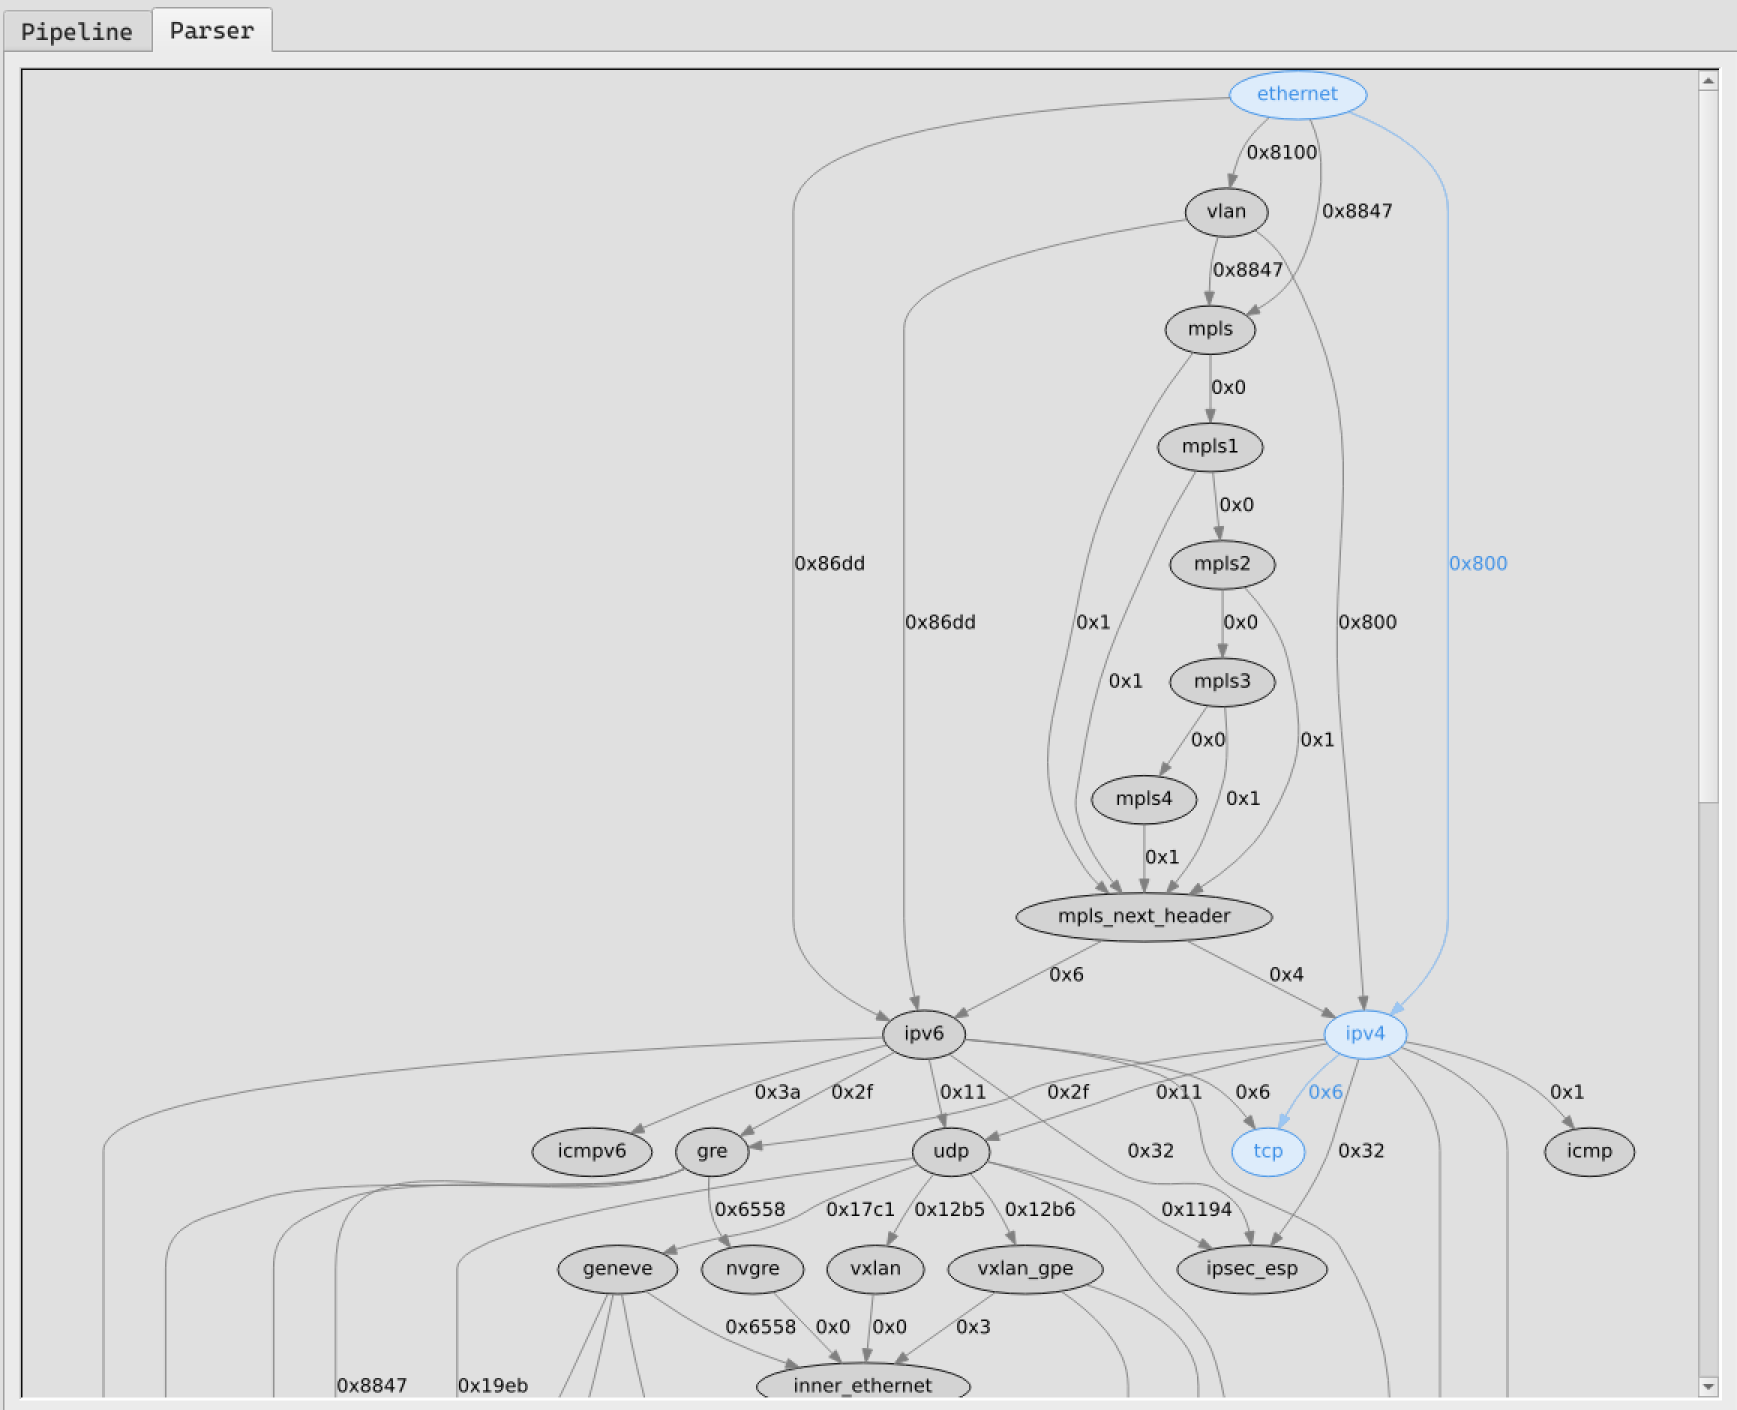
Parser
Shows the complete parser graph of the program, and outlines how the selected packet is parsed. The graph consists of both flex nodes which the DPL programmer instigated and static (fixed) nodes which are inherent part of the hardware.
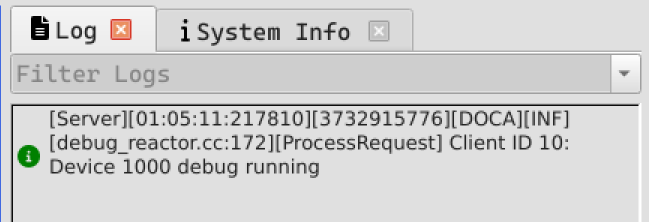
Log
Shows the internal logs of the DPL Runtime daemon. The logs can be filtered by severity levels.
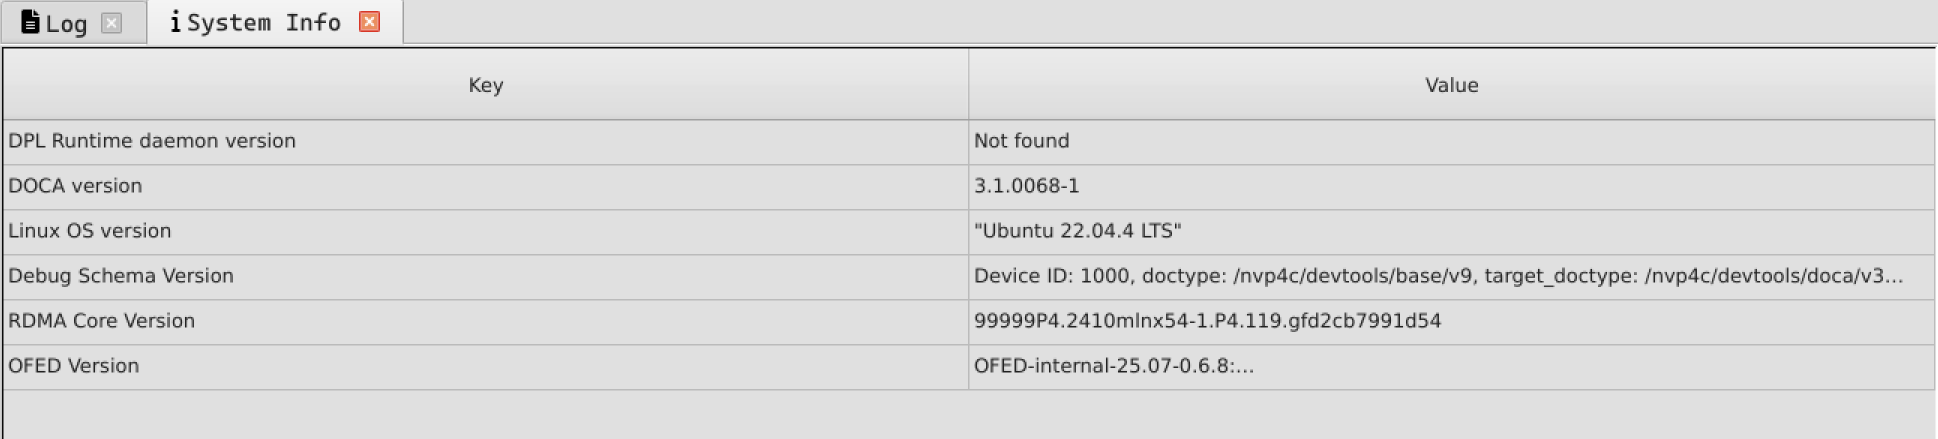
System Info
Setting Source Directories
When an object with a correlation to a source location is clicked, the debugger searches in the source directories for the source file and display it.
Click File → Preferences menu and set the location of the DPL program sources.
Last updated: