

This page provides installation, configuration, and usage instructions for the DOCA Argus service.
Introduction
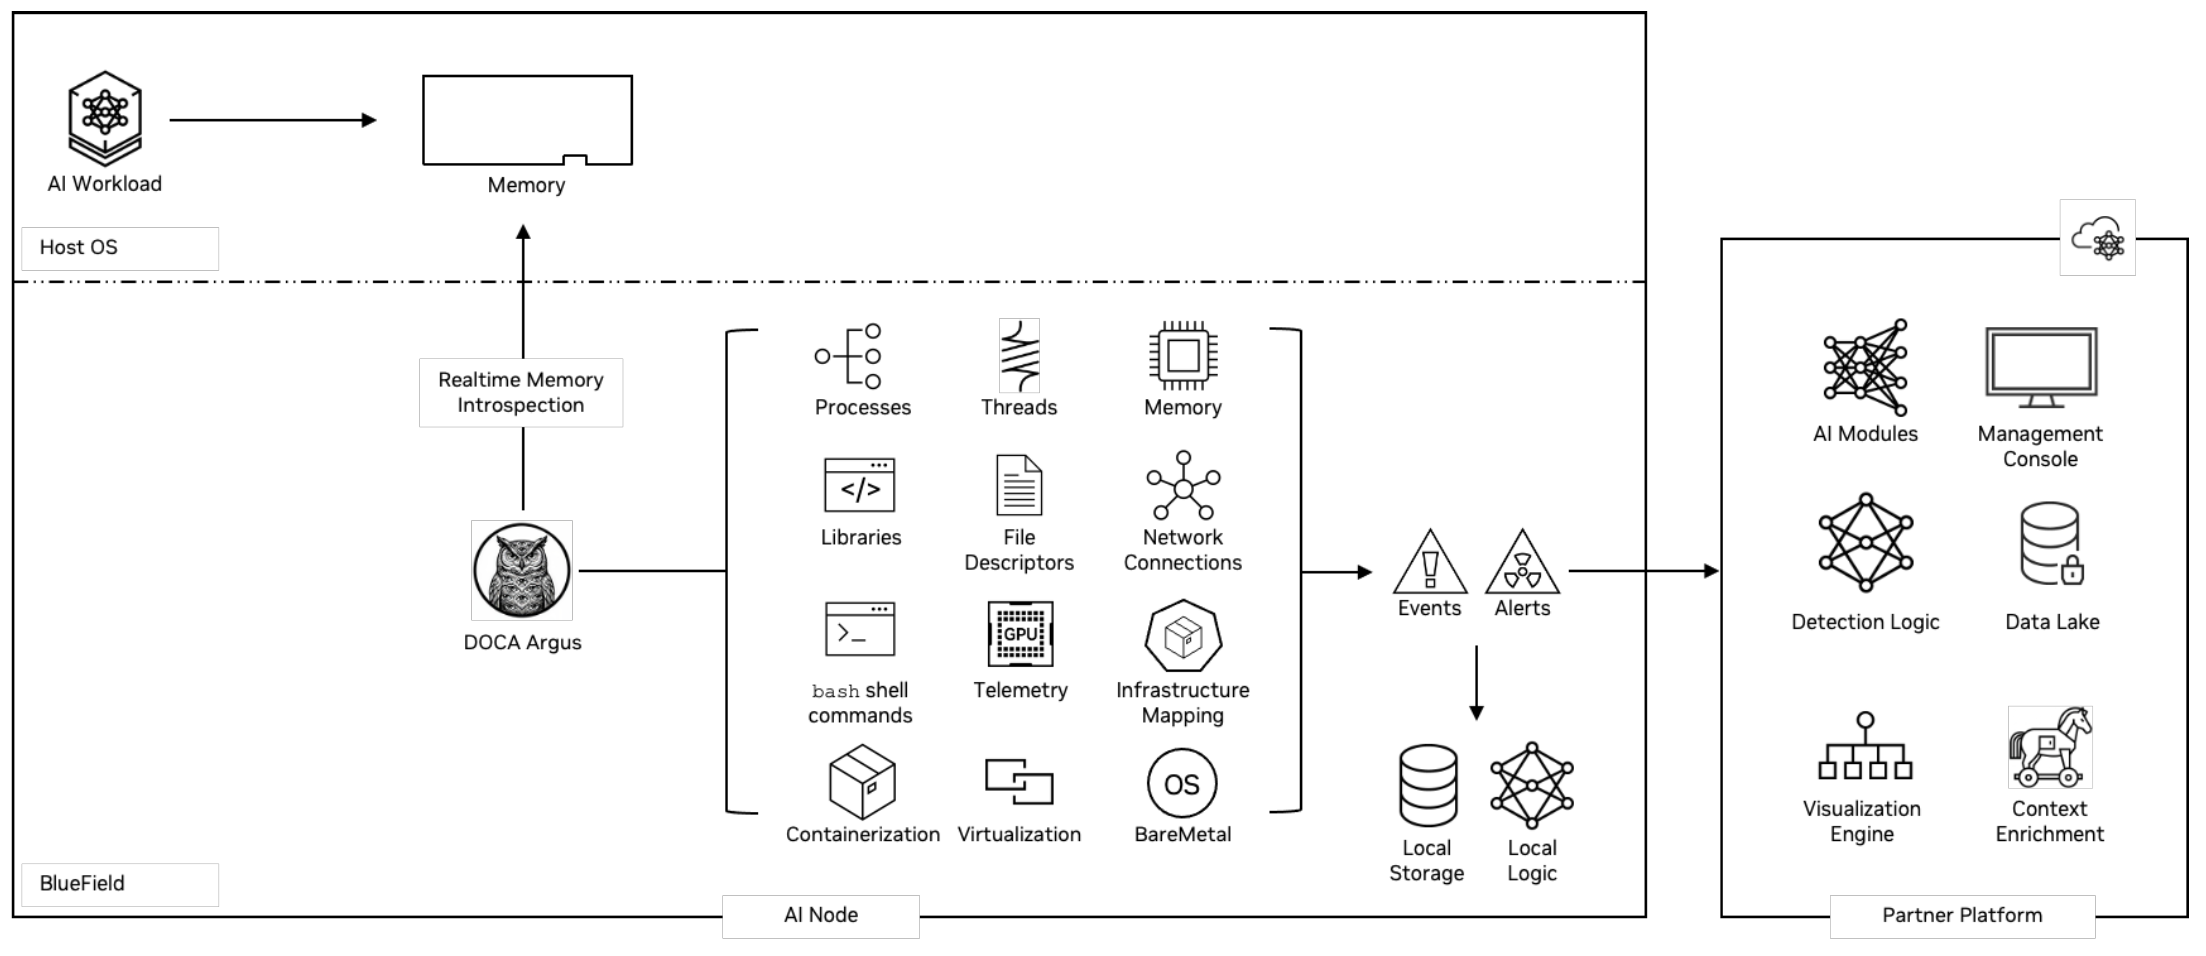
DOCA Argus is a service that runs on an NVIDIA® BlueField® DPU and provides real-time situational awareness of the compute node that the DPU is attached to. It uses live machine introspection, performed at the hardware level, to analyze selected regions of volatile host memory, which is the authoritative source for the operational state of the system. DOCA Argus copies these regions with zero-copy data access techniques, without affecting application or AI workload performance.
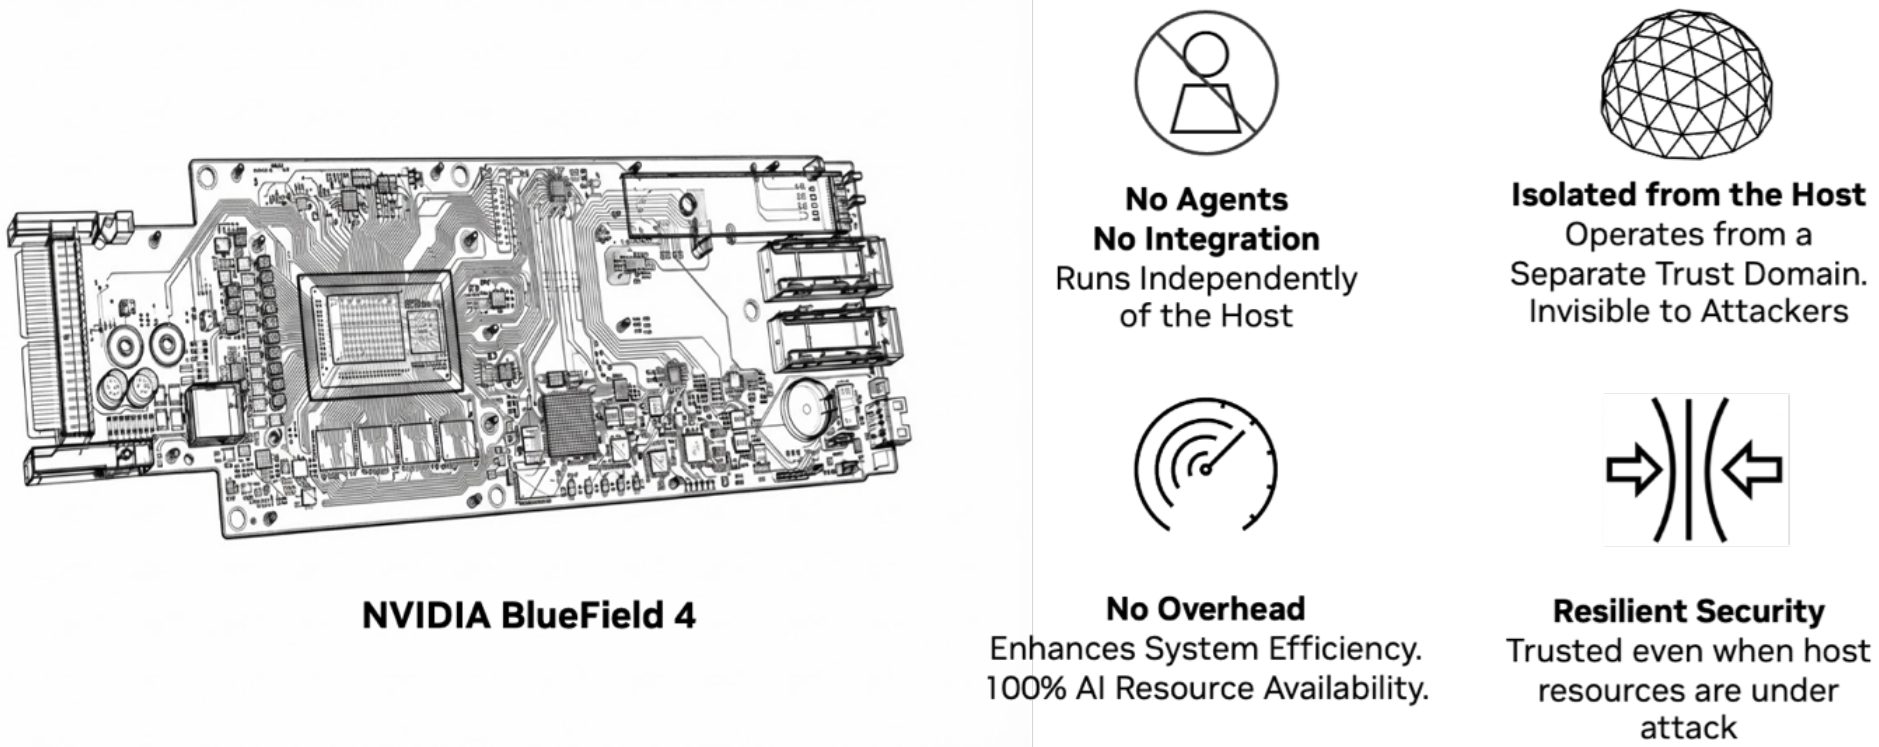
DOCA Argus runs in a BlueField trust domain that is isolated from the host. It requires no agents, integration, or host resources, and it continues to operate even if the host is compromised. A single BlueField DPU running DOCA Argus can monitor an entire compute node in bare-metal, virtualized, containerized, sandboxed, and multi-tenant environments.
Operation
DOCA Argus identifies the Linux kernel version running on the compute node and applies a matching kernel-specific memory map to locate the memory regions to monitor. It supports x86 and Arm64 CPUs. Using NVIDIA DOCA DMA, it reads those regions and decodes the raw data into information about processes, threads, execution states, and system behavior.
A policy engine filters out irrelevant activity and continuously analyzes memory for state changes and anomalous behavior. Activity that matches one or more policy rules is reported as an event or an alert. For definitions, see Message Type.
DOCA Argus logs events, alerts, and system activity messages locally in JSON and syslog formats. It can also export them through Fluent Bit or Vector to security platforms, data lakes, and other big data platforms, such as extended detection and response (XDR) platforms, for additional logic and enrichment. For settings, see Output and Log Types.
DOCA Argus does not extract personally identifiable information (PII). It reports only the information described in this guide, and you cannot customize the reported information.
Use Cases
DOCA Argus identifies the workloads running on the compute node, how they are deployed, and how they operate, starting at the process level. Security and observability platforms use this data in the following ways.
Runtime Workload Threat Detection
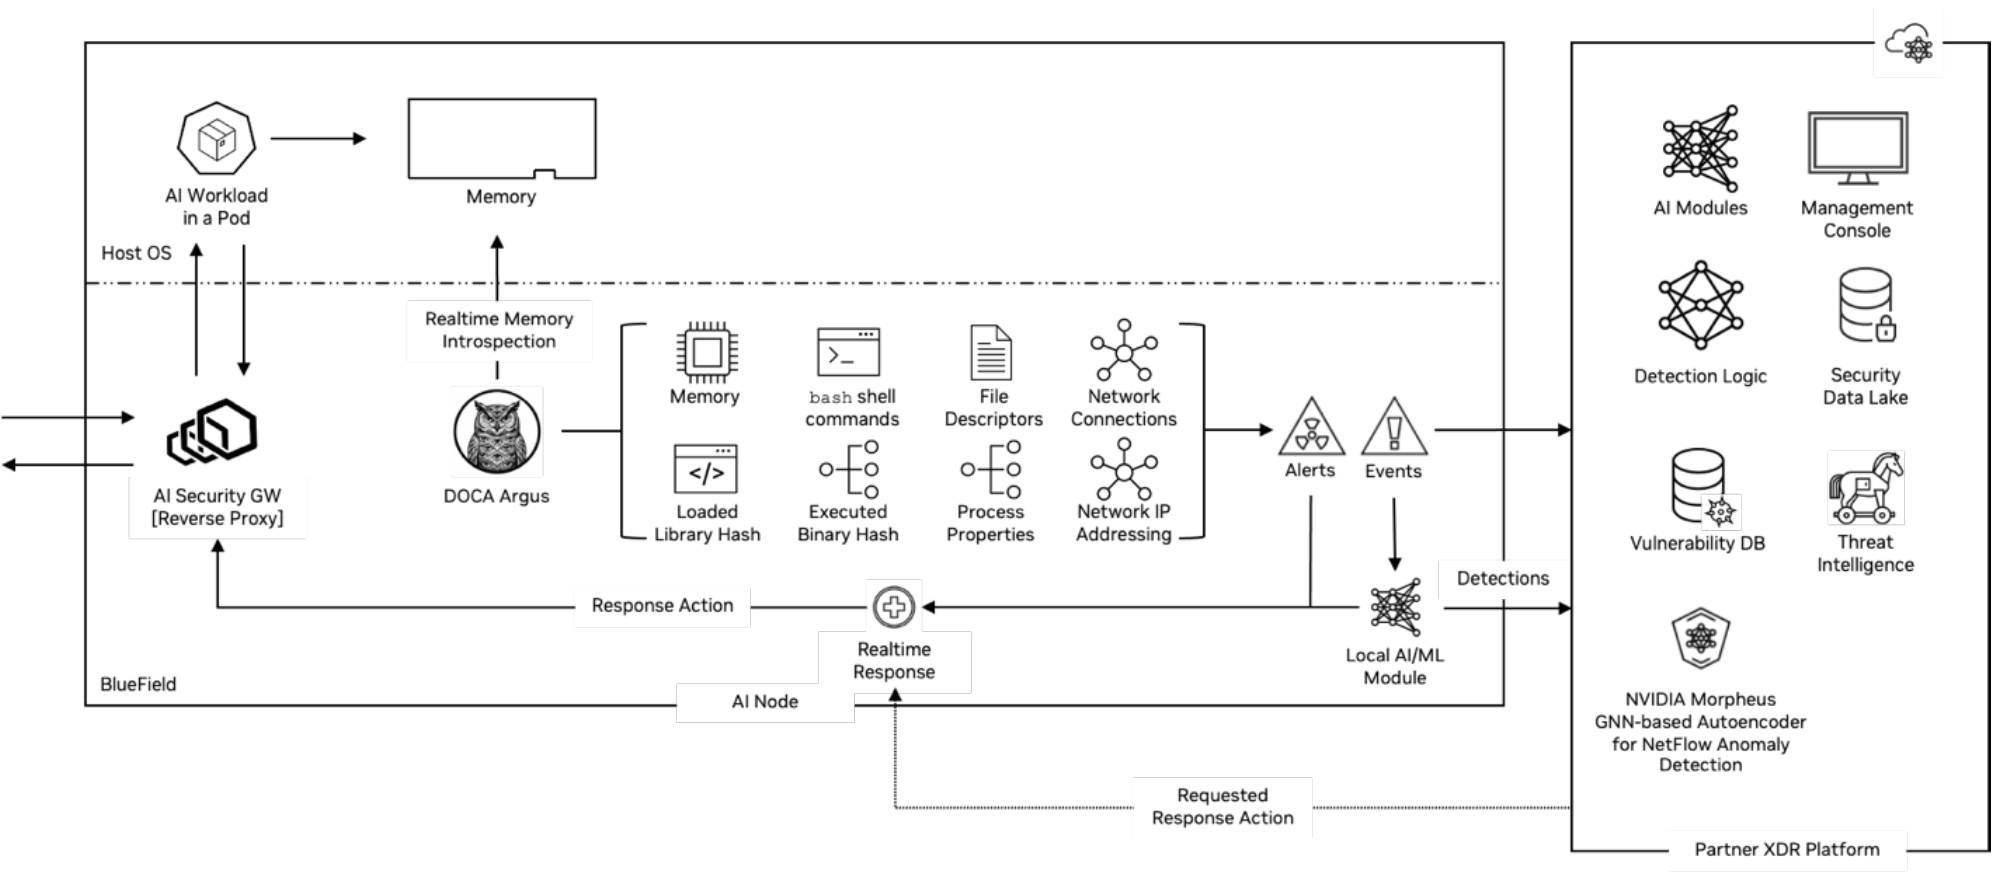
Containers created from the same image are expected to behave consistently, so you can create a behavioral profile for each container and monitor for deviations that might indicate compromise. To support this, DOCA Argus reports the following:
-
Executed binaries, loaded libraries, and their SHA-256 hashes
-
Execution paths and command-line arguments
-
Per-process file access, including which files are accessed, by which processes, and what actions are performed
-
Inbound and outbound network connections for each process
-
Indicators of compromise, such as executed Bash commands, reverse shell activity, and unauthorized process execution
Cybersecurity independent software vendors (ISVs) and security teams can ingest this data, together with events and alerts, into security information and event management (SIEM), security orchestration, automation, and response (SOAR), and XDR platforms. There, they can combine it with their own threat intelligence, analytics, and correlation logic to detect threats in real time and respond to them, for example, by containing a threat or preventing lateral movement.
AI Discovery
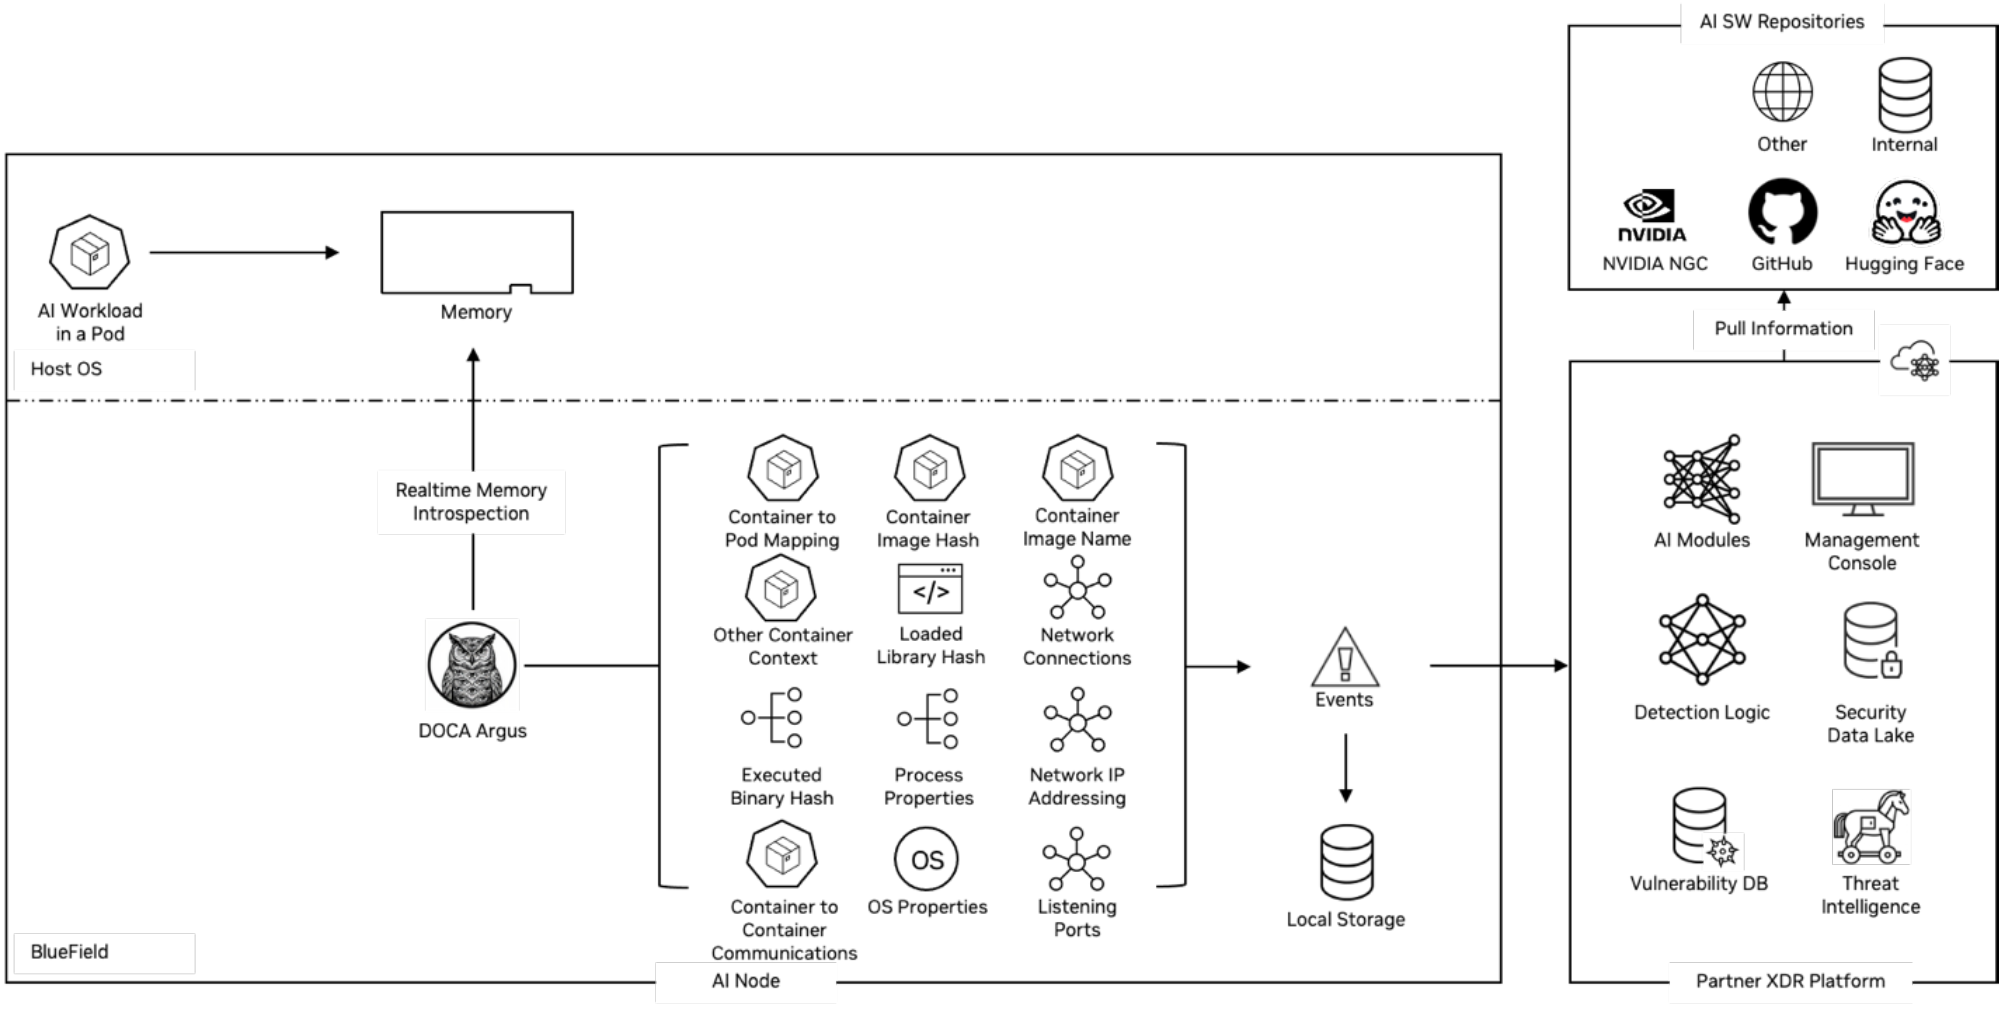
DOCA Argus provides the data to identify and map AI infrastructure and workloads in real time:
-
How each workload is deployed (in a container, in a virtual machine, or on bare metal) and its relationships, such as container-to-Pod, container-to-VM, and container-to-operating-system mappings
-
Container image hashes, which can be correlated with public AI repositories and internal software repositories to identify AI software, AI models, large language models (LLMs), and AI agents
-
Process-level network connections and exposed network services
This data also supports passive vulnerability assessment, runtime integrity monitoring, behavioral analysis, and AI exposure management, such as analyzing network traffic to and from an AI workload for traces of PII.
Observability
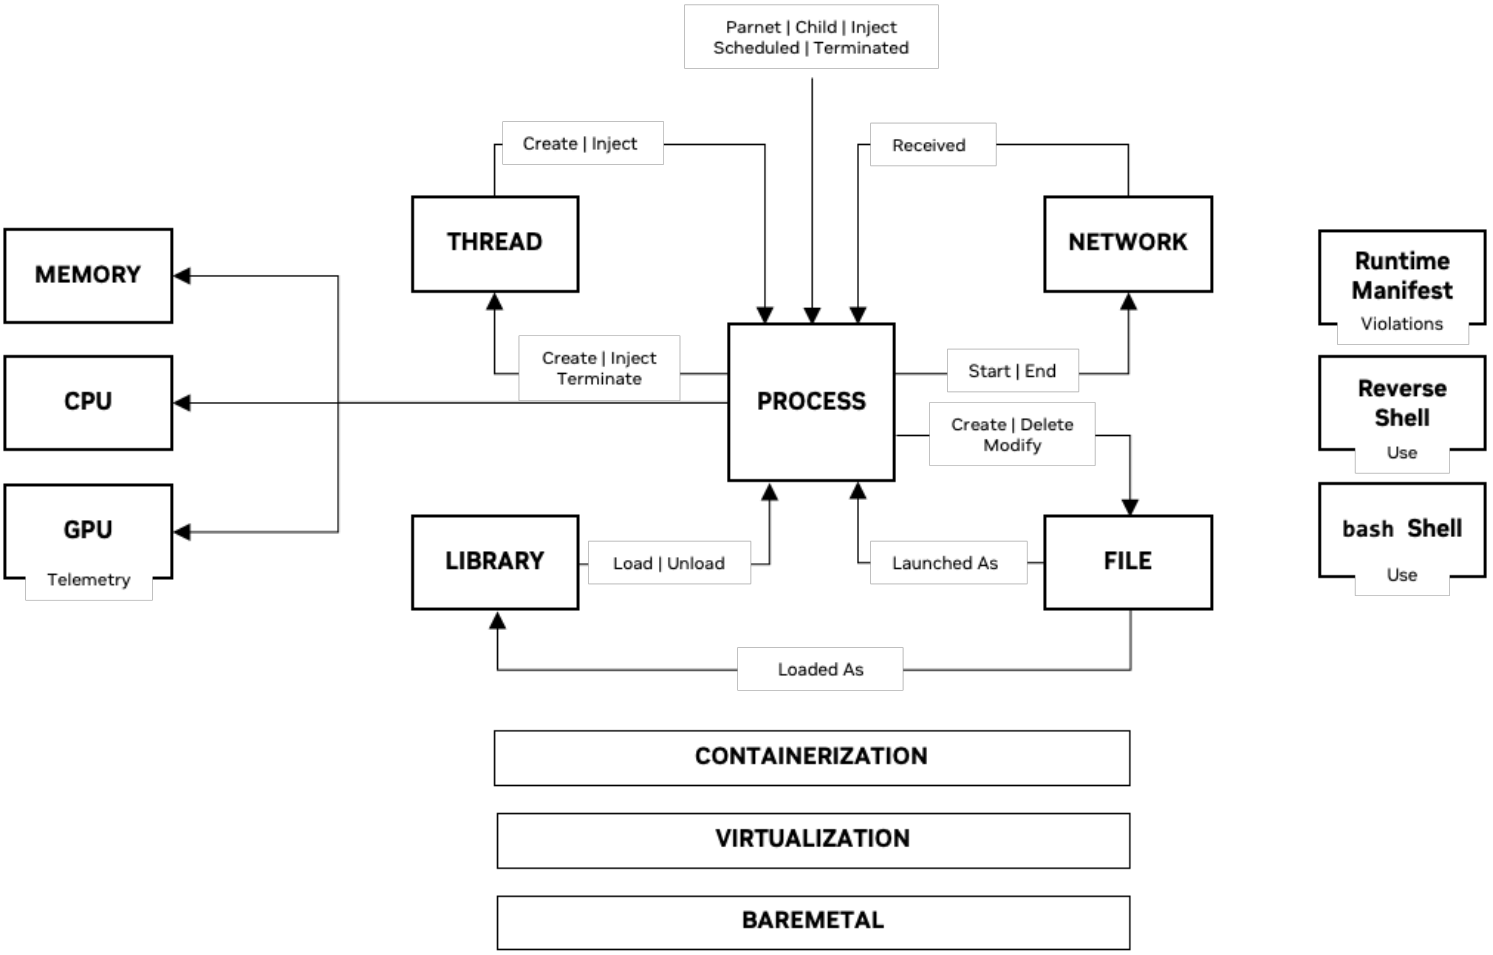
DOCA Argus reports how workloads interact with memory, threads, the network, the file system, CPUs, and GPUs. It maps each process in an AI workload to the AI node that runs it and to the GPUs that the process uses. For GPUs, it reports the following:
-
Physical GPU attributes, including make, model, and serial number
-
Mappings of workloads to physical or virtual GPUs
-
Process-to-GPU utilization metrics and other GPU observability data
Requirements
-
Operates only on BlueField-3 or later configured in DPU mode (see BlueField Modes of Operation).
-
Requires firmware version 24.35.0388 or later.
-
Supported BlueField image versions: 4.11.0 or later.
-
The DOCA Argus service container must run in privileged mode to enable full-system DMA reads.
Limitations
-
Tested against KVM-based hypervisors only.
-
Supports Linux-based OSs (bare-metal, virtualization, containers).
-
Kata Containers are supported only if NVIDIA-DPU support is enabled.
Prerequisites
-
Configure BlueField firmware. On BlueField, configure the base address register (BAR) of the physical function (PF):
dpu> mlxconfig -d /dev/mst/<mst_device> s PF_BAR2_SIZE=2 PF_BAR2_ENABLE=1Replace
<mst_device>withmt41692_pciconf0for BlueField-3.If you monitor virtual functions (VFs), also enable single root I/O virtualization (SR-IOV) and set the number of VFs:
dpu> mlxconfig -d /dev/mst/<mst_device> s SRIOV_EN=1 NUM_OF_VFS=<vf-number> -
Enable input-output memory management unit (IOMMU) passthrough only if it is not already enabled.
-
Edit the GRUB configuration:
host> sudo vim /etc/default/grub -
Add the following value to
GRUB_CMDLINE_LINUX_DEFAULT:iommu=pt <intel/amd>_iommu=on -
Apply the changes:
-
Ubuntu:
sudo update-grub -
CentOS or RHEL:
sudo grub2-mkconfig -o /boot/grub2/grub.cfg
-
-
Reboot the host.
-
Generate Profiles Manually
DOCA Argus automatically generates the required symbol and memory-region configuration at runtime. If automatic generation fails, prepare the target system manually:
-
Install the required debug packages on the target system:
-
Ubuntu:
sudo tee /etc/apt/sources.list.d/ddebs.list << EOF deb http://ddebs.ubuntu.com/ $(lsb_release -cs) main restricted universe multiverse deb http://ddebs.ubuntu.com/ $(lsb_release -cs)-updates main restricted universe multiverse deb http://ddebs.ubuntu.com/ $(lsb_release -cs)-proposed main restricted universe multiverse EOF sudo apt install ubuntu-dbgsym-keyring sudo apt-get update sudo apt-get install linux-image-$(uname -r)-dbgsym -
CentOS or RHEL:
sudo yum install --enablerepo=base-debuginfo \
  kernel-devel-$(uname -r) \
  kernel-debuginfo-$(uname -r) \
  kernel-debuginfo-common-$(uname -m)-$(uname -r)
-
-
Make
doca_apsh_config.pyavailable on the target system using one of the following methods:-
If DOCA is installed on the target system, use
/opt/mellanox/doca/tools/doca_apsh_config.pyand continue to the next step. -
Otherwise, copy the script from BlueField:
scp <bf-user>@<bf-ip>:/opt/mellanox/doca/tools/doca_apsh_config.py /tmp/
-
-
Download a
dwarf2jsonrelease binary from volatilityfoundation/dwarf2json. -
Create the JSON files:
cd /opt/mellanox/doca/tools/
pip3 install psutil pdbparse
python3 doca_apsh_config.py --files memregions symbols --os <windows/linux> --path <path-to-dwarf2json>
cp /opt/mellanox/doca/tools/*.* <shared-folder>
dpu> scp <shared-folder>/* <path-to-doca-argus-binary>
Service Deployment
-
For DPU container deployment, see the DOCA Container Deployment Guide.
-
For deployment steps specific to DOCA Argus, see the DOCA Argus container page on NGC.
-
For offline deployment, see Offline Deployment in the DOCA Container Deployment Guide.
Service Configuration
DOCA Argus configuration is managed through SERVICE_CONFIG_FILE in the container YAML.
Service
-
Immediate shutdown – Terminates immediately on
SIGINTorSIGTERMand skips graceful shutdown. -
Service log level – Sets DOCA logging verbosity. The default is
50(INFO). Supported values are10(DISABLE),20(CRITICAL),30(ERROR),40(WARNING),50(INFO),60(DEBUG), and70(TRACE). -
System scanner sleep time – Sets the delay between scans. Supported units are
s,m, andms.
DOCA Argus Configuration
-
Auto scan – Scans all available systems unless the
systemssection is defined. -
Profile generation – Automatically generates the required kernel data at runtime when no prebuilt data is available. Initialization can take longer when profile generation is required.
-
Default – Defines configuration values that apply unless overridden under
systems. -
Systems – Defines the monitored systems and their overrides.
Per-system Configurations
-
Representor ID – Specifies the VU ID of the VF or PF to track.
-
PF:
host> lspci -vv -s <PF_pci_address> | grep VU | cut -d " " -f 4 -
VF – Append
VF<x>to the PF VU ID. For example:MT2333XZ06YAMLNXS0D0F0VF1.
-
-
Memory regions path – Specifies a JSON file path, or
auto, for the host OS memory map. -
OS symbol path – Specifies a JSON file path or directory, or
auto. -
OS type – Specifies
LinuxorWindows. -
DMA device name – Matches the representor ID. List devices with:
dpu> ibv_devinfo | grep 'hca_id' | awk '{print $2}' -
Service log level – Overrides the service logging verbosity.
-
SDK log level – Sets SDK logging verbosity.
-
Limits – Sets maximum values for string length, processes, file descriptors, threads, virtual memory areas, and kernel modules.
-
Events – Contains the following settings:
-
Container filter – Includes or excludes containerized processes.
-
Container enrichment – Enriches messages from containerized processes with container and Kubernetes Pod metadata. Enabled by default.
-
SBOM – Lists the SHA signatures of approved executables and libraries (software bill of materials).
-
Collection
-
Events – Enables or disables each event type.
Output
-
Log events to stdout – Enables logging to standard output.
-
Log folder path – Specifies the directory for file logs.
-
Log threshold size – Rotates logs when they reach this size.
-
Log max files count – Sets the maximum number of rotated log files.
-
Telemetry address – Specifies the aggregator address.
-
Telemetry tag – Specifies the tag used by Fluent Bit.
-
Telemetry format – Specifies
JSONorsyslog. -
Telemetry user data – Specifies custom metadata to include in telemetry records.
Log Types
DOCA Argus produces the following types of logs and output.
Standard Output
DOCA Argus displays important service messages on standard output, including version information, successful startups, and startup failures.
Debug Log Output
The debug log provides complete debug output, including partial event data, trace logs, and collection failures. These logs are stored in /var/log/doca_argus/.
Event Log Output
DOCA Argus stores the complete event log in JSON format in the configured log folder. For local storage, Linux logrotate manages log rotation. You can override the default configuration in /etc/cron.d/logrotate and /etc/logrotate.d/argus.
Telemetry Output
DOCA Argus can produce telemetry records in JSON or syslog format.
Telemetry is disabled by default. To enable it, set telemetry_address in the service configuration and ensure that telemetry_tag matches the tag in the telemetry pipeline configuration.
Fluent Bit
The DOCA Argus container page on NGC provides YAML configuration examples for Fluent Bit and Vector. Use the applicable YAML file as the starting point for your telemetry deployment.
Fluent Bit runs independently from the DOCA Argus service. To run Fluent Bit locally on the DPU, use an input configuration similar to the following:
[INPUT]
    Name                  tcp
    Tag                   <your_preferred_tag>
    Listen                0.0.0.0
    Port                  24224
    Format                json
For Splunk, add the following encapsulation filter:
[FILTER]
    Name                  nest
    Match                 *
    Operation             nest
    Wildcard              *
    Nest_under            event
The following example forwards telemetry to Elasticsearch:
[INPUT]
    Name                  tcp
    Tag                   elastic_forward_input
    Listen                0.0.0.0
    Port                  24224
    Format                json

[SERVICE]
    Log_Level             info

[OUTPUT]
    Name                  es
    Match                 *
    Host                  <elasticsearch_ip>
    Port                  <elasticsearch_port>
    Index                 argus
    Suppress_Type_Name    On
    Log_Level             info
Run Fluent Bit with the configuration:
docker run --rm --net=host -v <path_to_fluentbit_conf_file>:/fluent-bit/etc/fluent-bit.conf --name fluent_bit -it fluent/fluent-bit
For additional output plugins, see the Fluent Bit manual.
Vector
Vector is an observability data pipeline that can receive DOCA Argus telemetry over TCP, decode JSON records, and forward them to supported destinations such as Elasticsearch. Vector can run independently from the DOCA Argus service or as a sidecar container in the same Kubernetes Pod.
Set telemetry_address to the Vector listener address, such as 127.0.0.1:24224, and set telemetry_format to json. The following configuration receives JSON telemetry and forwards it to Elasticsearch:
data_dir: /vector-data-dir

sources:
  tcp_json_in:
    type: socket
    mode: tcp
    address: "127.0.0.1:24224"
    decoding:
      codec: json

sinks:
  elasticsearch_out:
    type: elasticsearch
    inputs: ["tcp_json_in"]
    endpoints:
      - "http://<elasticsearch_ip>:<elasticsearch_port>"
    bulk:
      index: "argus"
Start Vector with the configuration file:
vector --config /etc/vector/vector.yaml
For Kubernetes deployments, Vector can run alongside the DOCA Argus container and share a configuration volume. DOCA Argus sends telemetry to 127.0.0.1:24224, and Vector listens on the same Pod network and forwards records to the configured sink.
containers:
  - name: vector
    image: timberio/vector:0.43.1-alpine
    imagePullPolicy: IfNotPresent
    args: ["--config", "/etc/vector/vector.yaml"]
    volumeMounts:
      - mountPath: /etc/vector
        name: conf-vector-config
Ensure that the Vector configuration volume is populated before the Vector container starts. For additional source, transform, and sink options, see the Vector documentation.
Troubleshooting
For issues with installing, deploying, or running DOCA Argus, see the DOCA SDK page of the NVIDIA BlueField Platform Software Troubleshooting Guide.
Reported Activities
This section is a reference to the activities that DOCA Argus reports. It is intended for security ISVs, system integrators (SIs), NVIDIA Cloud Partners (NCPs), and anyone who integrates with DOCA Argus.
Naming Conventions
Reported messages use the following naming conventions:
-
Parameter names use lowercase letters.
-
Names are explicit.
-
An underscore (
_) separates words. -
Parameter names for measurements include the unit of measure, for example,
process_hash_sha256oraverage_packet_size_bytes. -
Enum values use uppercase letters (
UPPER_CASE) and begin with a letter. -
Path values use Linux forward slashes instead of backslashes to avoid escaping, for example,
/Users/askywalker. -
Timestamps use the ISO 8601 format
YYYY-MM-DDTHH:MM:SS.nnnnnnnnn±hh:mm. On Linux-based systems, time is represented in UTC. The format has the following parts:-
YYYY-MM-DDis the date. -
Tseparates the date and the time. -
HH:MM:SSis the time. -
nnnnnnnnnis the nanoseconds. -
±hh:mmis the time zone offset from UTC, for example,+02:00or-01:00.
-
-
Empty fields have the value
null.
In the current DOCA Argus version, a field with no information might appear as an empty string (""), null, or N/A.
In the current DOCA Argus version, a field with no information might appear as an empty string (""), null, or N/A.
In the current DOCA Argus version, a field with no information might appear as an empty string (""), null, or N/A.
In the current DOCA Argus version, a field with no information might appear as an empty string (""), null, or N/A.
In the current DOCA Argus version, a field with no information might appear as an empty string (""), null, or N/A.
In the current DOCA Argus version, a field with no information might appear as an empty string (""), null, or N/A.
Message Type
DOCA Argus collects raw activities from host memory and uses them to describe the operational state of a workload. The policy engine processes raw activities, filters out irrelevant content, and reports only meaningful data. Its output supports uses such as real-time visibility, telemetry, threat detection, breach detection, and indicators of attack.
A raw activity that matches one or more policy rules becomes a meaningful activity. DOCA Argus reports the following message types:
-
Event – One or more meaningful activities that show the current recorded state and provide situational awareness.
-
Alert – One or more meaningful activities that show an immediate threat or immediate impact, and that must be investigated or responded to immediately.
-
System activity – Information about the operational state of the DOCA Argus service.
Message Structure
Each reported activity uses the structure described in this section.
Schema
The following table describes the message parameters:
|
Parameter |
Type |
Parent Object |
Description |
|---|---|---|---|
|
|
object |
— |
Root object containing the message metadata. |
|
|
enum |
|
Set to |
|
|
enum |
|
Set to |
|
|
string |
|
The current version of the product. |
|
|
enum |
|
One of |
|
|
enum |
|
One of |
|
|
string |
|
The current version of the JSON schema. |
|
|
string |
|
The unique message identifier. |
|
|
string |
|
BlueField card time. |
|
|
string |
|
BlueField card time. |
|
|
string |
|
Custom user data added to every message. |
|
|
object |
|
Information about the BlueField system. |
|
|
array |
|
A list of all configured BlueField interfaces, with their names, IP addresses, and MAC addresses. Includes both IPv4 and IPv6 addresses. |
|
|
string |
|
The interface name. |
|
|
string |
|
The interface MAC address. |
|
|
string |
|
The list of IPv4 addresses associated with the interface. |
|
|
string |
|
The list of IPv6 addresses associated with the interface. |
|
|
object |
|
Information specific to the workload. |
|
|
string |
|
The unique identifier of the workload, if any. |
|
|
string |
|
The OS version of the workload, for example, |
|
|
string |
|
Unique identifier for the current kernel boot. |
|
|
string |
|
The hostname of the workload. |
|
|
array |
|
A list of all workload interfaces, with their names, IP addresses, and MAC addresses. |
|
|
string |
|
The interface name. |
|
|
string |
|
The interface MAC address. |
|
|
string or array |
|
The IPv4 addresses associated with the interface. |
|
|
string or array |
|
The IPv6 addresses associated with the interface. |
|
|
object |
|
Container information. Populated only if the reported workload is a container. Added in DOCA Argus 3.5. |
|
|
string |
|
The container's unique identifier. |
|
|
string |
|
The container name. |
|
|
string |
|
The container image name. |
|
|
string |
|
The SHA-256 hash that uniquely identifies a specific build of a container image. |
|
|
string |
|
A unique cryptographic identifier (SHA-256 hash) that represents the content of a Docker image. |
|
|
string |
|
The name of the Pod that the container is part of. |
|
|
string |
|
The unique identifier of the Pod that the container is part of. |
|
|
string |
|
The IP address of the Pod that the container is part of. |
|
|
enum |
|
|
|
|
object |
|
Details about the reported activity. |
|
|
string |
|
The name of the alert, event, or system activity. |
|
|
object |
|
Detailed information for the message type. |
The Pod parameters (pod_name, pod_uid, and pod_ip_address) are populated only if the workload is a container that runs in a Pod.
Example JSON Message
The following example shows the data that DOCA Argus produces for each event and alert:
{
    "vendor_name": "NVIDIA"
    "product_name": "DOCA_ARGUS"
    "product_version": "<version">
    "message_type": <"EVENT" | "ALERT" | "SYSTEM_ACTIVITY">,
    "severity": <"INFO" | "ERROR" | "WARNING" | "MEDIUM" | "HIGH" | "CRITICAL">,
    "schema_version": "1.0",
    "message_id": <"unique_message_id">,
    "occurred_message_time_iso_8601_ns": "2024-10-31T17:20:10.02.123456789+02:00",
    "message_timezone": "UTC",
    "user_data": "<STRING>",
    "bluefield_system_information": {
        "bluefield_networking_interfaces": {
            "0": {
                "bluefield_network_interface_name": "docker0",
                "bluefield_network_interface_mac_address": "00:1a:ca:ff:ff:01",
                "bluefield_network_interface_ipv4_address": "172.17.0.1",
                "bluefield_network_interface_ipv6_address": "fe80::21a:caff:feff:ff01",
            },
            "1": {
                …
            }
            …
        },
    },
    "workload_information": {
        "unique_identifier": "<>",
        "os_version": "Linux version 5.4.0-26-generic",
        "boot_uuid": "6d516e23-6fa0-45ca-907a-5cac46cd5737",
        "hostname": "5c94642421ce",
        "workload_networking_interfaces": {
            "0": {
                "workload_network_interface_name": "eth0",
                "workload_network_interface_mac_address": "52:54:00:47:5d:ad",
                "workload_network_interface_ipv4_address": "192.168.121.81",
                "workload_network_interface_ipv6_address": "fe80::5054:ff:fe47:5dad",
            },
            "1": {
                …
            }
            …
        },
    },

    "container_context": {
        "container_id": "c0798b9e9d8fdc21a96b16bf022bbcc7613e42560a307b283bd2d9953eb1b937",
        "container_name": "<NAME>",
        "image_name": "ubuntu:22.04",
        "image_digest": "sha256:714d1a2f39e9830a7c0453dc924ddf849be74811c13e4afaa21c0b9b6ad74af0",
        "image_manifest_digest": "sha256:71343a2f45e9830a7c0453dc924ddf849be74811c13e4afaa21c0b9b6ad74af0",
        "pod_name": <NAME>,
        "pod_uid": <UID>,
        "pod_ip_address": <IP_ADRESS>,
        "enrichment_status": "<complete|partial>"
        }
    },
},

<"activity_data">: {
    <"name">: <"the name of the event | alert | system_activity">,
    <<Activity data details, per event | alert | system_activity type>>
}
}
Alerts, Events, and System Activity Messages
This section lists the messages that DOCA Argus supports. The Attributes column lists the attribute objects that each message includes. For the fields in each object, see Attributes.
Events and Alerts
The following tables list the events and alerts that DOCA Argus reports, grouped by category.
Bash Shell
|
Type |
Severity |
Activity Name |
Attributes |
Description |
|---|---|---|---|---|
|
Event |
Info |
Shell Command Executed |
One or more new Bash shell commands were executed. |
|
|
Alert |
High |
Shell History Cleared |
The Bash shell history was cleared. |
|
|
Alert |
High |
Shell History Disabled |
The Bash shell history was disabled. |
Containers
File Descriptors
|
Type |
Severity |
Activity Name |
Attributes |
Description |
|---|---|---|---|---|
|
Event |
Info |
File Descriptor Open |
A new file descriptor was opened. |
|
|
Event |
Info |
File Descriptor Close |
A file descriptor was closed. |
|
|
Alert |
Medium |
File Descriptor File Content Change |
A file descriptor with write permissions was closed, and its content might have changed. |
GPU Telemetry
GPU telemetry was added in DOCA Argus 3.5 and is opt-in. To enable it, run a command such as nvidia-smi rusd -spm all.
|
Type |
Severity |
Activity Name |
Attributes |
Description |
|---|---|---|---|---|
|
Event |
Info |
GPU Identity |
Identifies the make and model of each GPU on the AI node. By default, DOCA Argus generates one event per GPU every minute. |
|
|
Event |
Info |
GPU Metrics |
Provides telemetry for each GPU in operation. By default, DOCA Argus generates one event per GPU every second. |
|
|
Event |
Info |
GPU Topology |
Provides information about how devices are connected to each other. By default, DOCA Argus generates one event every minute. |
Kernel Modules
Kernel module auditing was added in DOCA Argus 3.5.
|
Type |
Severity |
Activity Name |
Attributes |
Description |
|---|---|---|---|---|
|
Event |
Info |
Kernel Module Changed |
Provides information about a kernel module whose parameters changed. |
|
|
Event |
Info |
Kernel Module Loaded |
On initialization, lists all loaded kernel modules. After that, provides information about each newly loaded kernel module. |
|
|
Event |
Info |
Kernel Module Unloaded |
Provides information about a kernel module that was unloaded. |
Network Connections
|
Type |
Severity |
Activity Name |
Attributes |
Description |
|---|---|---|---|---|
|
Event |
Info |
Network Connection Created |
A new TCP network connection was created. |
|
|
Event |
Info |
Network Connection Terminated |
A TCP network connection was terminated. |
|
|
Alert |
Low |
TCP Connection Excessive Data |
Monitors the amount of incoming and outgoing data, in bytes, on a TCP network connection, and reports when it exceeds a size threshold. You can configure the threshold separately for incoming and outgoing traffic. |
|
|
Alert |
Low |
TCP Long Lasting Connection |
Monitors the overall duration of a TCP connection, and reports when it exceeds a configurable time threshold. |
|
|
Event |
Info |
TCP Network Connection State Change |
Monitors for changes in the state of TCP network connections, for example, SYN SENT or SYN RECEIVED. |
|
|
Event |
Info |
TCP Network Connections Status |
Periodically reports the TCP connections currently open for each process, including, for example, the number of packets and bytes sent and received. The reporting interval is configurable. Disabled by default. |
|
|
Alert |
High |
Reverse Shell Detected |
Monitors for a process that started with stream redirection to a remote connected socket, where |
Process Memory
|
Type |
Severity |
Activity Name |
Attributes |
Description |
|---|---|---|---|---|
|
Event |
Info |
Process Memory Created |
A new virtual memory area, such as a heap, stack, or executable area, was created. Disabled by default. |
|
|
Event |
Info |
Process Memory Terminated |
A virtual memory area is no longer visible (terminated). Disabled by default. |
|
|
Event |
Warning |
New Executable Anonymous Memory Mapped |
An executable anonymous memory area was mapped. |
|
|
Alert |
Medium |
Executable Permissions Added |
Executable permissions were added to a memory area. |
|
|
Alert |
Medium |
Executable Permissions Removed |
Executable permissions were removed from a memory area. |
|
|
Event |
Info |
New File Mapped |
A new memory-mapped file was detected. |
|
|
Event |
Info |
File Unmapped |
A memory-mapped file was unmapped. |
Processes
|
Type |
Severity |
Activity Name |
Attributes |
Description |
|---|---|---|---|---|
|
Event |
Info |
Process Created |
Process, including complete information about the parent process |
A new process was detected. |
|
Event |
Info |
Process Terminated |
A process was terminated. |
|
|
Event |
Warning |
Process Zombie |
Process (partial) |
Detects a process in a zombie state. |
|
Alert |
High |
Process Hidden |
Detects a process in a hidden state. |
Runtime Manifest
|
Type |
Severity |
Activity Name |
Attributes |
Description |
|---|---|---|---|---|
|
Alert |
High |
Foreign Binary Executed |
Monitors for an executed binary that was not part of the original container image or was modified from it. This might indicate that an attacker controls the workload and is running arbitrary commands. |
|
|
Alert |
High |
Binary Executed Not as Intended |
Process, Process memory, Runtime manifest, Expected behavior |
Monitors for an executed binary from the original container image that ran with command-line arguments or from a folder path that does not match the original container image. |
|
Alert |
High |
Foreign Binary Executed File Size Mismatch |
Process, Process memory, Runtime manifest, Expected behavior |
Monitors for an executed binary whose reported file size differs from the file size of the binary in the original container image. |
|
Alert |
High |
Foreign Library Loaded |
Monitors for a library loaded into memory that was not part of the original container image or was modified from it. This might indicate that an attacker controls the workload and is running arbitrary code. |
|
|
Alert |
High |
Foreign Library Loaded File Size Mismatch |
Process, Process memory, Runtime manifest, Expected behavior |
Monitors for a loaded library whose reported file size differs from the file size of the library in the original container image. |
Threads
System Activity Messages
System activity messages report the operational state of the DOCA Argus service. Their message type is SYSTEM_ACTIVITY.
|
Severity |
Activity Name |
Attributes |
Description |
|---|---|---|---|
|
Error |
Details Gathering Failed |
Process (partial) |
DOCA Argus failed to collect information. |
|
Medium |
File Descriptor Limit Reached |
— |
The limit on the number of file descriptors to operate on was reached. |
|
Error |
Host Initialization Failed |
— |
Workload detection failed. |
|
Info |
Host Initialization Started |
— |
Workload detection started. |
|
Info |
Host Initialization Successful |
— |
Workload detection completed successfully. |
|
Error |
Invalid SBOM Configuration File |
— |
The provided SBOM configuration file is invalid. Added in DOCA Argus 3.5. |
|
Error |
Invalid SBOM Configuration Folder |
— |
The configured folder for the SBOM configuration file is invalid. Added in DOCA Argus 3.5. |
|
Medium |
Kernel Module Limit Reached |
— |
The limit on the number of kernel modules to operate on was reached. Added in DOCA Argus 3.5. |
|
Info |
Load Memory Regions Failed |
— |
DOCA Argus failed to load the memory regions information. Added in DOCA Argus 3.5. |
|
Info |
Load Memory Regions Successful |
— |
DOCA Argus loaded the memory regions information. Added in DOCA Argus 3.5. |
|
Info |
Loading Profile Candidate |
— |
DOCA Argus identified an OS profile to use. |
|
Error |
No Matching Profile Found |
— |
No matching OS profile was found. |
|
Info |
OS Identifier Discovery Extended |
— |
Discovery of the underlying OS of the workload is taking longer than expected. |
|
Info |
OS Identifier Found |
— |
DOCA Argus detected the underlying OS of the workload. |
|
Medium |
Process Limit Reached |
— |
The limit on the number of processes to operate on was reached. |
|
Medium |
Process Memory Limit Reached |
The limit on the number of virtual address descriptors to operate on was reached. |
|
|
Error |
Profile Parsing Failed |
— |
DOCA Argus failed to parse an OS profile. |
|
Info |
Profile Verification Successful |
— |
DOCA Argus initialized successfully with a specific OS profile. |
|
Error |
Profile Verification Failed |
— |
Initialization with an OS profile failed. DOCA Argus continues and tries the next OS profile candidates. |
|
Info |
Service Initialization Started |
— |
The DOCA Argus initialization stage started. |
|
Info |
Service Initialization Successful |
— |
The DOCA Argus initialization stage completed successfully. |
|
Error |
Service Initialization Failed |
— |
DOCA Argus initialization failed. |
|
Error |
Service Runtime Failure |
— |
A critical internal service error occurred. DOCA Argus is offline. |
|
Info |
Service Gracefully Shutdown |
— |
DOCA Argus shut down gracefully after a user request. |
|
Medium |
Threads Limit Reached |
The limit on the number of threads to operate on was reached. |
|
|
Error |
Unable to Determine Target OS |
— |
DOCA Argus failed to detect the underlying OS of the workload. |
Attributes
This section describes the attribute objects that DOCA Argus reports and their fields.
Bash Shell Command Attributes
Bash shell command execution data is reported in the shell_command_details object:
|
Attribute |
Description |
|---|---|
|
|
A list, in JSON format, of executed commands ( |
|
|
Command execution time. |
|
|
The command line. |
Container Attributes
Container information is reported in the container_details object:
|
Attribute |
Description |
|---|---|
|
|
The container's unique identifier. |
|
|
The container name. |
|
|
The container image name. |
|
|
The SHA-256 hash that uniquely identifies a specific build of a container image. |
|
|
A unique cryptographic identifier (SHA-256 hash) that represents the content of a Docker image. |
|
|
The name of the Pod that the container is part of. |
|
|
The unique identifier of the Pod that the container is part of. |
|
|
The IP address of the Pod that the container is part of. |
|
|
|
File Descriptor Attributes
File descriptor information is reported in the file_descriptor_details object:
|
Attribute |
Description |
|---|---|
|
|
The file descriptor's identifier. |
|
|
The file descriptor's name. |
|
|
The file descriptor's type, for example, socket, regular file, or pipe. |
|
|
How the current process opened the file (read-only, write-only, or read-write) and which status flags were assigned to it (for example, append or non-block). For example: |
|
|
The unique identifier of the inode associated with the file descriptor. |
|
|
Identifies the device or file system on which the inode (the file) resides, as a major and minor number. The major number identifies the device type, and the minor number identifies a specific instance of that device. |
|
|
File permissions. |
|
|
The user ID of the file's owner. |
|
|
The group ID of the file's owner. |
|
|
The size of the file, in bytes. |
|
|
Indicates whether the file was deleted. |
|
|
The SHA-1 hash of the file. Calculated only for File Descriptor File Content Change alerts. |
|
|
The SHA-256 hash of the file. Calculated only for File Descriptor File Content Change alerts. |
|
|
The MD5 hash of the file. Calculated only for File Descriptor File Content Change alerts. |
|
|
The identifiers of the threads that use the file descriptor. |
|
|
Timestamp of the last inode change. |
|
|
Timestamp of the last modification of the file content. |
|
|
Timestamp of the last access to the file content. |
GPU Telemetry Attributes
GPU Identity, GPU Metrics, and GPU Topology events include the attribute objects in this section.
GPU Identity
GPU Identity events include the attribute objects in this section.
GPU Details
The gpu_details object includes the following attributes:
|
Attribute |
Description |
|---|---|
|
|
Universally unique identifier (UUID) assigned to the GPU, providing a persistent identifier across system reboots. |
|
|
Source from which the GPU UUID was obtained (for example, hardware, driver, or management interface). |
|
|
PCI Bus ID of the GPU in the format |
|
|
Zero-based index assigned to the GPU by the driver on the host system. |
|
|
Minor device number associated with the GPU device node in the operating system (for example, |
|
|
Human-readable model name of the GPU as reported by the driver. |
|
|
NVIDIA product brand associated with the GPU (for example, GeForce, RTX, Quadro, Tesla, NVIDIA RTX, Data Center). |
|
|
NVIDIA GPU architecture generation (for example, Kepler, Maxwell, Pascal, Volta, Turing, Ampere, Ada, Hopper, Blackwell). |
|
|
Current status or operating mode of the GPU System Processor (GSP) firmware. |
|
|
Compute mode that determines how compute contexts can access the GPU (for example, Default, Exclusive Process, Prohibited). |
|
|
CUDA Compute Capability version supported by the GPU, indicating its programming and hardware feature set (for example, 8.0, 9.0). |
|
|
Streaming Multiprocessor (SM) architecture version implemented by the GPU. |
|
|
Persistent Device Identifier (PDI), a stable identifier used to uniquely identify the physical GPU across software and management interfaces. |
|
|
Version of the GPU Video BIOS (VBIOS) firmware installed on the device. |
|
|
Identifier assigned to the physical GPU board, used to distinguish boards within a system. |
|
|
Source from which the GPU board identifier was obtained (for example, hardware, firmware, or driver). |
|
|
Manufacturer-assigned part number identifying the GPU board or module. |
|
|
Manufacturer-assigned serial number uniquely identifying the physical GPU board. |
GPU Inforom Board Info Details
The gpu_inforom_board_info_details object includes the following attributes:
|
Attribute |
Description |
|---|---|
|
|
Commercial marketing name of the GPU product as assigned by the manufacturer (for example, NVIDIA H100 PCIe 80GB). |
|
|
Manufacturer-assigned serial number uniquely identifying the physical GPU board. |
|
|
Manufacturer product part number (PPN) identifying the GPU board or module configuration. |
|
|
NVIDIA internal 699-series board part number identifying the board assembly. |
|
|
NVIDIA internal 965-series board part number identifying the board or manufacturing configuration. |
|
|
Hardware revision level of the GPU board. |
|
|
Manufacturer-assigned identifier for the memory devices installed on the GPU board. |
|
|
Manufacturing date code for the GPU memory devices. |
|
|
GPU board manufacturing date formatted as an ISO 8601 timestamp. |
|
|
Raw manufacturing date value reported by the hardware or firmware. |
|
|
Raw identifier of the GPU memory manufacturer as reported by the hardware or firmware. |
|
|
Human-readable name of the GPU memory manufacturer derived from the raw identifier (for example, Samsung, SK hynix, Micron). |
|
|
Raw identifier indicating the GPU board type as reported by the hardware or firmware. |
|
|
Human-readable description of the GPU board type derived from the raw identifier. |
GPU Graphics Core Counts Details
The gpu_graphics_core_counts_details object is an array. Each entry includes the following attributes:
|
Attribute |
Description |
|---|---|
|
|
Zero-based index identifying the GPU graphics device within the system or graphics subsystem. |
|
|
Streaming Multiprocessor (SM) architecture version implemented by the GPU, indicating the generation of SM hardware features. |
|
|
Number of Graphics Processing Clusters (GPCs) present on the GPU. |
|
|
Total number of Texture Processing Clusters (TPCs) across all Graphics Processing Clusters (GPCs). |
|
|
Total number of Streaming Multiprocessors (SMs) available on the GPU. |
|
|
Number of Streaming Multiprocessors (SMs) contained within each Texture Processing Cluster (TPC). |
|
|
Total number of programmable GPU processing cores (CUDA cores) available on the GPU. |
|
|
Number of GPU processing cores (CUDA cores) implemented within each Streaming Multiprocessor (SM). |
|
|
Total number of Tensor Cores available on the GPU for accelerating matrix operations used in AI and high-performance computing workloads. |
|
|
Total number of Ray Tracing (RT) Cores available on the GPU for hardware-accelerated ray tracing operations. |
|
|
Total number of Render Output Pipeline (ROP) units responsible for pixel blending, raster operations, and framebuffer writes. |
|
|
Total number of ROP operations that can be performed in parallel by the GPU, reflecting the aggregate pixel output capability of the ROP subsystem. |
GPU Metrics
GPU Metrics events include the gpu_details object, with the same attributes as in GPU Details, and the attribute objects in this section.
GPU Utilization Details
The gpu_utilization_details object includes the following attributes:
|
Attribute |
Description |
|---|---|
|
|
ISO 8601 timestamp (nanosecond precision) indicating when the device utilization metrics were collected. |
|
|
Indicates the type or source of the timestamp (for example, device time, host time, synchronized clock). |
|
|
Boolean flag indicating whether the device utilization metrics are stale or no longer reflect the latest sampling period. |
|
|
Percentage of time the GPU compute and graphics engines were actively processing work during the sampling interval. |
|
|
Percentage of time the GPU memory subsystem was actively servicing memory operations during the sampling interval. |
|
|
Percentage utilization of the NVIDIA hardware video encoder (NVENC) engine during the sampling interval. |
|
|
Duration of the sampling interval for NVENC utilization metrics, in microseconds. |
|
|
Percentage utilization of the NVIDIA hardware video decoder (NVDEC) engine during the sampling interval. |
|
|
Duration of the sampling interval for NVDEC utilization metrics, in microseconds. |
|
|
Percentage utilization of the NVIDIA JPEG (NVJPG) hardware acceleration engine during the sampling interval. |
|
|
Duration of the sampling interval for NVJPG utilization metrics, in microseconds. |
|
|
Percentage utilization of the NVIDIA Optical Flow Accelerator (NVOFA) during the sampling interval. |
|
|
Duration of the sampling interval for NVOFA utilization metrics, in microseconds. |
|
|
ISO 8601 timestamp (nanosecond precision) indicating when the per-process utilization metrics were collected. |
|
|
Indicates the type or source of the per-process utilization timestamp. |
|
|
Boolean flag indicating whether the per-process utilization metrics are stale. |
|
|
An array of per-process GPU utilization samples captured during the reporting interval. |
Each entry in the proc_util_samples array includes the following attributes:
|
Attribute |
Description |
|---|---|
|
|
ISO 8601 timestamp (nanosecond precision) indicating when the individual process utilization sample was recorded. |
|
|
Operating system process identifier (PID) associated with the GPU workload. |
|
|
Identifier of a subprocess or GPU execution context associated with the parent process, if applicable. |
|
|
Percentage of GPU graphics engine utilization attributed to the process during the sampling interval. |
|
|
Percentage of GPU framebuffer (memory subsystem) utilization attributed to the process during the sampling interval. |
|
|
Percentage of NVENC engine utilization attributed to the process during the sampling interval. |
|
|
Percentage of NVDEC engine utilization attributed to the process during the sampling interval. |
|
|
Percentage of NVJPG engine utilization attributed to the process during the sampling interval. |
|
|
Percentage of NVOFA engine utilization attributed to the process during the sampling interval. |
GPU Clock Details
The gpu_clocks_details object includes the following attributes:
|
Attribute |
Description |
|---|---|
|
|
ISO 8601 timestamp (nanosecond precision) indicating when the GPU clock domain information was collected. |
|
|
Indicates the type or source of the clock domain information timestamp (for example, host time, device time). |
|
|
Boolean flag indicating whether the clock domain information is stale or no longer reflects the current GPU state. |
|
|
Boolean indicating whether GPU clock domain information is supported by the installed driver. |
|
|
Boolean indicating whether clock domain information is currently available from the GPU. |
|
|
Target operating frequency of the GPU graphics clock domain, in megahertz (MHz). |
|
|
Actual operating frequency of the GPU graphics clock domain, in kilohertz (kHz). |
|
|
Target operating frequency of the GPU memory clock domain, in megahertz (MHz). |
|
|
Actual operating frequency of the GPU memory clock domain, in kilohertz (kHz). |
|
|
Target operating frequency of the GPU video engine clock domain, in megahertz (MHz). |
|
|
Actual operating frequency of the GPU video engine clock domain, in kilohertz (kHz). |
|
|
Target operating frequency of the Streaming Multiprocessor (SM) clock domain, in megahertz (MHz). |
|
|
Actual operating frequency of the Streaming Multiprocessor (SM) clock domain, in kilohertz (kHz). |
|
|
ISO 8601 timestamp (nanosecond precision) indicating when the current GPU performance state (P-state) was reported. |
|
|
Indicates the type or source of the performance state timestamp. |
|
|
Boolean flag indicating whether the reported performance state is stale. |
|
|
Raw numeric identifier of the current GPU performance state (P-state) as reported by the driver or firmware. |
|
|
Human-readable label of the current GPU performance state (for example, P0, P2, P8), where lower-numbered states generally represent higher performance. |
|
|
ISO 8601 timestamp (nanosecond precision) indicating when the GPU clock throttling information was collected. |
|
|
Indicates the type or source of the clock throttling information timestamp. |
|
|
Boolean flag indicating whether the clock throttling information is stale. |
|
|
Raw bitmask representing all GPU clock throttling reasons currently reported by the driver or firmware. |
|
|
List of active GPU clock throttling reasons currently limiting clock frequencies (for example, thermal, power, idle, application clocks, synchronization boost). |
|
|
Reference timestamp (ISO 8601, nanosecond precision) used as the baseline for reporting accumulated clock throttling statistics. |
|
|
Bitmask indicating which clock throttling violation-time counters are supported by the GPU and driver. |
GPU Thermal Details
The gpu_thermal_details object includes the following attributes:
|
Attribute |
Description |
|---|---|
|
|
An array of temperature measurements reported by the GPU for one or more monitored temperature sensors. |
|
|
ISO 8601 timestamp (nanosecond precision) indicating when the fan speed information was collected. |
|
|
Indicates the type or source of the fan status timestamp. |
|
|
Boolean flag indicating whether the reported fan status is stale. |
|
|
Rotational speed of each GPU cooling fan, expressed in revolutions per minute (RPM). For GPUs with multiple fans, this field contains the RPM for each individual fan. |
Each entry in the temperature_entries array includes the following attributes:
|
Attribute |
Description |
|---|---|
|
|
Type of temperature sensor associated with the measurement (for example, GPU core, memory, hotspot, board, VRM). |
|
|
Temperature reported by the sensor, expressed in degrees Celsius (°C). |
|
|
Raw temperature value reported by the hardware or firmware before any formatting or unit conversion. |
|
|
ISO 8601 timestamp (nanosecond precision) indicating when the temperature measurement was collected. |
|
|
Indicates the type or source of the temperature measurement timestamp (for example, host time, device time). |
|
|
Boolean flag indicating whether the temperature measurement is stale or no longer reflects the current sensor reading. |
GPU Power Details
The gpu_power_details object includes the following attributes:
|
Attribute |
Description |
|---|---|
|
|
ISO 8601 timestamp (nanosecond precision) indicating when the average power measurements were collected. |
|
|
Indicates the type or source of the average power measurement timestamp (for example, host time, device time). |
|
|
Boolean flag indicating whether the average power measurements are stale. |
|
|
Average power consumed by the GPU silicon during the sampling interval, expressed in milliwatts (mW). |
|
|
Average total power consumed by the GPU module (including GPU and other module components), expressed in milliwatts (mW). |
|
|
Average power consumed by the GPU memory subsystem during the sampling interval, expressed in milliwatts (mW). |
|
|
ISO 8601 timestamp (nanosecond precision) indicating when the instantaneous power measurements were collected. |
|
|
Indicates the type or source of the instantaneous power measurement timestamp. |
|
|
Boolean flag indicating whether the instantaneous power measurements are stale. |
|
|
Instantaneous power consumption of the GPU silicon, expressed in milliwatts (mW). |
|
|
Instantaneous total power consumption of the GPU module, expressed in milliwatts (mW). |
|
|
Instantaneous power consumption of the associated CPU or CPU subsystem, expressed in milliwatts (mW), when supported by the platform. |
|
|
ISO 8601 timestamp (nanosecond precision) indicating when the GPU power limit information was collected. |
|
|
Indicates the type or source of the GPU power limit timestamp. |
|
|
Boolean flag indicating whether the GPU power limit information is stale. |
|
|
Configured (requested) GPU power limit, expressed in milliwatts (mW). |
|
|
Effective GPU power limit currently enforced by the hardware or firmware, expressed in milliwatts (mW). |
|
|
ISO 8601 timestamp (nanosecond precision) indicating when the GPU power policy status was collected. |
|
|
Indicates the type or source of the power policy status timestamp. |
|
|
Boolean flag indicating whether the GPU power policy status is stale. |
|
|
Target GPU power level established by the active power management policy, expressed in milliwatts (mW). |
GPU Memory Details
The gpu_memory_details object includes the following attributes:
|
Attribute |
Description |
|---|---|
|
|
ISO 8601 timestamp (nanosecond precision) indicating when the PMA memory information was collected. |
|
|
Indicates the type or source of the PMA memory information timestamp (for example, host time, device time). |
|
|
Boolean flag indicating whether the PMA memory information is stale. |
|
|
Sequence number associated with the PMA memory information snapshot, used to identify or order successive updates. |
|
|
Total amount of GPU memory managed by the PMA (Physical Memory Allocator), expressed in bytes. |
|
|
Amount of PMA-managed GPU memory currently available for allocation, expressed in bytes. |
|
|
ISO 8601 timestamp (nanosecond precision) indicating when the BAR1 memory information was collected. |
|
|
Indicates the type or source of the BAR1 memory information timestamp. |
|
|
Boolean flag indicating whether the BAR1 memory information is stale. |
|
|
Sequence number associated with the BAR1 memory information snapshot, used to identify or order successive updates. |
|
|
Total size of the GPU BAR1 aperture, expressed in bytes. BAR1 provides CPU access to GPU memory through PCIe address mapping. |
|
|
Amount of BAR1 address space currently available for new memory mappings, expressed in bytes. |
|
|
ISO 8601 timestamp (nanosecond precision) indicating when the memory row remapping information was collected. |
|
|
Indicates the type or source of the memory row remapping timestamp. |
|
|
Boolean flag indicating whether the memory row remapping information is stale. |
|
|
Number of memory banks that have reached the maximum allowable number of remapped memory rows. |
|
|
Number of memory banks with a high utilization of available row remapping capacity. |
|
|
Number of memory banks that have partially utilized their row remapping capacity. |
|
|
Number of memory banks with low row remapping utilization. |
|
|
Number of memory banks with no remapped memory rows. |
|
|
Total number of memory rows remapped due to correctable memory errors. |
|
|
Total number of memory rows remapped due to uncorrectable memory errors. |
|
|
Number of remapped rows associated with correctable errors that are currently inactive or not in use. |
|
|
Number of remapped rows associated with uncorrectable errors that are currently inactive or not in use. |
|
|
Boolean indicating whether one or more memory row remapping operations are pending and require a future reset or maintenance event to take effect. |
|
|
Boolean indicating whether the GPU has experienced a memory row remapping failure, indicating that one or more faulty memory rows could not be successfully remapped. |
Use the following information to interpret these metrics:
-
PMA (Physical Memory Allocator) metrics describe the internal physical memory allocation state of the GPU.
-
BAR1 metrics describe the PCIe Base Address Register (BAR1) aperture that the CPU uses to map and directly access GPU memory.
-
Memory row remapping metrics indicate GPU memory health and reliability. NVIDIA GPUs transparently remap failing DRAM rows to spare rows to maintain correct operation. These counters help identify degrading memory devices before they become critical.
GPU ECC Details
The gpu_ecc_details object includes the following attributes:
|
Attribute |
Description |
|---|---|
|
|
ISO 8601 timestamp (nanosecond precision) indicating when the ECC memory statistics were collected. |
|
|
Indicates the type or source of the ECC statistics timestamp (for example, host time, device time). |
|
|
Boolean flag indicating whether the ECC statistics are stale. |
|
|
Total number of corrected ECC errors recorded since the last driver initialization or system reboot (volatile count). |
|
|
Lifetime cumulative number of corrected ECC errors retained across resets (aggregate count). |
|
|
Total number of uncorrected ECC errors recorded since the last driver initialization or system reboot (volatile count). |
|
|
Lifetime cumulative number of uncorrected ECC errors retained across resets (aggregate count). |
|
|
Volatile count of corrected ECC errors detected in GPU DRAM. |
|
|
Lifetime cumulative count of corrected ECC errors detected in GPU DRAM. |
|
|
Volatile count of uncorrected ECC errors detected in GPU DRAM. |
|
|
Lifetime cumulative count of uncorrected ECC errors detected in GPU DRAM. |
|
|
Volatile count of corrected ECC errors detected in GPU SRAM structures. |
|
|
Lifetime cumulative count of corrected ECC errors detected in GPU SRAM structures. |
|
|
Volatile count of uncorrected ECC errors detected in GPU SRAM structures. |
|
|
Lifetime cumulative count of uncorrected ECC errors detected in GPU SRAM structures. |
|
|
Number of unique corrected SRAM ECC error locations detected since the last reset (volatile). |
|
|
Number of unique uncorrected SRAM parity error locations detected since the last reset (volatile). |
|
|
Number of unique uncorrected SRAM SECDED (Single Error Correction, Double Error Detection) error locations detected since the last reset (volatile). |
|
|
Total number of corrected DRAM ECC errors detected since the last reset (volatile). |
|
|
Total number of uncorrected DRAM ECC errors detected since the last reset (volatile). |
|
|
Number of unique uncorrected SRAM parity errors reported by the client ECC interface. |
|
|
Number of unique uncorrected SRAM SECDED errors reported by the client ECC interface. |
|
|
Number of unique corrected SRAM ECC error locations reported by the client ECC interface. |
|
|
Total number of uncorrected DRAM ECC errors reported by the client ECC interface. |
|
|
Total number of corrected DRAM ECC errors reported by the client ECC interface. |
|
|
ISO 8601 timestamp (nanosecond precision) indicating when the client ECC counters were last cleared. |
|
|
Boolean indicating whether the configured threshold for SRAM ECC errors has been exceeded. |
|
|
Number of SRAM ECC errors attributed to the GPU L2 cache subsystem. |
|
|
Number of SRAM ECC errors attributed to Streaming Multiprocessor (SM) SRAM structures. |
|
|
Number of SRAM ECC errors attributed to the PCIe interface or associated SRAM resources. |
|
|
Number of SRAM ECC errors attributed to firmware-managed SRAM resources. |
|
|
Number of SRAM ECC errors attributed to SRAM resources not covered by the predefined categories. |
|
|
ISO 8601 timestamp (nanosecond precision) indicating when the shadow error containment status was collected. |
|
|
Indicates the type or source of the shadow error containment timestamp. |
|
|
Boolean flag indicating whether the shadow error containment information is stale. |
|
|
Sequence number associated with the shadow error containment status snapshot. |
|
|
Current shadow error containment status or value reported by the GPU, indicating whether error containment mechanisms have been triggered or are active. |
Use the following information to interpret these metrics:
-
Volatile counters reset when the GPU driver reloads or the system reboots.
-
Aggregate counters are lifetime cumulative error counts that the GPU maintains.
-
The hardware automatically repairs corrected ECC errors, which generally do not interrupt execution.
-
Uncorrected ECC errors cannot be repaired automatically and might cause application termination, page retirement, or GPU recovery actions.
-
SECDED (Single Error Correction, Double Error Detection) is the ECC algorithm commonly used in NVIDIA GPU memories.
-
Shadow error containment metrics report the status of hardware mechanisms that isolate or contain errors to prevent them from propagating through the GPU.
GPU PCIe Details
The gpu_pcie_details object includes the following attributes:
|
Attribute |
Description |
|---|---|
|
|
ISO 8601 timestamp (nanosecond precision) indicating when the PCIe bus information was collected. |
|
|
Indicates the type or source of the PCIe bus information timestamp (for example, host time, device time). |
|
|
Boolean flag indicating whether the PCIe bus information is stale or no longer reflects the current hardware state. |
|
|
Current negotiated PCI Express (PCIe) link generation (for example, Gen3, Gen4, Gen5) at which the GPU is operating. |
|
|
Maximum PCIe generation supported by the current PCIe link, as determined by the platform and link capabilities. |
|
|
Maximum PCIe generation supported by the GPU hardware. |
|
|
Number of PCIe link speed changes or retraining events that have occurred since system initialization or the last counter reset. |
|
|
Maximum supported PCIe link data rate for the current connection, expressed as a PCIe generation or transfer rate (GT/s). |
|
|
Maximum negotiated PCIe link width (number of active PCIe lanes), such as x8 or x16. |
|
|
Current PCIe Active State Power Management (ASPM) configuration or status (for example, Disabled, L0s, L1, L1.1, L1.2). |
|
|
Raw value of the PCIe configuration or capability register containing low-level PCIe link configuration information. |
GPU Graphics Details
The gpu_graphics_details object includes the following attributes:
|
Attribute |
Description |
|---|---|
|
|
ISO 8601 timestamp (nanosecond precision) indicating when the GPU graphics (GR) information was collected. |
|
|
Indicates the type or source of the graphics information timestamp (for example, host time, device time). |
|
|
Boolean flag indicating whether the graphics information is stale or no longer reflects the current GPU state. |
|
|
Boolean indicating whether GPU graphics context-switch (CTXSW) logging is enabled. When enabled, the GPU records context-switch events for debugging, profiling, or diagnostic purposes. |
GPU Topology
GPU Topology events include the attribute objects in this section.
GPU Topology Details
The gpu_topology_details object includes the following attributes:
|
Attribute |
Description |
|---|---|
|
|
Boolean indicating whether the GPU supports and has one or more NVIDIA NVLink connections available for high-speed interconnect with other GPUs or NVLink-enabled devices. |
|
|
Total number of GPUs detected in the system. |
|
|
Total number of network interface controllers (NICs) detected in the system that are available for topology or affinity reporting. |
|
|
Total number of NVMe storage devices detected in the system. |
|
|
Number of NIC devices omitted from the reported results because the maximum supported reporting limit was exceeded. |
|
|
Number of NVMe storage devices omitted from the reported results because the maximum supported reporting limit was exceeded. |
GPU Topology Device Entries
The gpu_topology_device_entries object is an array. Each device type includes a different set of attributes, as listed in the Device Type column:
|
Attribute |
Device Type |
Description |
|---|---|---|
|
|
All |
Human-readable label assigned to the device for identification and inventory purposes. |
|
|
All |
Type or category of the device (for example, GPU, NIC, NVMe storage, DPU). |
|
|
All |
PCI Bus ID of the device in the format |
|
|
GPU |
Universally unique identifier (UUID) assigned to the GPU, providing a persistent identifier across system reboots and driver reloads. |
|
|
NIC |
InfiniBand device name assigned by the operating system (for example, |
|
|
NIC |
Collection of alternate names or aliases associated with the network interface, including operating system or management identifiers. |
|
|
NIC |
Operating system network interface name (for example, |
|
|
NIC |
PCI slot designation of the network interface card (NIC), identifying its physical or logical installation location in the system. |
|
|
NVMe |
Operating system name of the NVMe namespace or block device (for example, |
GPU Topology Matrix Entries
The gpu_topology_matrix_entries object is an array. Each entry describes the connectivity between two GPUs, or between a GPU and another system device, and includes the following attributes:
|
Attribute |
Description |
|---|---|
|
|
Label identifying the source GPU or device represented by the row in a GPU topology or connectivity matrix. |
|
|
Label identifying the destination GPU or device represented by the column in a GPU topology or connectivity matrix. |
|
|
Classification of the communication path between the devices identified by the row and column labels (for example, NVLink, NVSwitch, PCIe, same board, same NUMA node, system interconnect), indicating the type and relative performance of the connection. |
GPU Topology Affinity Entries
The gpu_topology_affinity_entries object is an array. Each entry includes the following attributes:
|
Attribute |
Description |
|---|---|
|
|
Human-readable label assigned to the GPU device for identification in the system, for example, |
|
|
CPU cores or CPU affinity mask that are topologically closest to the GPU and recommended for scheduling GPU-related workloads. Identifies the processor cores with the best communication path to the GPU, which is useful for optimizing application thread placement. |
|
|
NUMA nodes to which the GPU is most closely connected, indicating the preferred locality for CPU memory allocations and execution. |
|
|
Identifier of the CPU NUMA node with the lowest-latency connection to the GPU. |
|
|
NUMA node identifier assigned to the GPU when the GPU exposes memory as a NUMA node (for example, on systems that support GPU NUMA or HMM). Platform-dependent; typically available on systems that expose GPU memory through NUMA-aware operating system mechanisms. |
|
|
NUMA node associated with the GPU's PCIe root complex or PCIe attachment point, indicating the GPU's PCIe locality within the system topology. |
Kernel Module Attributes
Kernel module information is reported in the kernel_module_details object:
|
Attribute |
Description |
|---|---|
|
|
Name of the loaded kernel module as registered with the Linux kernel. |
|
|
Size of the loaded kernel module in memory, expressed in bytes. |
|
|
Current operational state of the kernel module (for example, loaded, live, unloading). |
|
|
Kernel virtual memory address at which the module is loaded. |
|
|
Configurable parameters exposed by the kernel module, with their current values. Generally corresponds to the configurable options under |
|
|
Kernel modules or kernel subsystems that depend on or currently reference this module, including the module reference count when available. Similar to the dependency information that tools such as |
|
|
Kernel taint flags associated with the module, indicating conditions such as proprietary licensing, forced loading, unsupported configuration, or detected runtime issues. Corresponds to the Linux kernel taint mechanism ( |
|
|
Origin of the kernel module, such as the file system path, package, or provider from which the module was loaded. |
TCP Network Connection Attributes
TCP network connection information is reported in the network_connection_details object:
|
Attribute |
Description |
|---|---|
|
|
The unique identifier of the file descriptor associated with the socket. |
|
|
The TCP connection state. |
|
|
The network protocol. |
|
|
Defines the protocol suite and address structure that a socket or network interface uses to communicate. Tells the Linux kernel how to interpret IP addresses, manage routing tables, and format network packets at Layer 3 (network layer) and below. Added in DOCA Argus 3.5.2. |
|
|
The IP address that, together with |
|
|
The port that, together with |
|
|
The IP address that, together with |
|
|
The port that, together with |
|
|
The amount of data received, in bytes. |
|
|
The amount of data sent, in bytes. |
|
|
The number of TCP segments received. |
|
|
The number of TCP segments sent. |
|
|
The interface name. |
|
|
The interface MAC address. |
|
|
The IPv4 addresses associated with the interface. |
|
|
The IPv6 addresses associated with the interface. |
|
|
The time when the TCP connection was observed, in ISO 8601 format with nanosecond precision. |
|
|
The calculated overall duration of the TCP connection, in nanoseconds. |
|
|
The average size of the received packets, in bytes. |
|
|
The average size of the sent packets, in bytes. |
Process Attributes
Process information is reported in the process_details object:
|
Attribute |
Description |
|---|---|
|
|
The process's unique identifier. |
|
|
The full path of the executed process, including the folder and the process filename. |
|
|
The name of the executed binary. |
|
|
Thread-group change indicator. For example, this value increases on |
|
|
The parent process's unique identifier. |
|
|
The number of CPU cycles consumed by the process. |
|
|
The real group identifier of the process owner. |
|
|
The real user identifier of the process owner. |
|
|
The effective group identifier of the process owner. |
|
|
The effective user identifier of the process owner. |
|
|
The command-line arguments used to launch the process. |
|
|
The process creation time, in ISO 8601 format with nanosecond precision. |
|
|
The current state of the process. |
|
|
The namespace for the process identifiers. |
|
|
The namespace for the mount points. |
|
|
The namespace for the network resources. |
|
|
The SHA-256 hash of the process's executed binary. |
|
|
The SHA-1 hash of the process's executed binary. |
|
|
The MD5 hash of the process's executed binary. |
|
|
The size of the process's executed binary, in bytes. |
|
|
The folder from which the process was executed. |
|
|
The container identifier, if the process is part of a container. |
Process Memory Attributes
Process memory information is reported in the process_memory_details object:
|
Attribute |
Description |
|---|---|
|
|
The associated process's unique identifier. |
|
|
The start address of the virtual memory area. |
|
|
The end address of the virtual memory area. |
|
|
The permissions associated with the virtual memory area. |
|
|
Indicates whether the virtual memory area belongs to the executed binary of the current process (the main executable). |
|
|
The path, including the filename, of the file associated with the virtual memory area. |
|
|
The filename associated with the virtual memory area. |
Runtime Manifest Attributes
Runtime manifest, software bill of materials (SBOM), and process attestation information is reported in the process_attestation_details object:
|
Attribute |
Description |
|---|---|
|
|
The inode number of the ELF file. |
|
|
The name of the ELF file. |
|
|
The folder path where the ELF file is located. Changed in DOCA Argus 3.5. |
|
|
The SHA-256 hash value of the ELF file. |
|
|
The SHA-1 hash value of the ELF file. |
|
|
The size of the ELF file, in bytes. |
|
|
Indicates whether this file is the executed binary of the current process (the main executable). |
|
|
The ELF file type. |
|
|
The MD5 hash value of the ELF file. |
Expected Behavior Attributes
The Binary Executed Not as Intended, Foreign Binary Executed File Size Mismatch, and Foreign Library Loaded File Size Mismatch alerts also include the expected_behavior object:
|
Attribute |
Description |
|---|---|
|
|
The SHA-256 hash of the executed binary or loaded library. |
|
|
The command-line arguments used to launch the process. |
|
|
The folder that contains the executed process or library. |
|
|
The name of the process or library. |
|
|
The size of the executable binary or library, in bytes. |
Thread Attributes
Thread information is reported in the thread_details object:
|
Attribute |
Description |
|---|---|
|
|
The unique thread identifier. |
|
|
Thread-group change indicator. For example, this value increases on |
|
|
The thread's exit state. |
Last updated: