This guide provides an example of an OpenTelemetry implementation on top of NVIDIA® BlueField® DPU or NVIDIA® ConnectX® NIC.
Introduction
The DOCA Telemetry OpenTelemetry reference application demonstrates how to directly link DOCA Telemetry libraries with the open-source OpenTelemetry SDK to export hardware metrics.
The application utilizes the DOCA Telemetry Diag library to periodically extract "on-demand" statistics from an NVIDIA® BlueField® DPU or ConnectX® NIC. These statistics are packaged as OpenTelemetry Protocol (OTLP) metrics and exported via HTTP.
While this reference application focuses strictly on exporting OpenTelemetry metrics, the underlying architecture can be adapted to handle other OpenTelemetry formats (such as traces and logs) or to support alternative DOCA Telemetry libraries for statistic generation.
System Design
The doca_telemetry_opentelemetry application is designed to operate as a data exporter within a broader telemetry infrastructure.
For example, a full implementation may look as follows:
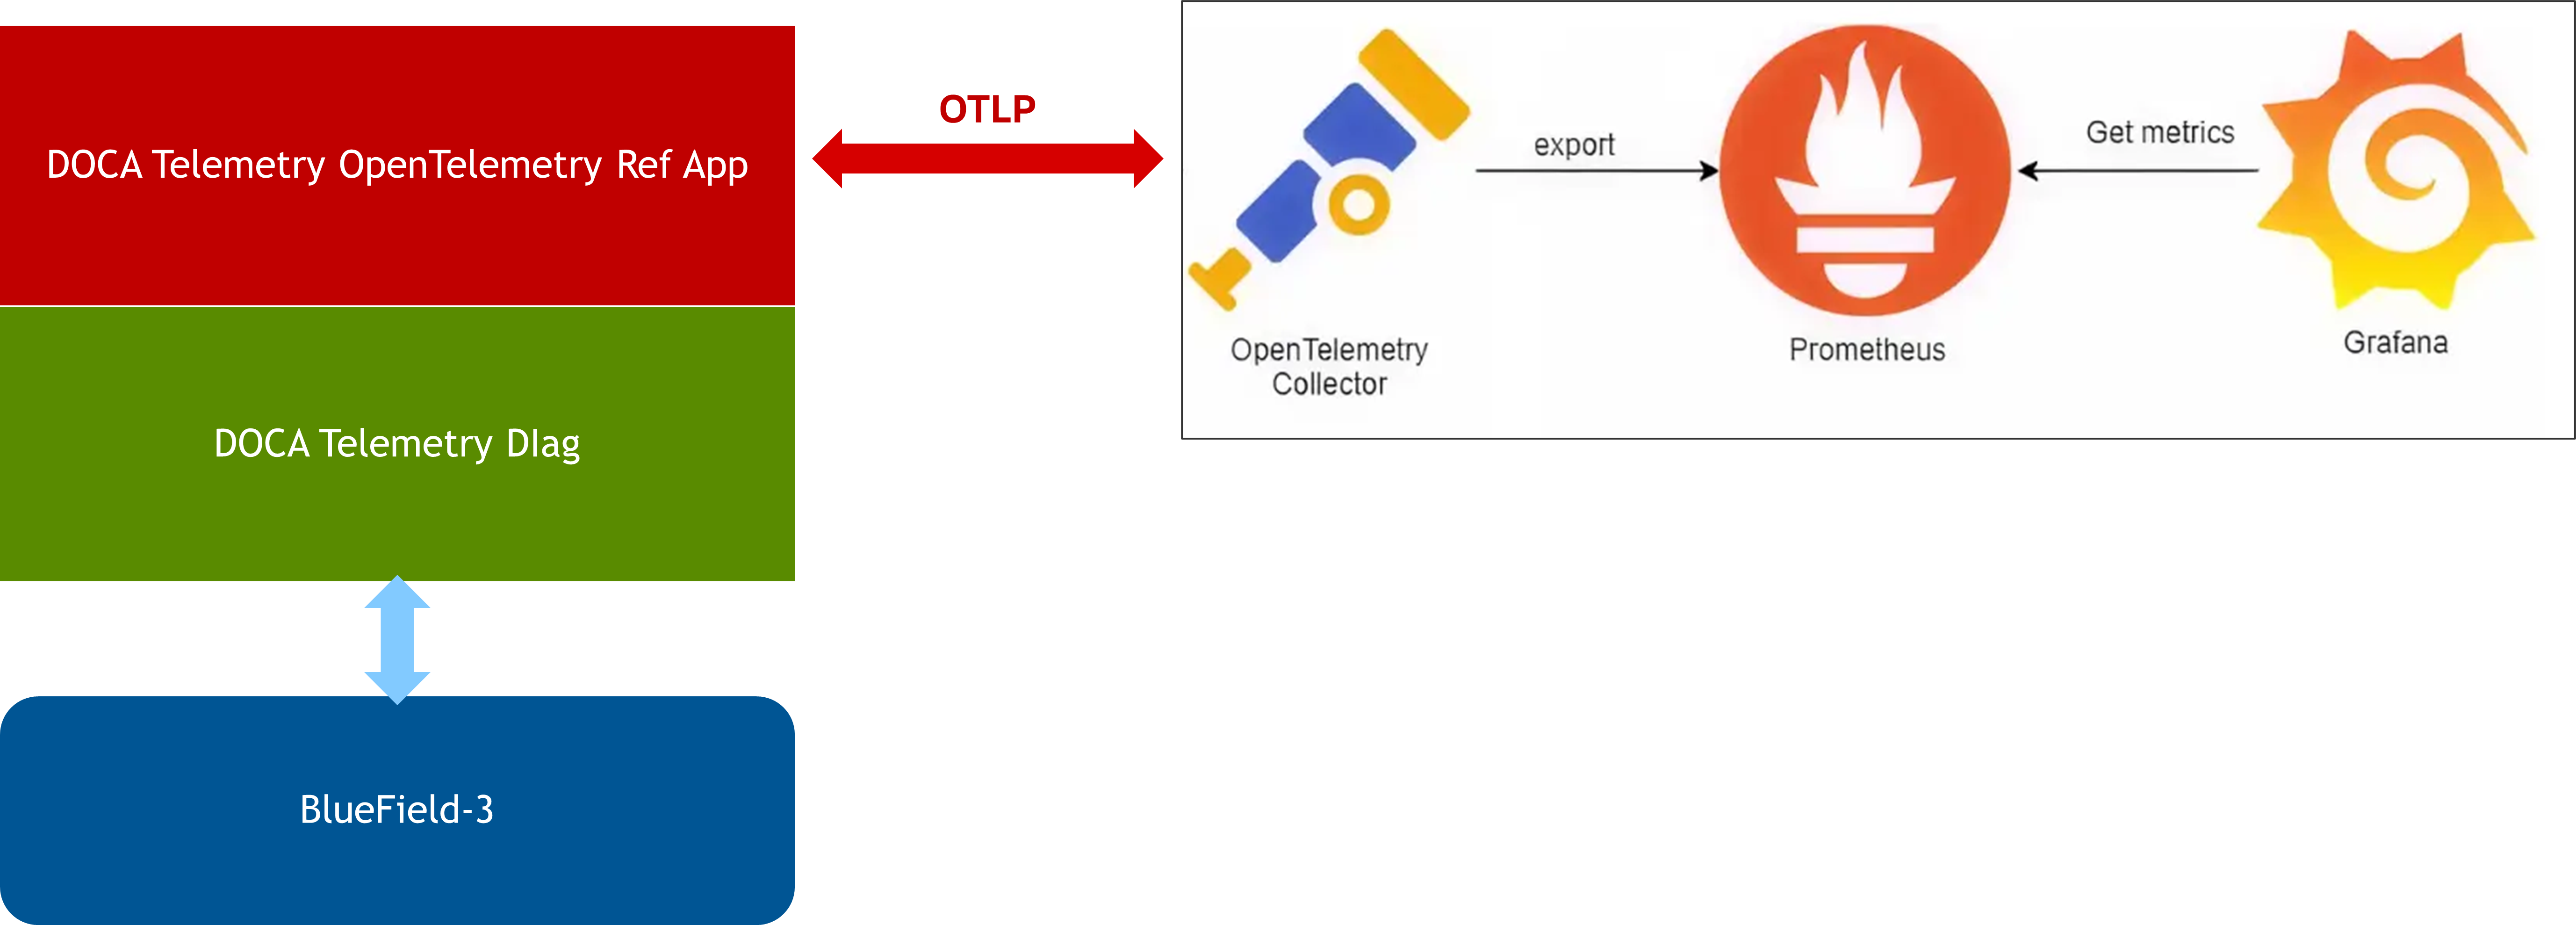
In a standard deployment pipeline:
|
|
Stage |
Details |
|---|---|---|
|
1 |
Data extraction |
The application pulls telemetry data from the DPU/NIC via the DOCA Telemetry Diag library. |
|
2 |
Export |
The data is exported via HTTP to an OpenTelemetry Collector. |
|
3 |
Translation and storage |
The Collector converts the OTLP data into a format suitable for a time-series database (e.g., Prometheus). |
|
4 |
Visualization |
An external dashboard (e.g., Grafana) queries the database to display and analyze the metrics. |
OTLP is fundamentally vendor-agnostic. While Prometheus and Grafana are cited in this reference design, administrators can route the generated OTLP statistics to any compatible backend service. Data routing and backend storage management are strictly out of scope for this application.
Application Architecture
The application periodically polls the underlying device "on demand," meaning a single sample of the specified data_ids is captured during each polling cycle. The application calculates the deltas for each data_id, packages them as OpenTelemetry metrics, and exports them to a designated IP address at a user-defined interval.
Supported Diag Data IDs
The application currently supports 15 DOCA Diag data_id types. Administrators can modify and apply each ID multiple times to collect metrics across different contexts (e.g. polling data from different physical ports).
For data_id bitmask variables, XX represents the local port, and Y represents the local port priority.
|
Name |
Description |
Data ID |
|---|---|---|
|
|
The number of received bytes on the physical port |
|
|
|
The number of received bytes on the physical port and priority |
|
|
|
The number of received packets on the physical port |
|
|
|
The number of received packets on the physical port and priority |
|
|
|
The number of received packets dropped due to lack of buffers on a physical port |
|
|
|
The number of link-layer pause packets received on a physical port and priority |
|
|
|
The number of RoCEv2 packets received by the notification point marked as experiencing congestion |
|
|
|
The number of CNP received packets handled by the Reaction Point, per port |
|
|
|
The number of CNP packets sent by the Notification Point, per port |
|
|
|
The number of QP de-scheduled due to congestion control rate limitation |
|
|
|
The number of transmitted bytes on the physical port (excluding loopback traffic) |
|
|
|
The number of transmitted bytes on the physical port and priority (excluding loopback traffic) |
|
|
|
The number of transmitted packets on the physical port (excluding loopback traffic) |
|
|
|
The number of transmitted packets on the physical port and priority (excluding loopback traffic) |
|
|
|
The number of link-layer pause packets transmitted on a physical port and priority |
|
OpenTelemetry Labelling
Every exported counter metric is tagged with the following contextual labels (where applicable), enabling backend applications to accurately filter and process the telemetry data:
|
Label Key |
Description |
|---|---|
|
|
The exact Diag |
|
|
A human-readable description of the Diag |
|
|
The measurement unit (e.g., Packets, Bytes, or Events). This may be implicitly included in the metric name. |
|
|
The hostname of the server executing the OpenTelemetry application |
|
|
The PCIe address of the target NIC/DPU on the host |
|
|
The traffic direction updating the counter ( |
|
|
The specific port number associated with the metric |
|
|
The specific priority number associated with the metric |
Libraries
DOCA Libraries
This application leverages the following DOCA libraries:
Refer to its official programming guide for extended capability details.
OpenTelemetry C++ SDK
The DOCA Telemetry OpenTelemetry application relies on the C++ OpenTelemetry-SDK. Administrators must install this SDK on the target system before the DOCA application can be compiled.
-
Ensure the necessary compilation tools (
cmake,curl, etc.) are present on the system:# For Ubuntu/Debian: $ sudo apt-get install -y git cmake g++ libcurl4-openssl-dev # For RHEL/CentOS: $ sudo yum install -y git cmake gcc-c++ libcurl-devel
-
Clone the OpenTelemetry repository and compile it using the specific CMake flags required by the DOCA reference application.
$ git clone https://github.com/open-telemetry/opentelemetry-cpp.git
$ cd opentelemetry-cpp/
$ mkdir build && cd build
$ cmake .. -DCMAKE_BUILD_TYPE=Release -DWITH_OTLP_HTTP=ON -DWITH_HTTP_CLIENT_CURL=ON
$ cmake --build . --config Release -- -j$(nproc)
$ sudo cmake --install . --prefix /usr
CMake Installation Path
The DOCA Meson build file strictly expects the
opentelemetry-cppCMake configuration to reside at/usr/lib/cmake/opentelemetry-cpp. If you choose to install the SDK in a custom directory (by altering thecmake --install --prefixpath), you must manually update the Meson build file and yourLD_LIBRARY_PATHto reflect the new location.
Compiling the Application
Please refer to the DOCA Installation Guide for Linux for details on how to install BlueField-related software.
DOCA reference applications are installed with full source code and build instructions. This allows you to compile them as-is or modify the source code to create custom versions.
For more information about the applications as well as development and compilation tips, refer to the DOCA Reference Applications page.
The source code for this application is located at:
/opt/mellanox/doca/applications/telemetry/opentelemetry/
Compiling All Applications
By default, the DOCA Meson project is configured to build every reference application simultaneously.
cd /opt/mellanox/doca/applications/
meson /tmp/build
ninja -C /tmp/build
The compiled binaries will be generated in /tmp/build/telemetry/.
Compiling Only the Current Application
To significantly reduce build times, administrators can configure Meson to isolate and compile only the Telemetry OpenTelemetry application. This can be achieved via CLI flags or by modifying the configuration file.
Option 1: Command Line Configuration
Append the following flags to the meson setup command to disable all other applications and explicitly enable OpenTelemetry:
$ cd /opt/mellanox/doca/applications/
$ meson /tmp/build -Denable_all_applications=false -Denable_telemetry=true -Denable_telemetry_opentelemetry=true -Denable_telemetry_traceback=false
$ ninja -C /tmp/build
Option 2: Configuration File
You can persistently isolate the build by editing the meson_options.txt file directly.
-
Open
/opt/mellanox/doca/applications/meson_options.txtand set the following parameters:
enable_all_applications = falseenable_telemetry = trueenable_telemetry_opentelemetry = trueenable_telemetry_traceback = false Configuration RuleIf enable_all_applications is set to false, the main enable_telemetry flag must be set to true for any underlying telemetry application to compile successfully. The individual applications default to true, but you can toggle them on or off as needed once the master telemetry flag is enabled. -
Once the file is saved, run the standard compilation commands:
$ cd /opt/mellanox/doca/applications/
$ meson /tmp/build
$ ninja -C /tmp/build
Running the Application
Application Execution
The DOCA Telemetry OpenTelemetry application is distributed as source code and must be compiled prior to execution.
Execution syntax:
$ doca_telemetry_opentelemetry [DOCA Flags] [Program Flags]
Execution example:
$ sudo ./doca_telemetry_opentelemetry -p 03:00.0
The application strictly requires sudo (root privileges) to access hardware-level telemetry data on the device.
Ensure the -p parameter (e.g., 03:00.0) exactly matches the physical PCIe address of your target device.
Command Line Flags
General Flags
|
Short Flag |
Long Flag |
Description |
|---|---|---|
|
|
|
Prints a help synopsis and exits |
|
|
|
Prints program version information and exits |
|
|
|
Sets the numeric log level for the application:
|
|
N/A |
|
Sets the SDK numeric log level using the same 10-70 scale as above |
|
N/A |
|
Filters logs from specific modules (comma-separated list) |
|
|
|
Parses command-line flags from a specified input JSON file |
Refer to DOCA Arg Parser for more information regarding the supported flags and execution modes.
Program Flags
|
Short Flag |
Long Flag |
Description |
|---|---|---|
|
|
|
Mandatory flag. The exact PCIe address of the device to read telemetry information from. |
|
|
|
A specific DOCA Diag |
|
|
|
The path to a file containing a list of |
|
|
|
The IPv4 address of the target OpenTelemetry server. Data is sent via HTTP POST to the OTLP default port |
|
|
|
The polling interval in milliseconds between each HTTP export. Defaults to |
|
|
|
Runs the application in verbose mode, printing telemetry counters as DOCA logs in addition to exporting them. |
If no -d flags or -f file are provided, the application automatically defaults to monitoring all supported DOCA Diag data_ids with ports and priorities set to 0.
It is not guaranteed that all data_ids supported by the application are supported by your specific hardware. The application will report any unsupported IDs, requiring administrators to adjust their inputs accordingly.
Troubleshooting
Refer to the NVIDIA BlueField Platform Software Troubleshooting Guide for any issue encountered with the compilation, installation, or execution of the DOCA applications.
Application Code Flow
Phase 1: Argument Parsing
The application begins by configuring the DOCA argument parser and consuming the user's CLI flags.
-
doca_argp_init(): Initializes the argument parser resources and registers standard DOCA parameters. -
register_opentelemetry_params(): Registers the application-specific OpenTelemetry parameters (e.g., IP address, polling time). -
doca_argp_start(): Executes the parser against the provided inputs.
Phase 2: OpenTelemetry Initialization
The application establishes the connection to the hardware and provisions the OpenTelemetry metric pipelines.
-
opentelemetry_init(): Initializes the core application.-
Opens the specified DOCA device for Diag Telemetry processing.
-
Verifies hardware compatibility: checks support for DOCA Telemetry Diag, confirms it can handle the requested number of
data_ids, and ensures it supportson_demandprocessing. -
Configures the Diag Context: sets the sample mode to
on_demand, configures the output format (FORMAT_0), applies requiredno_syncoptions, and loads the targetdata_ids.
-
-
opentel_metrics_init(): Initializes the OpenTelemetry metrics framework.-
Creates resource attributes identifying the DOCA reference application as the data source.
-
Configures the OTLP exporter and reader based on the target IP and export interval.
-
Registers a global Meter Provider so all subsequently created counters inherit this configuration.
-
-
opentel_counter_init(): Initializes the specific metrics counters.-
For each
data_idapplied to the Diag Context, it creates an OpenTelemetry 64-bit counter and compiles the corresponding label information (name, unit, port, etc.).
-
Phase 3: Main Execution Loop
The application enters its primary monitoring state, continuously polling and exporting data.
-
opentelemetry_run(): Triggers the execution loop.-
Starts the DOCA Diag context to begin hardware sampling.
-
Enters a continuous loop (until interrupted by
CTRL+C):-
Queries the Diag context for
on_demandcounter data. -
Iterates through each returned
data_id, creating a new label instance and updating the associated OpenTelemetry counter with the calculated delta. -
Sleeps for half the configured export time to ensure fresh data is available for the background OTLP export thread.
-
-
Stops the DOCA Diag context upon loop termination.
-
Phase 4: Teardown and Cleanup
The application safely releases all hardware and software resources.
-
opentelemetry_destroy(): Destroys the core application objects.-
Destroys the DOCA Diag context.
-
Closes the connection to the DOCA device.
-
-
doca_argp_destroy(): Destroys the argument parser resources.
OpenTelemetry SDK objects are automatically destroyed when they fall out of scope and do not require manual destruction.
References
-
/opt/mellanox/doca/applications/telemetry/opentelemetry/
Last updated: