Introduction
The DOCA Telemetry Traceback application provides a framework for monitoring telemetry data to identify long-term trends locally on the device. Because funneling massive volumes of raw telemetry data to a centralized data store can overwhelm network resources at a data-center scale, this application processes data directly on the NVIDIA® BlueField® DPU or NVIDIA® ConnectX® NIC.
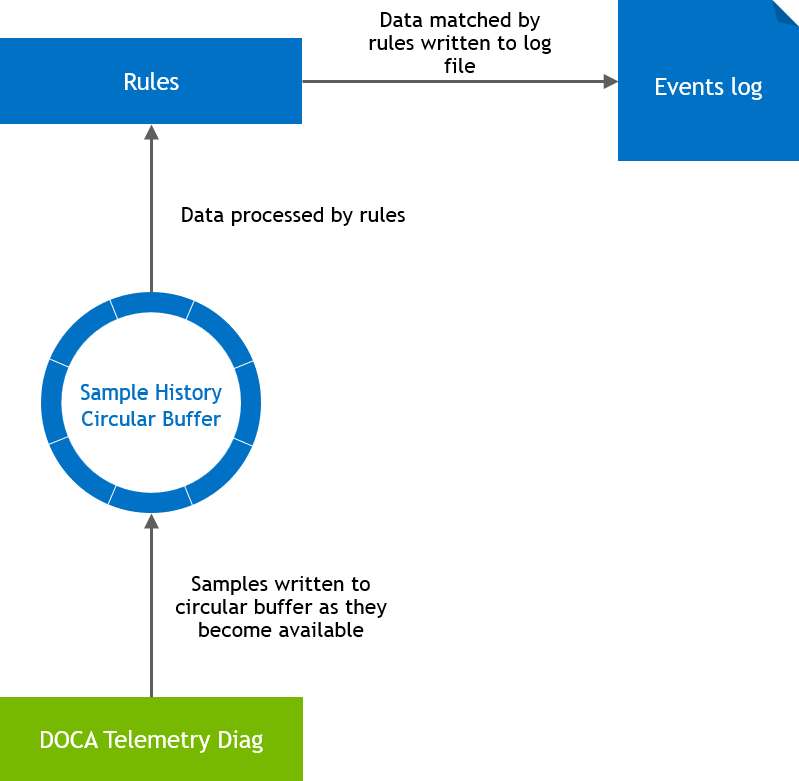
The application gathers telemetry data into a circular buffer, retaining the last N samples from the device. This historical data is continuously evaluated against user-defined rules to detect specific "events" (anomalies or notable threshold breaches). When an event triggers, the application writes the preceding historical data and all subsequent active event data to a log file.
The included rules are purposefully simplistic, as this application is intended to serve as a reference traceback model rather than a fully featured data processing engine
System Design
The doca_telemetry_traceback application is a standalone application which runs on top of a NVIDIA® BlueField® DPU or NVIDIA® ConnectX® NIC.
Application Architecture
The doca_telemetry_traceback application is a standalone service composed of four primary components:
-
DOCA Telemetry Diag (
doca_telemetry_diag) instance – The underlying data provider. This instance is configured using parameters from the application's JSON configuration file (e.g., sample period, data IDs) alongside hardcoded application values. -
Sample history circular buffer (
samples_circular_buffer) – A contiguous block of memory that stores the telemetry samples. Each record is stored astimestamp, data_id[0], ... data_id[N]. To ensure there is an equal amount of historical data and active event data, the buffer size is automatically doubled based on the user's requested depth. -
Rule (
rule) collection – A set of logical monitors. Each rule monitors a specificdata_idagainst defined logic. When the logic conditions are met, an "event start" is triggered. The rule remains active until new data arrives that no longer meets the conditions, triggering an "event end". -
Events log file – The output destination for event data. Upon execution, the application logs its configuration to ensure absolute certainty regarding the parameters that triggered an event. When an event starts, the log captures the available history, an "event started" marker, all data collected during the event, and an "event end" marker.
If multiple events activate simultaneously, individual begin/end rows are inserted to track their respective lifecycles. Data logging pauses once all events conclude and resumes upon the next activation.
Traceback Configuration File
The application retrieves its operational parameters from a JSON configuration file.
Example configuration:
{
  "diag_sample_period_ns": 100000,
  "sample_history_depth": 10000,
  "data-ids": [
    {
      "name": "port_0_rx_bytes",
      "data_id": "0x1020000100000000"
    }
  ],
  "rules": [
    {
      "name": "Rx Bytes/s > 1MeBs",
      "data_id": "0x1020000100000000",
      "comparison_type": "differential_greater_than",
      "comparison_value": 1048576
    }
  ]
}
|
Field |
Type |
Notes |
|---|---|---|
|
|
Integer |
The sampling interval in nanoseconds. This is passed directly to the diag instance via |
|
|
Integer |
The number of historical records a rule evaluates. The application automatically provisions a circular buffer double this size. |
|
|
Array |
A collection of data ID definitions. |
|
|
String |
A friendly name for the |
|
|
String |
A 16-character hexadecimal value. Format: |
|
|
String |
A collection of rule definitions. |
|
|
String |
A friendly name used to identify the rule in the events log. |
|
|
String |
The 16-character hexadecimal |
|
|
String |
Defines the rule's operational logic. Acceptable values:
See section "DOCA Telemetry Traceback Application | Rule Definitions" for details. |
|
|
Integer |
The numerical threshold utilized when evaluating the rule. See section "DOCA Telemetry Traceback Application | Rule Definitions" for details. |
Rule Definitions
The application supports five distinct rule types. Each rule establishes its own hysteresis logic, defining precisely when an event activates and deactivates.
Incremental Greater Than (inc_gt)
Designed for incrementally increasing values to guarantee triggering each time a value increases by the comparison threshold.
|
Activation Trigger |
Activates if the sampled value exceeds the calculated setpoint (Initial Setpoint = First Sampled Value + |
|---|---|
|
Deactivation Trigger |
Deactivates immediately once any new sampled value exceeds the current setpoint, and a new setpoint is calculated. Rapid data spikes exceeding the setpoint multiple times simultaneously will only activate the rule once. |
Differential Greater Than (dt_gt)
Evaluates the delta between the current sample and an older historical sample. Requires at least sample_history_depth values in the buffer before functioning.
|
Activation Trigger |
Activates if the delta between the newest sample and the sample at |
|---|---|
|
Deactivation Trigger |
Deactivates only after |
Differential Less Than (dt_lt)
Operates using the identical historical delta logic as dt_gt, but activates when the delta is less than the comparison_value.
Greater Than (gt)
Designed strictly for values that can fluctuate (increase and decrease). It is not suitable for metrics that only increment (e.g., total bytes transferred).
|
Activation Trigger |
Activates when the sampled value explicitly exceeds the |
|---|---|
|
Deactivation Trigger |
Deactivates only after |
Less Than (lt)
Operates using the identical fluctuation logic as gt, but activates when the sampled value remains below the comparison_value for the required consecutive depth.
DOCA Libraries
This application leverages the following DOCA libraries:
Refer to its official programming guide for extended capability details.
Compiling the Application
Please refer to the DOCA Installation Guide for Linux for details on how to install BlueField-related software.
DOCA reference applications are installed with full source code and build instructions. This allows you to compile them as-is or modify the source code to create custom versions.
For more information about the applications as well as development and compilation tips, refer to the DOCA Reference Applications page.
The source code for this application is located at:
/opt/mellanox/doca/applications/telemetry/traceback/
Compiling All Applications
By default, the DOCA Meson project is configured to build every reference application simultaneously.
cd /opt/mellanox/doca/applications/
meson /tmp/build
ninja -C /tmp/build
The compiled binaries will be generated in /tmp/build/telemetry/.
Compiling Only the Current Application
To significantly reduce build times, administrators can configure Meson to isolate and compile only the Telemetry Traceback application. This can be achieved via CLI flags or by modifying the configuration file.
Option 1: Command Line Configuration
Append the following flags to the meson setup command to disable all other applications and explicitly enable Traceback:
$ cd /opt/mellanox/doca/applications/
$ meson /tmp/build -Denable_all_applications=false -Denable_telemetry=true -Denable_telemetry_traceback=true
$ ninja -C /tmp/build
Option 2: Configuration File
You can persistently isolate the build by editing the meson_options.txt file directly.
-
Open
/opt/mellanox/doca/applications/meson_options.txtand set the following parameters:
enable_all_applications = falseenable_telemetry = trueenable_telemetry_traceback =trueConfiguration RuleIf enable_all_applications is set to false, the main enable_telemetry flag must be set to true for any underlying telemetry application to compile successfully. The individual applications default to true, but you can toggle them on or off as needed once the main telemetry flag is enabled. -
Once the file is saved, run the standard compilation commands:
$ cd /opt/mellanox/doca/applications/
$ meson /tmp/build
$ ninja -C /tmp/build
Running the Application
Application Execution
The DOCA Telemetry Traceback application is distributed as source code and must be compiled prior to execution.
Execution syntax:
$ doca_telemetry_traceback [DOCA Flags] [Program Flags]
Execution example:
$ sudo doca_telemetry_traceback -d 03:00.0 --rules my_rules_file.json
The application strictly requires sudo (root privileges) to access hardware-level telemetry data on the device.
Ensure the -d parameter (e.g., 03:00.0) exactly matches the physical PCIe address of your target device.
Command Line Flags
General Flags
|
Short Flag |
Long Flag |
Description |
|---|---|---|
|
|
|
Prints a help synopsis and exits |
|
|
|
Prints program version information and exits |
|
|
|
Sets the numeric log level for the application:
|
|
N/A |
|
Sets the SDK numeric log level using the same 10-70 scale as above |
|
N/A |
|
Filters logs from specific modules (comma-separated list) |
|
|
|
Parses command-line flags from a specified input JSON file |
Refer to DOCA Arg Parser for more information regarding the supported flags and execution modes.
Program Flags
|
Short Flag |
Long Flag |
Description |
|---|---|---|
|
|
|
Mandatory flag. The exact PCIe address of the device to read telemetry information from. |
|
|
|
The path to a JSON file containing the application configuration. See section "DOCA Telemetry Traceback Application | Traceback Configuration File". |
|
N/A |
|
Path to output log file which will be populated with events information |
|
N/A |
|
Force ownership of the diag domain. Only applies when the device firmware is in single domain mode. |
It is not guaranteed that all data IDs supported by the application are supported by your specific device. The application will report any unsupported IDs, requiring administrators to adjust their inputs accordingly.
Troubleshooting
Refer to the NVIDIA BlueField Platform Software Troubleshooting Guide for any issue encountered with the compilation, installation, or execution of the DOCA applications.
Application Code Flow
The DOCA Telemetry Traceback application executes in three distinct operational phases: argument parsing, component initialization, and a continuous data polling loop.
Phase 1: Argument Parsing
The application initializes the logger and parses both CLI arguments and JSON configurations to establish its operational parameters.
-
create_doca_logger_backend(): Creates the logger backend to display system messages. -
parse_configuration(): Parses the CLI arguments. Values unique to the application instance are passed via the CLI, while values shared across a multi-server deployment are deferred to the JSON file. -
load_file_into_buffer()andparse_json_configuration(): Loads the shared configuration from the defined JSON file (defaults torules.jsonif not overridden via CLI). -
validate_configuration(): Performs initial validity checks to catch expected configuration errors before allocating hardware resources.
Phase 2: Component Initialization
The application prepares its memory buffers, defines its rule objects, and establishes the connection to the DOCA Telemetry Diag context.
Data and Logging Preparation
-
History buffer: Calls
init_data_aligned_ring()to prepare the main circular data store. The buffer is deliberately sized to double the requested depth, ensuring there is exactly as much history available as there is active data. -
Rule objects: Populates a C++ vector with rule objects.
The rules vector is specifically sized using
reservebecause the correct size is known upfront, allowing it to be sized correctly with a single memory allocation to prevent fragmentation.For each rule, the application calculates an array index (
sample_record_offset) of1 + N. This explicit math is required because the application hardcodes theDOCA_TELEMETRY_DIAG_OUTPUT_FORMAT_1format, which produces a timestamp followed byNvalues. -
Events log: Creates or truncates the
events.logfile usingstd::ofstreamand immediately writes the application configuration to the header vialog_app_start_header().
Hardware and Telemetry Initialization
-
Device open: Identifies and opens the requested DOCA device using
open_doca_dev().The device pointer is stored in a RAII
unique_ptrto guarantee automatic cleanup upon application exit without requiring complexgototrees. -
Context creation: Verifies that the device supports telemetry data (requiring elevated permissions), creates the context via
create_and_prepare_diag_ctx(), and starts the data sampling process withdoca_telemetry_diag_start(). -
Context validation: Calls
doca_telemetry_diag_get_sample_size()anddoca_telemetry_diag_get_sample_period()to confirm the hardware accepted the requested parameters.If the actual sample size or period does not match the requested parameters, the application explicitly stops. While this could be worked around, the codebase relies on these assumptions for simplicity and requires them to be correct.
Phase 3: Main Execution Loop
The application enters a continuous polling state, checking the telemetry instance for new data, updating the circular buffer, and evaluating rule logic.
Setup and Signal Handling
-
Allocates a small read buffer (
sample_buffer) to ingest data from the telemetry instance.Data is read here, evaluated, mutated, and then copied into the history buffer. This decoupled design future-proofs the application, allowing users to read from multiple telemetry sources where the formats between the read buffer and history buffer could differ significantly.
-
Installs a
SIGINTsignal handler allowing administrators to terminate the process cleanly viaCTRL+C.
Datapath Loop
-
Data polling: Calls
doca_telemetry_diag_query_counters(). If no data is available (0 samples), the thread sleeps fordiag_sample_period_nsto prevent CPU exhaustion. Typically, 1 sample is read, though 2+ may be read if the application experiences wake-up latency. -
Sample processing:
-
Casts the read pointer to
doca_telemetry_diag_data_sample_format_1. -
Advances the circular buffer head (
advance_head_idx()) and copies the hardware timestamp and data values into the new history record.Bit manipulation is applied here to accommodate the
DOCA_TELEMETRY_DIAG_TIMESTAMP_SOURCE_RTCformat. -
If any rules are currently active, the sample is immediately written to the events log file.
-
Rule Evaluation and State Changes
Each rule evaluates the new sample using monitor.process_sample().
If a rule does not change state during the processing of this new sample, there is no more work to be done, and the application immediately moves to process the next rule.
|
Rule Activates |
The application increments
All samples read before the rule activated have already been written to the history. Data received while any rule is active is logged strictly before the rules processing step for each sample, continuing until all rules deactivate. |
|---|---|
|
Rule Deactivates |
Decrements |
Because device cleanup is handled via C++ RAII unique_ptr objects, all resources are safely released automatically when the SIGINT signal breaks the execution loop
References
-
/opt/mellanox/doca/applications/telemetry/traceback/
Last updated: