DPF Observability
This section provides observability guidance for DPF, covering monitoring, logging, and health checks across the Host Cluster and DPU clusters.
Introduction
The DPF observability stack consists of two types of components:
-
User-Managed Components: Infrastructure components that the user deploys and manages
-
DPF-Operator-Managed Components: DPF-specific components and exporters that are deployed by default by the DPF operator
Architecture Overview
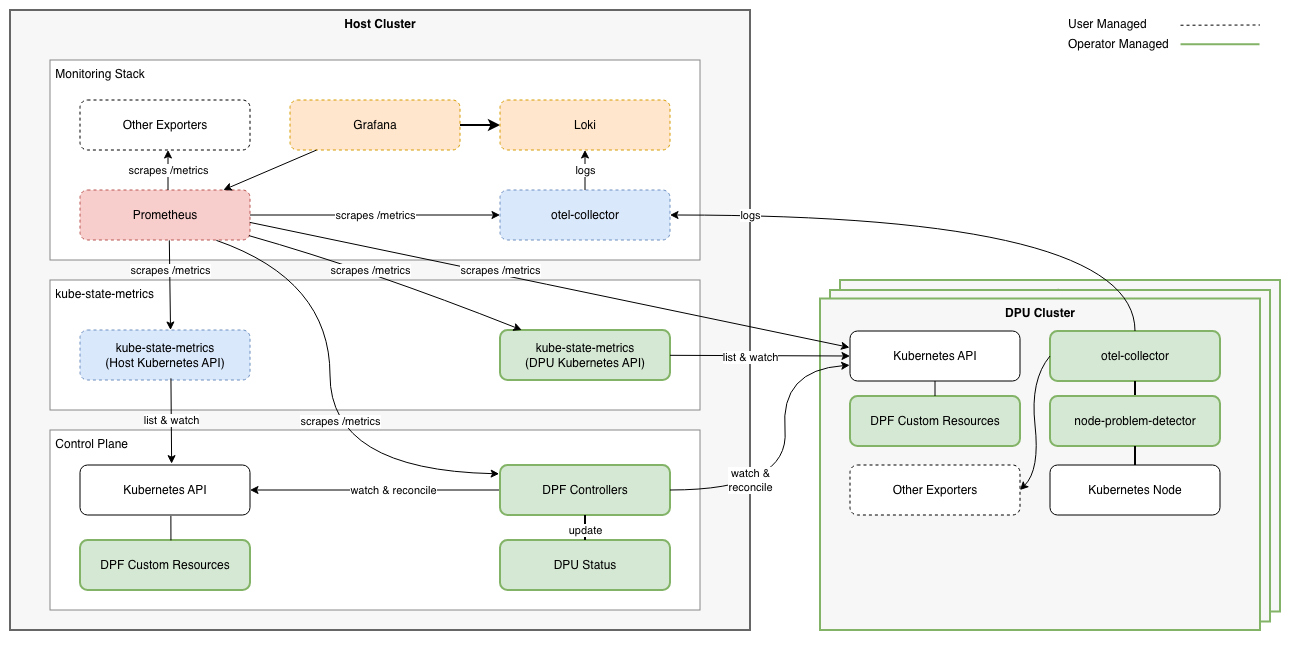
The diagram above shows a reference observability architecture for DPF. This is a blueprint that can be adapted to the specific environment requirements.
Component Topology
The architecture centralizes monitoring and logging on the Host Cluster:
Host Cluster (user-managed) - Central monitoring infrastructure:
-
Prometheus: Scrapes and stores metrics from all clusters
-
Grafana: Visualizes metrics with pre-configured DPF dashboards
-
Loki: Aggregates and stores logs from Host and DPU clusters
-
OpenTelemetry Collector: Receives logs from DPU clusters via OTLP
-
Kube-State-Metrics: Exposes DPF custom resource metrics for the host cluster
DPU Health Monitoring (DPF-operator-managed) - Runtime operational status:
-
Operational Conditions: Aggregated DPU health from Node-Problem-Detector, DPUService pods, DPUServiceInterfaces, and DPUServiceChains
-
Continuous tracking of runtime health (DPUServices, DPUServiceInterfaces, DPUServiceChains, node health checks) after provisioning completes
DPU Clusters (DPF-operator-managed) - Per-cluster monitoring agents:
-
Kube-State-Metrics: Exposes DPF Custom Resource metrics on the host cluster for objects deployed in the DPUCluster
-
Node-Problem-Detector: Monitors node health and reports conditions
-
OpenTelemetry Collector: Collects and forwards logs to Host Cluster
Documentation
Setup and Configuration
-
DPF-Operator-Managed Components - Configure Kube-State-Metrics, Node-Problem-Detector, and OpenTelemetry Collector
-
User-Managed Components - Setup Prometheus, Grafana, Loki, dashboards, multi-cluster configuration, and integration with existing monitoring stacks
-
Grafana Dashboards - Pre-configured Grafana dashboards for fleet health, DPU detail, framework state, and performance
-
DPU Operational Readiness - Monitor DPU health conditions and configure alerting
Getting Started
Note: The DPF operator should be installed before the monitoring stack (kube-prometheus-stack, Loki) to ensure monitoring components can use ConfigMaps created by the operator.
Installation Steps
-
Install Helm prerequisites: Follow Helm Prerequisites for pre-installation components (cert-manager, ArgoCD, etc.)
-
Deploy DPF operator: Install the operator which creates ConfigMaps required by the monitoring stack
-
Install monitoring stack: Install kube-prometheus-stack and Loki - see Helm Prerequisites
-
Configure DPF-operator components: See DPF-Operator-Managed Components for Kube-State-Metrics, Node-Problem-Detector, and OpenTelemetry Collector
-
Access Grafana: Port-forward and view pre-configured dashboards - see User-Managed Components
-
Monitor DPU health: View operational conditions - see DPU Operational Readiness
Last updated: