

The KPI REST endpoint is designed to provide fast and actionable insights into the network cluster's status. This API will offer key performance indicators (KPIs) that give a clear overview of the cluster's health, with the option to dive deeper into specific events. By using this endpoint, NOC operators can quickly identify network issues, assess their severity, and take immediate action, such as opening tickets for further investigation. The KPIs will be crucial for monitoring network performance and ensuring prompt response times.
Accessing API via Curl / Wget
curl --request GET \
  --url https://10.xxxxx.xxx/nmx/v1/kpis \
  --user "rw-user:Nmx12345"–insecure
wget --quiet \
  --method GET \
  --user 'rw-user' \
  --password 'Nmx12345' \
  --output-document \
  - https://10.xxx.xx.xxx/nmx/v1/kpis --no-check-certificate
The "rw-user" is the user with read-write access, and the password is "Nmx12345".
API Filter Parameters
REST API supports filtering based on different values of the filter parameter. The allowed values are:
-
Filtering based on Health:HEALTHSWITCH_HEALTHGPU_HEALTHDOMAIN_HEALTHCOMPUTE_HEALTH
-
Filtering based on Inventory:INVENTORYCOMPUTE_ALLOCATION
The API mentioned above supports filtering by appending the filter parameter to the endpoint, such as: kpis?filter=HEALTH
Sample Output
-
With filtering -
kpis?filter=SWITCH_HEALTH{ "Data": [ { "HEALTHY": 18 }, { "MISSING_NVLINK": 0 }, { "UNHEALTHY": 0 }, { "UNKNOWN": 0 } ], "Description": "Number of switch instances per health state", "Title": "Switch Health Count", "Type": "histogram" }
-
Without Filtering -
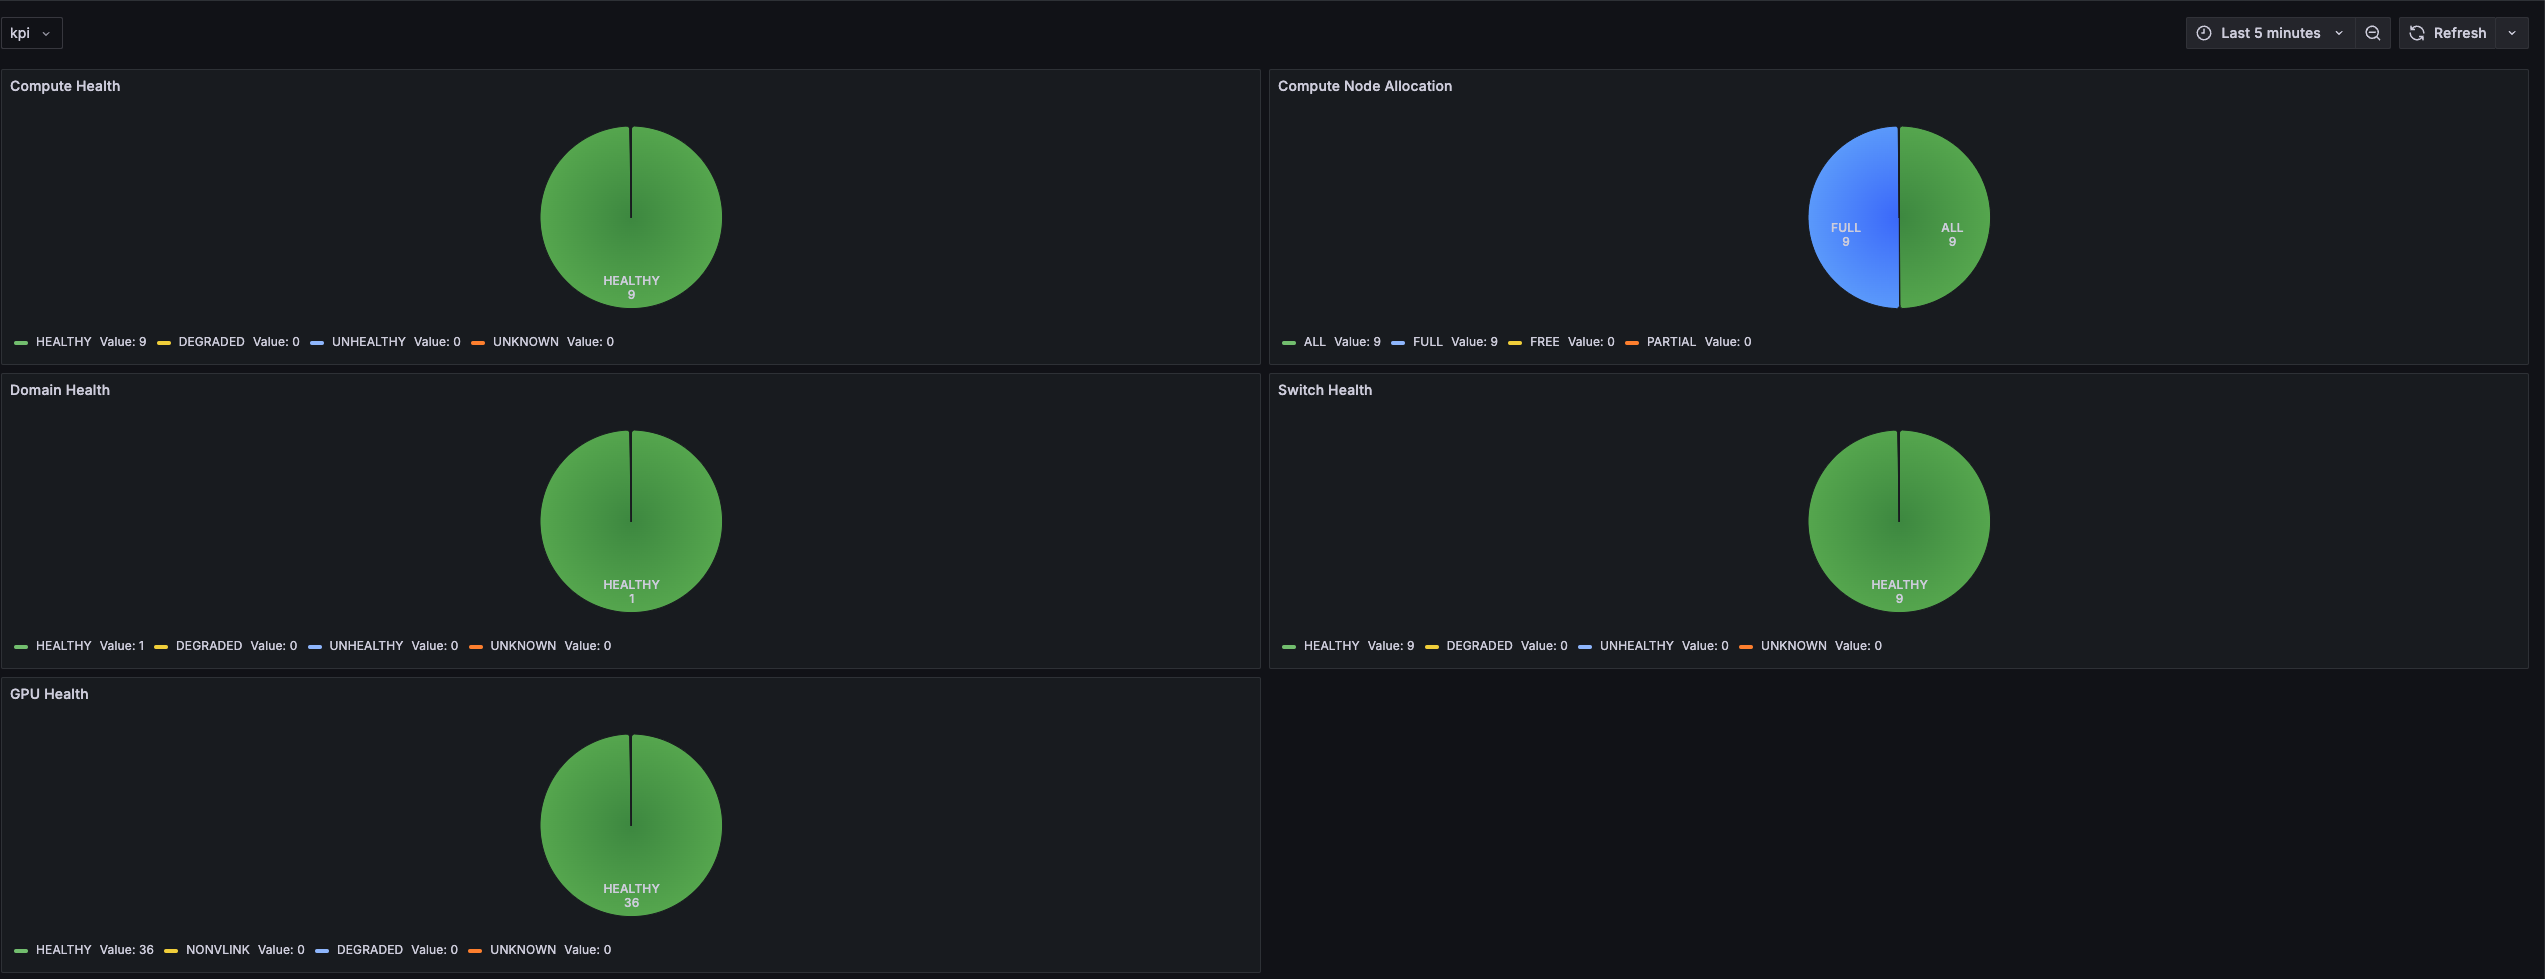
kpis{ "Health": { "compute-health": { "Data": [ { "HEALTHY": 9 }, { "DEGRADED": 0 }, { "UNHEALTHY": 0 }, { "UNKNOWN": 0 } ], "Description": "Number of compute nodes per health state", "Title": "Compute Health Count", "Type": "histogram" }, "domain-health": { "Data": [ { "HEALTHY": 1 }, { "DEGRADED": 0 }, { "UNHEALTHY": 0 }, { "UNKNOWN": 0 } ], "Description": "Number of domains per health state", "Title": "Domain Health Count", "Type": "histogram" }, "gpu-health": { "Data": [ { "HEALTHY": 36 }, { "NONVLINK": 0 }, { "DEGRADED": 0 }, { "UNKNOWN": 0 }, { "DEGRADED_BW": 0 } ], "Description": "Number of GPU instances per health state", "Title": "GPU Health Count", "Type": "histogram" }, "switch-health": { "Data": [ { "HEALTHY": 18 }, { "MISSING_NVLINK": 0 }, { "UNHEALTHY": 0 }, { "UNKNOWN": 0 } ], "Description": "Number of switch instances per health state", "Title": "Switch Health Count", "Type": "histogram" } }, "Inventory": { "compute-allocation": { "Data": [ { "ALL": 9 }, { "FREE": 0 }, { "FULL": 9 }, { "PARTIAL": 0 } ], "Description": "Number of compute nodes with its GPU instances in allocation state", "Title": "Compute GPU Allocation Count", "Type": "histogram" } } }
Creation of Grafana Dashboard
-
Configure JSON API Data Source
-
Click Connections, then select JSON API from the available options. If it is not installed, install it first.
-
Click Add a new data source.
-
Provide the details below: Name: Add the prefix kpi (case sensitive). Note: If you do not prefix the name with kpi, update the attached JSON file before importing it into the dashboard.URL. Ex- https://10.xxx.xx.xxx/nmx/v1/kpisAuthentication: Select Basic AuthenticationExample: - User: rw-user- Password: Nmx12345Skip TLS Certificate Validation
-
Save and Test.
-
-
Configuring
Dashboard
-
Click DashBoards in home screen.
-
Click on New → import.
-
Paste the content of
kpi-dashboard.jsonfile under the section "Import via dashboard JSON model".
kpi-dashboard.json -
Click on Load, followed by Import.
-
-
Sample Dashboard
Last updated: