Created on Oct 27, 2024
Scope
This Reference Deployment Guide (RDG) provides a practical and scalable Ethernet fabric deployment suitable for high-performance workloads in K8s. This fabric is based on EVPN and provides both a primary K8s network (such as Calico) and a secondary high-performance network for RDMA/DPDK/GDR, using the NVIDIA Network Operator and NVIDIA GPU Operator.
The proposed fabric configuration supports up to 480 workload servers in its maximum scale and provides a non-blocking throughput of up to 200Gbps between pods.
The information presented is written for experienced System Admins, System Engineers and Solution Architects who want to deploy a scalable, high performance capable Kubernetes cluster over the NVIDIA Ethernet fabric.
Abbreviations and Acronyms
|
Term |
Definition |
Term |
Definition |
|---|---|---|---|
|
BGP |
Border Gateway Protocol |
LACP |
Link Aggregation Control Protocol |
|
CNI |
Container Network Interface |
LLDP |
Link Layer Discovery Protocol |
|
CUDA |
Compute Unified Device Architecture |
MLNX_OFED |
NVIDIA OpenFabrics Enterprise Distribution for Linux (network driver) |
|
DMA |
Direct Memory Access |
RDG |
Reference Deployment Guide |
|
DPDK |
Data Plane Development Kit |
RDMA |
Remote Direct Memory Access |
|
EVPN |
Ethernet Virtual Private Network |
SR-IOV |
Single Root Input/Output Virtualization |
|
EVPN-MH |
EVPN Multi Homing |
TOR |
Top of Rack |
|
GDR |
GPUDirect RDMA |
VLAN |
Virtual LAN (Local Area Network) |
|
GPU |
Graphical Processing Unit |
VRR |
Virtual Router Redundancy |
|
ISL |
Inter-Switch Link |
VTEP |
Virtual Tunnel End Point |
|
K8S |
Kubernetes |
VXLAN |
Virtual Extensible LAN |
Introduction
Provisioning a Kubernetes cluster that is scalable and suitable for running high performance applications can be an extremely complicated task - you need to take into account many considerations, such as the logical and fabric design, software and hardware component selection, deployment methods, and implementation of optimizations to be able to meet the required performance needs.
This Reference Deployment Guide (RDG) provides a complete and practical solution for a scalable Ethernet fabric deployment suitable for high-performance workloads in K8s (Kubernetes). The solution is delivered on top of standard servers, while the NVIDIA end-to-end Ethernet infrastructure is used to handle the network communication.
In this guide, a single fabric provides both the primary K8s network and a secondary high-performance network, which handles the workload.
Using the NVIDIA Network Operator and NVIDIA GPU Operator, responsible for deploying and configuring network and GPU components in the K8s cluster, practical examples show how to accelerate workloads using technologies like RDMA, DPDK and GDR.
This document goes step by step with the solution implementation - beginning with the fabric design and K8s deployment, then continuing with the actual deployment and configuration steps, and finally concluding with a performance test to demonstrate the benefits of the solution.
References
Solution Architecture
Key Components and Technologies
-
NVIDIA ConnectX SmartNICs
10/25/40/50/100/200 and 400G Ethernet Network Adapters
The industry-leading NVIDIA® ConnectX® family of smart network interface cards (SmartNICs) offer advanced hardware offloads and accelerations.
NVIDIA Ethernet adapters enable the highest ROI and lowest Total Cost of Ownership for hyperscale, public and private clouds, storage, machine learning, AI, big data, and telco platforms.
-
NVIDIA LinkX Cables
The NVIDIA® LinkX® product family of cables and transceivers provides the industry’s most complete line of 10, 25, 40, 50, 100, 200, and 400GbE in Ethernet and 100, 200 and 400Gb/s InfiniBand products for Cloud, HPC, hyperscale, Enterprise, telco, storage and artificial intelligence, data center applications.
-
NVIDIA Spectrum Ethernet Switches
Flexible form-factors with 16 to 128 physical ports, supporting 1GbE through 400GbE speeds.
Based on a ground-breaking silicon technology optimized for performance and scalability, NVIDIA Spectrum switches are ideal for building high-performance, cost-effective, and efficient Cloud Data Center Networks, Ethernet Storage Fabric, and Deep Learning Interconnects.
NVIDIA combines the benefits of NVIDIA Spectrum™ switches, based on an industry-leading application-specific integrated circuit (ASIC) technology, with a wide variety of modern network operating system choices, including NVIDIA Cumulus® Linux, SONiC and NVIDIA Onyx®.
-
NVIDIA Cumulus Linux
NVIDIA® Cumulus® Linux is the industry's most innovative open network operating system that allows you to automate, customize, and scale your data center network like no other.
-
Kubernetes
Kubernetes is an open-source container orchestration platform for deployment automation, scaling, and management of containerized applications.
-
Kubespray
Kubespray is a composition ofAnsible
playbooks, inventory, provisioning tools, and domain knowledge for generic OS/Kubernetes clusters configuration management tasks and provides:
-
A highly available cluster
-
Composable attributes
-
Support for most popular Linux distributions
-
-
NVIDIA Network Operator
The NVIDIA Network Operator simplifies the provisioning and management of NVIDIA networking resources in a Kubernetes cluster. The operator automatically installs the required host networking software - bringing together all the needed components to provide high-speed network connectivity. These components include the NVIDIA networking driver, Kubernetes device plugin, CNI plugins, IP address management (IPAM) plugin and others. The NVIDIA Network Operator works in conjunction with the NVIDIA GPU Operator to deliver high-throughput, low-latency networking for scale-out, GPU computing clusters.
-
NVIDIA GPU Operator
The NVIDIA GPU Operator uses the operator framework within Kubernetes to automate the management of all NVIDIA software components needed to provision GPU. These components include the NVIDIA drivers (to enable CUDA), Kubernetes device plugin for GPUs, the NVIDIA Container Runtime, automatic node labelling, DCGM-based monitoring, and more.
-
NVIDIA CUDA
CUDA® is a parallel computing platform and programming model developed by NVIDIA for general computing on graphical processing units (GPUs). With CUDA, developers can dramatically speed up computing applications by harnessing the power of GPUs. In GPU-accelerated applications, the sequential part of the workload runs on the CPU – which is optimized for single-threaded performance – while the compute-intensive portion of the application runs on thousands of GPU cores in parallel.
-
NVIDIA PMD
NVIDIA Poll Mode Driver (PMD) is an open-source upstream driver embedded within dpdk.org releases. PMD is designed for fast packet processing and low latency by providing kernel bypass for receive and send, and avoiding the interrupt processing performance overhead. -
TRex—Realistic Traffic Generator
TRex is an open source stateful and stateless traffic generator fueled by DPDK. TRex generates layer 3 through 7 traffic and provides in one tool the capabilities provided by commercial tools. TRex can scale up to 200Gb/sec with one server.
-
RDMA
RDMA is a technology that allows computers in a network to exchange data without involving the processor, cache or operating system of either computer.
Like locally based DMA, RDMA improves throughput and performance and frees up compute resources.
-
GPUDirect RDMA
GPUDirect (GDR) RDMA provides a direct P2P (Peer-to-Peer) data path between the GPU memory directly to and from NVIDIA host networking devices. This reduces GPU-to-GPU communication latency and completely offloads the CPU, removing it from all GPU-to-GPU communications across the network.
Unknown Attachment
Solution Design
The logical design includes the following components:
-
1 x Deployment node running Kubespray that deploys the Kubernetes cluster
-
1 x Master node running all Kubernetes management components
-
4 x Worker nodes, each with a 1 x ConnectX-7 NIC and 2 x NVIDIA A100 Tensor Core GPU
-
Single, high speed Ethernet fabric for deployment, management, tenant and high speed networks
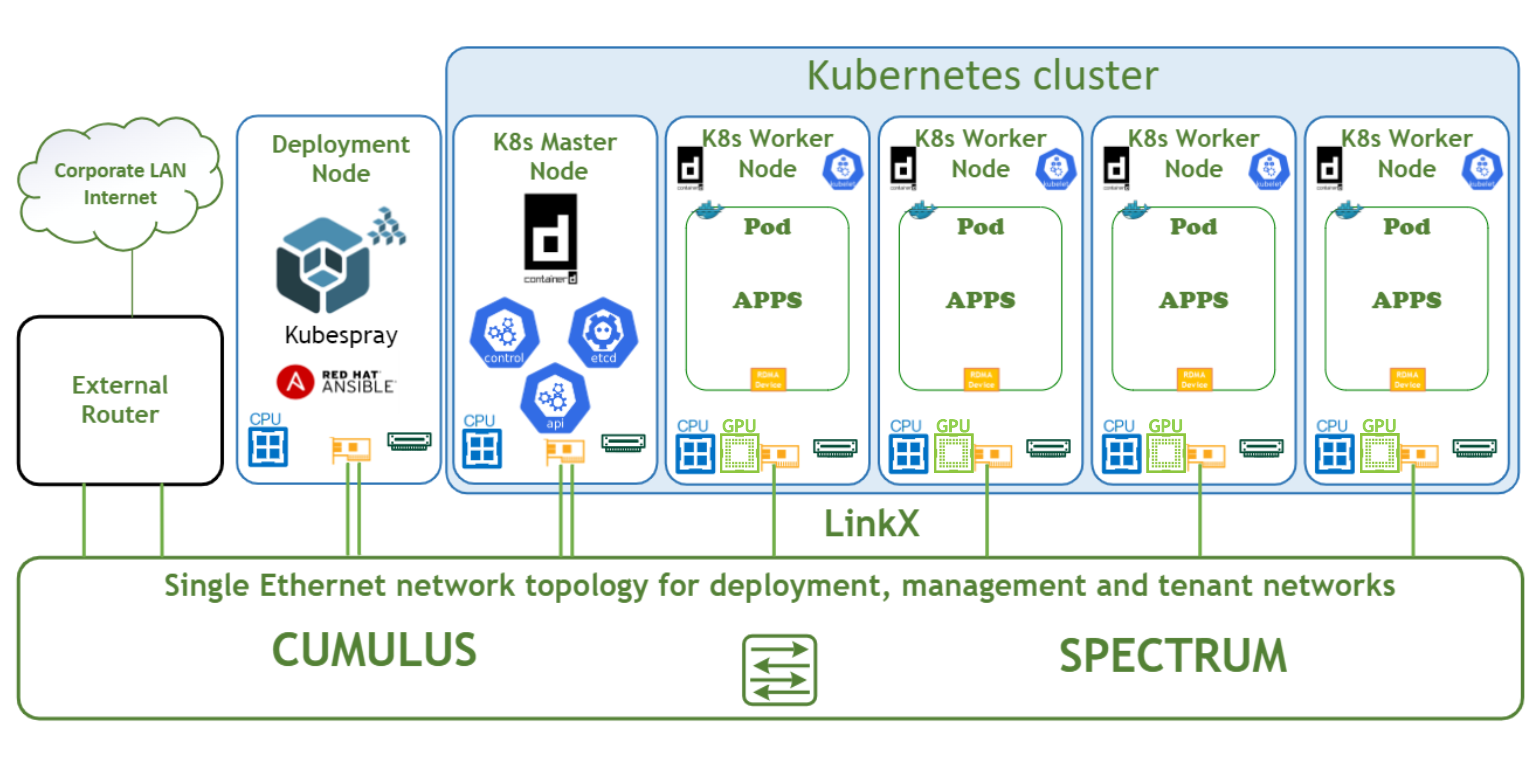
This document covers a single K8s controller deployment scenario. For high-availability cluster deployment, refer to kubespray/docs/operations/ha-mode.md at master · kubernetes-sigs/kubespray · GitHub
Network / Fabric Design
The design of the fabric is based on a 2-level leaf-spine topology for workload and K8s management, and an additional IPMI network (not covered in this document).
This document demonstrates a minimalistic scale of one infrastructure or management and two workload racks with two servers each (as shown in the diagram below):
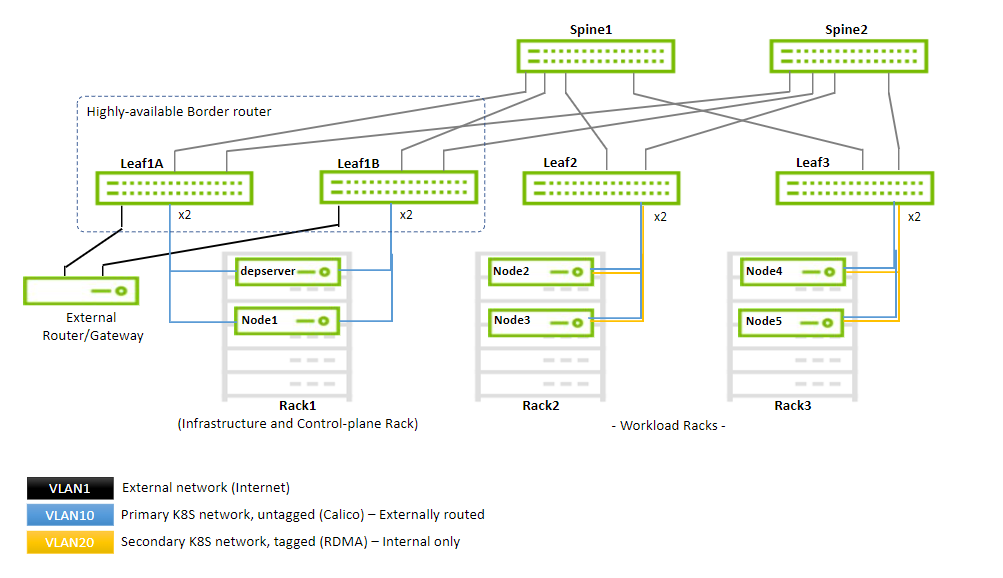
By using the same design, the fabric can scale to accommodate up to 480 workload servers using up to 30 workload racks with up to 16 servers each. Every workload rack uses a single leaf switch (TOR). The infrastructure rack consists of a highly-available border router (EVPN-MH) that provides a connection to an external gateway or router and to a maximum of additional 15 servers.
The high-speed network consists of two logical segments:
-
The management network and the primary K8s network (used by Calico) - VLAN10
-
The secondary K8s network that provides RDMA to the pods - VLAN20
The fabric implements a VXLAN overlay network with a BGP EVPN control plane that enables you to "stretch" the VLANs across all the racks.
Every leaf switch has a VTEP that takes care of VXLAN encapsulation and decapsulation. Communication between the VTEPs is done by routing through the spines, controlled by a BGP control plane.
The infrastructure rack (as seen on the left in the illustration below) has two leaf switches that act as a highly available border router, providing both highly available connectivity for the infrastructure servers (the deployment server and the K8s master node) and redundant routing into and out of the cluster through a gateway node. This high availability is achieved by an EVPN-MH configuration, the use of LACP bonds, and a redundant router mechanism that uses VRR.
Below is a diagram demonstrating the maximum possible scale for a non-blocking deployment that uses 200GbE to the host (30 racks, 16 servers each using 16 spines and 32 leaves).
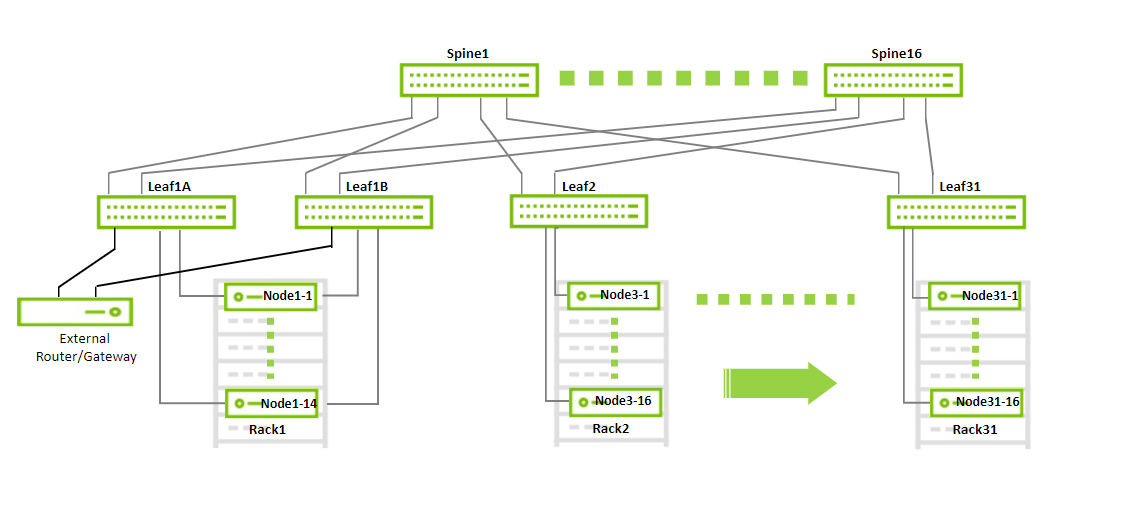
With a maximum scale fabric (as shown above), there are 16 x 200Gbps links going up from each leaf to the spines and, therefore, a maximum of 16 x 200Gbps links going to servers in each rack.
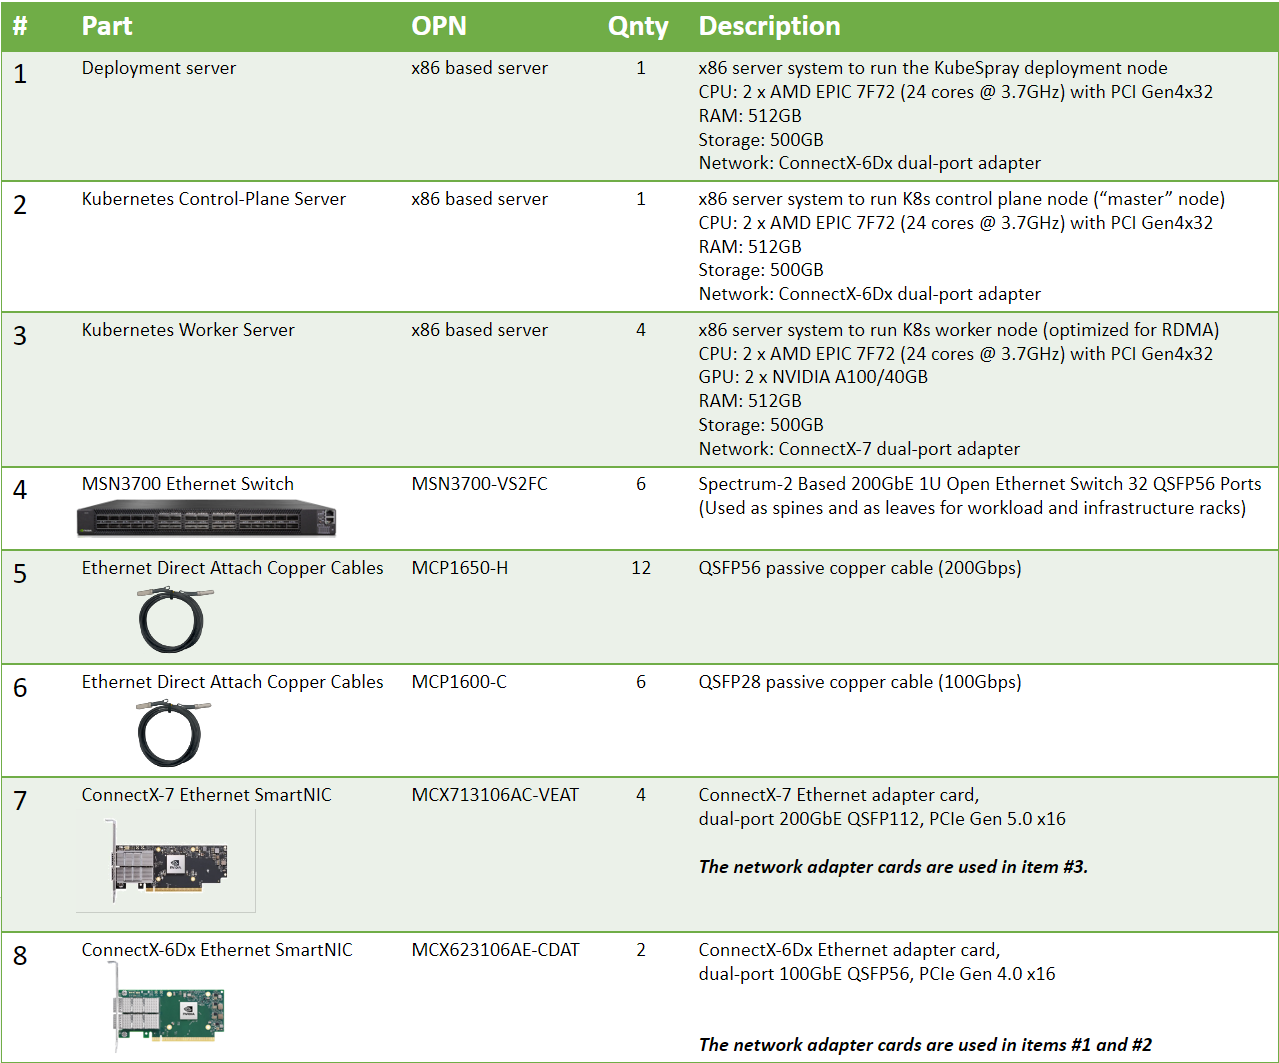
Software Stack Components
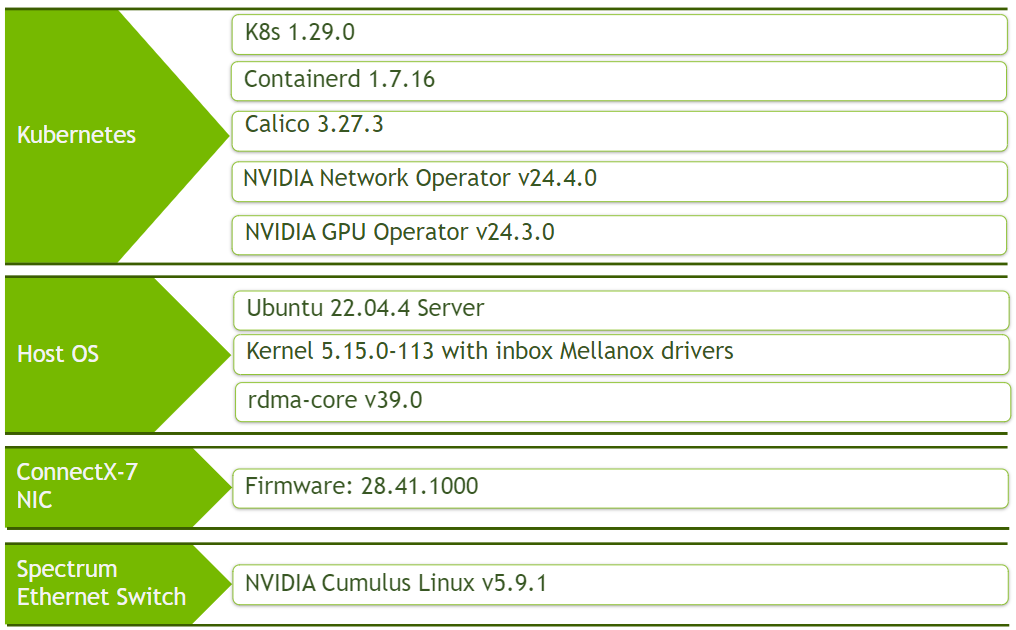
Make sure to upgrade all the NVIDIA software components to their latest released version.
Bill of Materials
Deployment and Configuration
Node and Switch Definitions
These are the definitions and parameters used for deploying the demonstrated fabric:
|
Spines |
|||
|
Hostname |
Router ID |
Autonomous System |
Downlinks |
|
spine1 (MSN3700) |
10.0.0.1/32 |
65100 |
swp1-4 |
|
spine2 (MSN3700) |
10.0.0.2/32 |
65100 |
swp1-4 |
|
Leaves |
||||
|
Hostname |
Router ID |
Autonomous System |
Uplinks |
Downlinks |
|
leaf1a (MSN3700) |
10.0.0.101/32 |
65101 |
swp31-32 |
swp1-3 |
|
leaf1b (MSN3700) |
10.0.0.102/32 |
65102 |
swp31-32 |
swp1-3 |
|
leaf2 (MSN3700) |
10.0.0.103/32 |
65103 |
swp31-32 |
swp1-2 |
|
leaf3 (MSN3700) |
10.0.0.104/32 |
65104 |
swp31-32 |
swp1-2 |
|
Workload Server Ports |
||||
|
Hostname |
Rack ID |
Ports |
Access VLAN |
Trunk VLAN |
|
leaf2 |
2 |
swp1-2 |
10 |
20 |
|
leaf3 |
3 |
swp1-2 |
10 |
20 |
|
Border Routers (Infrastructure Rack TORs) |
||
|
Hostname |
Segment MAC Address |
df-preference |
|
leaf1a |
44:38:39:BE:EF:AA |
50000 |
|
leaf1b |
44:38:39:BE:EF:AA |
50000 |
|
Border VLANs |
||||
|
VLAN ID |
Virt MAC |
Virt IP |
First Router IP |
Second Router IP |
|
1 |
00:00:5e:00:01:01 |
10.1.0.1/24 |
10.1.0.2/24 |
10.1.0.3/24 |
|
Infrastructure Server Ports |
|||
|
Hostname |
Ports |
Bond |
Access VLAN |
|
leaf1a, leaf1b |
swp1 |
bond1 |
1 |
|
leaf1a, leaf1b |
swp2 |
bond2 |
10 |
|
leaf1a, leaf1b |
swp3 |
bond3 |
10 |
|
Hosts |
|||||
|
Rack |
Server Type |
Server Name |
Switch Port |
IP and NICs |
Default Gateway |
|
Rack1 (Infrastructure) |
External Gateway |
gateway |
swp1 |
bond0 (enp204s0f0np0, enp204s0f1np1) 10.1.0.254/24 |
- |
|
Rack1 (Infrastructure) |
Deployment Node |
depserver |
swp2 |
bond0 (enp203s0f0np0, enp203s0f1np1) 10.10.0.250/16 |
10.10.0.1 |
|
Rack1 (Infrastructure) |
Master Node |
node1 |
swp3 |
bond0 (enp203s0f0np0, enp203s0f1np1) 10.10.1.1/16 |
10.10.0.1 |
|
Rack2 (Workload) |
Worker Node |
node2 |
swp1 |
enp63s0f0np0 10.10.1.2/16 |
10.10.0.1 |
|
Rack2 (Workload) |
Worker Node |
node3 |
swp2 |
enp63s0f0np0 10.10.1.3/16 |
10.10.0.1 |
|
Rack3 (Workload) |
Worker Node |
node4 |
swp1 |
enp63s0f0np0 10.10.1.4/16 |
10.10.0.1 |
|
Rack3 (Workload) |
Worker Node |
node5 |
swp2 |
enp63s0f0np0 10.10.1.5/16 |
10.10.0.1 |
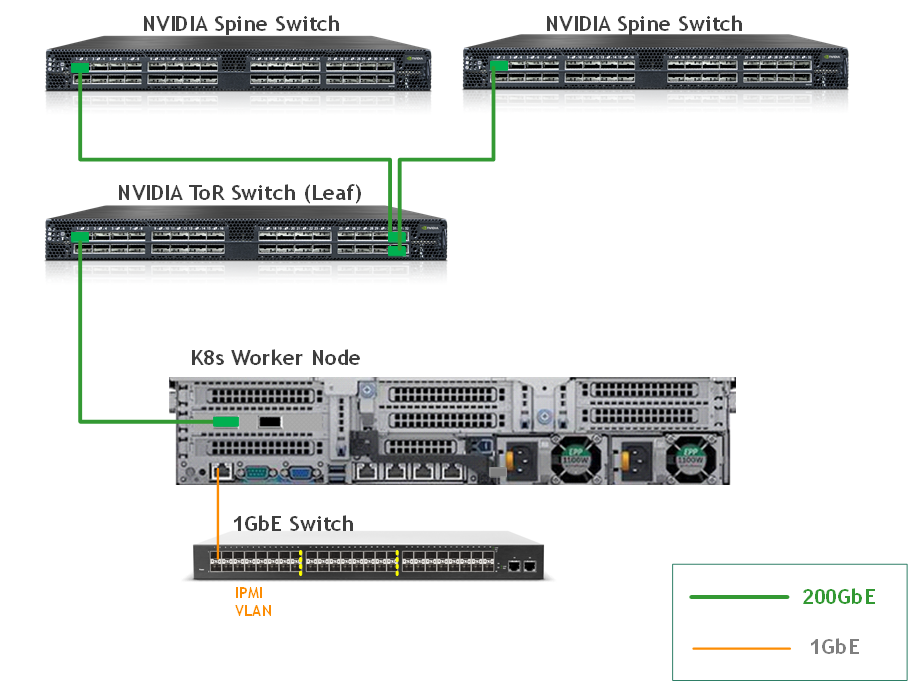
Wiring
This is the wiring principal for the workload racks:
-
Each server in the racks is wired to the leaf (or "TOR") switch
-
Every leaf is wired to all the spines
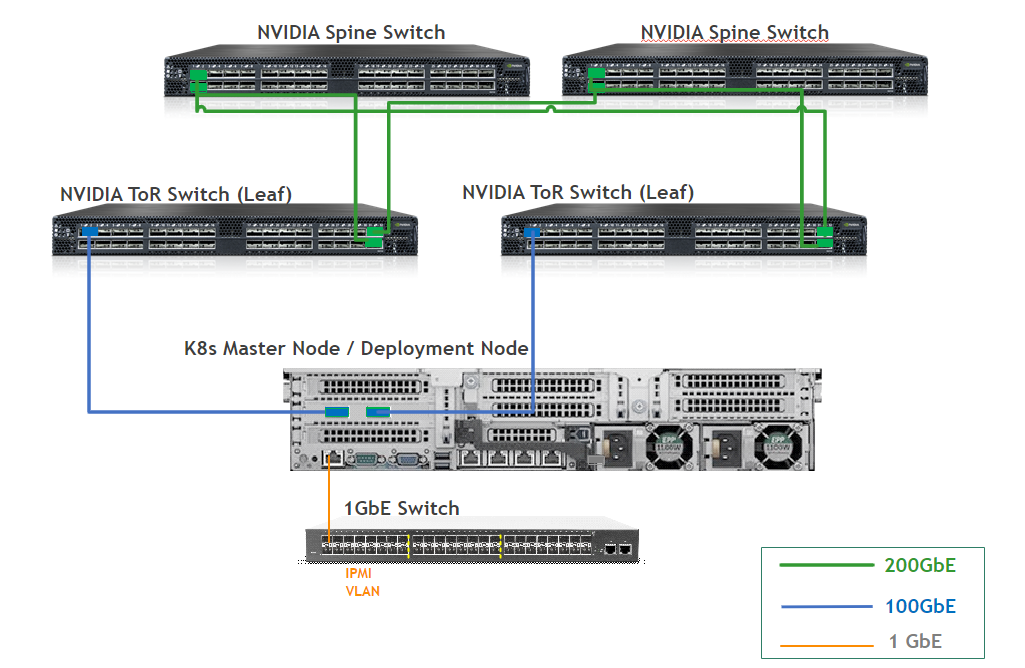
This is the wiring principal for the infrastructure rack:
-
Each server in the racks is wired to two leaf switches (or "TORs")
-
Every leaf is wired to all the spines
Fabric Configuration
Updating Cumulus Linux
As a best practice, make sure to use the latest released Cumulus Linux NOS version.
For information on how to upgrade Cumulus Linux, refer to the Cumulus Linux User Guide.
Configuring the Cumulus Linux Switch
Switch configuration is as follows:
To verify that the configuration is correct, check Validating the fabric below.
Connecting the Infrastructure Servers
Infrastructure servers (deployment and K8s master servers) are placed in the infrastructure rack.
This requires the following additional configuration steps:
-
Add the ports connected to the servers to a bond.
-
Place the bond in the relevant VLAN.
In the example, the servers connect to ports swp2 and swp3 on both leaf switches (Leaf1A and Leaf1B) and use VLAN10 created on the border leaf switches. The commands on both Leaf1A and Leaf1B are shown above.
The server side is configured with netplan (depserver as an example):
Depserver bond configuration
bonds:
       bond0:
         mtu: 8950
         addresses: [10.10.0.250/16]
         interfaces:
           - enp203s0f0np0
           - enp203s0f1np1
         parameters:
           mode: 802.3ad
           transmit-hash-policy: layer3+4
           mii-monitor-interval: 1
Connecting an External Gateway to the Infrastructure Rack
The example connects an external gateway machine (10.1.0.254/24) over an LACP bond to swp1 of both border leaf switches (through VLAN1).
This gateway is used to access any external network (such as the Internet). The configuration commands on both border leaf switches are shown above.
This document does not provide the gateway configuration.
Host Configuration
Make sure that the BIOS settings on the worker node servers have SR-IOV enabled and that the servers are tuned for maximum performance.
All worker nodes must have the same PCIe placement for the NIC and must show the same interface name.
Network Configuration on the Worker Nodes
Set an IP address for network connectivity to the servers and set the MTU on the physical port of the server to allow for optimized throughput.
The fabric uses a VXLAN overlay, therefore, use the maximum MTU of 9216 on the core links (leaf to spine links) and an MTU of 8950 on the edge links (server links), making sure that the VXLAN header added to the packets do not cause fragmentation.
In addition, you need to configure the gateway for the high-speed network; the VRR address (10.10.0.1/16).
To configure the IP, MTU, and gateway on the server ports, edit the netplan configuration file (perform the following example on node2 on all of the worker nodes):
Node2 netplan configuration
network:
    ethernets:
        enp63s0f0np0:
            dhcp4: false
            mtu: 8950
            addresses: [10.10.1.2/16]
            routes:
              - to: default
                via: 10.10.0.1
 	version: 2
Apply the configuration:
Worker Node Console
root@node2:~# netplan apply
Installing and Updating the OS
Make sure the Ubuntu Server 22.04 operating system is installed on all servers with OpenSSH server packages and create a non-root user account with sudo privileges without a password.
Also, make sure to assign the correct network configuration to the hosts (IP addresses, default gateway, DNS server, NTP server) and to create bonds on the nodes in the infrastructure rack (master node and deployment node).
Update the Ubuntu software packages with the following commands:
Update Ubuntu software
# apt-get update -y
# apt-get upgrade -y
# reboot
Non-root User Account Prerequisites
The example creates a non-root user account with sudo privileges without a password (on each of the hosts in the deployment):
Server Console
# sed -i 's/SHELL=\/bin\/sh/SHELL=\/bin\/bash/g' /etc/default/useradd
# useradd -mG 27 user
# passwd user
# su - user
$ echo "$USER ALL=(ALL:ALL) NOPASSWD: ALL" | sudo tee "/etc/sudoers.d/$USER"
Installing rdma-core and Setting RDMA to "Exclusive Mode"
On all the worker nodes, install the rdma-core package:
Worker Node Console
# apt install rdma-core -y
Set netns to exclusive mode to provide namespace isolation on the high-speed interface. With this configuration, each pod can only see and access its own virtual functions.
Create the following file:
Worker Node Console
# vi /etc/modprobe.d/ib_core.conf

# Set netns to exclusive mode for namespace isolation
options ib_core netns_mode=0
Run the following commands:
Worker Node Console
# update-initramfs -u
# reboot
After the node comes back, check that netns mode is set to exclusive mode:
Worker Node Console
# rdma system
netns exclusive copy-on-fork on
You can use the "rdma link" command to identify the name assigned to the high-speed interface, for example:
# rdma link
link rocep63s0f0/1 state ACTIVE physical_state LINK_UP netdev enp63s0f0np0
NIC Firmware Upgrade
NVIDIA recommends that you upgrade the NIC firmware on the worker nodes to the latest released version.
Make sure to use the root account:
Worker Node Console
$ sudo su -
Make sure to download the "mlxup" program to each Worker Node and install the latest firmware for the NIC (requires Internet connectivity - check the official download page)
Worker Node Console
# wget https://www.mellanox.com/downloads/firmware/mlxup/4.28.0/SFX/linux_x64/mlxup
# chmod 755 mlxup
# lspci | grep Mellanox
3f:00.0 Ethernet controller: Mellanox Technologies MT2910 Family [ConnectX-7]
3f:00.1 Ethernet controller: Mellanox Technologies MT2910 Family [ConnectX-7]
# ./mlxup -d 0000:3f:00.0 -u --online
# reboot
To verify that the firmware is updated, rerun the commands after reboot. The output looks similar to the following:
Worker Node Console
./mlxup -d 0000:3f:00.0 -u --online
Querying Mellanox devices firmware ...

Device #1:
----------

  Device Type:      ConnectX7
  Part Number:      MCX713106AC-VEA_Ax
  Description:      NVIDIA ConnectX-7 HHHL Adapter Card; 200GbE; Dual-port QSFP112; PCIe 5.0 x16; Crypto Enabled; Secure Boot Enabled
  PSID:             MT_0000000841
  PCI Device Name:  0000:3f:00.0
  Base GUID:        b83fd2030018683a
  Base MAC:         b83fd218683a
  Versions:         Current        Available
     FW             28.41.1000     28.41.1000
     PXE            3.7.0400       N/A
     UEFI           14.34.0012     N/A

  Status:           Up to date
K8s Cluster Deployment and Configuration
The K8s cluster in this solution is installed using Kubespray with a non-root user account from the Deployment Node.
SSH Private Key and SSH Passwordless Login
Log into the Deployment Node as a deployment user (in this case - user) and create an SSH private key to configure the password-less authentication on your computer:
Deployment Node Console
$ sudo su - user
$ ssh-keygen
Generating public/private rsa key pair.
Enter file in which to save the key (/home/user/.ssh/id_rsa):
Created directory '/home/user/.ssh'.
Enter passphrase (empty for no passphrase):
Enter same passphrase again:
Your identification has been saved in /home/user/.ssh/id_rsa.
Your public key has been saved in /home/user/.ssh/id_rsa.pub.
The key fingerprint is:
SHA256:PaZkvxV4K/h8q32zPWdZhG1VS0DSisAlehXVuiseLgA user@depl-node
The key's randomart image is:
+---[RSA 2048]----+
|      ...+oo+o..o|
|      .oo   .o. o|
|     . .. . o  +.|
|   E  .  o +  . +|
|    .   S = +  o |
|     . o = + o  .|
|      . o.o +   o|
|       ..+.*. o+o|
|        oo*ooo.++|
+----[SHA256]-----+
Run the following commands to copy your SSH public key, such as ~/.ssh/id_rsa.pub, to all nodes in your deployment. The example shows node1 in the deployment.
Deployment Node Console
$ ssh-copy-id 10.10.1.1
/usr/bin/ssh-copy-id: INFO: Source of key(s) to be installed: "/home/user/.ssh/id_rsa.pub"
The authenticity of host '10.10.1.1 (10.10.1.1)' can't be established.
ECDSA key fingerprint is SHA256:uyglY5g0CgPNGDm+XKuSkFAbx0RLaPijpktANgXRlD8.
Are you sure you want to continue connecting (yes/no)? yes
/usr/bin/ssh-copy-id: INFO: attempting to log in with the new key(s), to filter out any that are already installed
/usr/bin/ssh-copy-id: INFO: 1 key(s) remain to be installed -- if you are prompted now it is to install the new keys
user@10.10.1.1's password:

Number of key(s) added: 1

Now try logging into the machine, with:   "ssh 'user@10.10.1.1'"
and check to make sure that only the key(s) you wanted were added.
To verify that you have password-less SSH connectivity to all nodes in your deployment, run the following command:
Deployment Node Console
$ ssh user@10.10.1.1
Kubespray Deployment and Configuration
To install dependencies for running Kubespray with Ansible on the Deployment server, run following commands:
Deployment Node Console
$ cd ~
$ sudo apt -y install python3-pip jq python3.10-venv
$ git clone https://github.com/kubernetes-sigs/kubespray.git
$ cd kubespray
$ python3 -m venv .venv
$ source .venv/bin/activate
$ python3 -m pip install --upgrade pip
$ pip install -U -r requirements.txt
$ pip install ruamel-yaml
Create a new cluster configuration. The default folder for subsequent commands is ~/kubespray.
Replace the IP addresses below with the IP addresses of your nodes:
Deployment Node Console
$ cp -rfp inventory/sample inventory/mycluster
$ declare -a IPS=(10.10.1.1 10.10.1.2 10.10.1.3 10.10.1.4 10.10.1.5)
$ CONFIG_FILE=inventory/mycluster/hosts.yaml python3 contrib/inventory_builder/inventory.py ${IPS[@]}
The inventory/mycluster/hosts.yaml file is created.
Review and change the host configuration in the file. The following is an example for this deployment:
inventory/mycluster/hosts.yaml
$ vi inventory/mycluster/hosts.yaml

all:
  hosts:
    node1:
      ansible_host: 10.10.1.1
      ip: 10.10.1.1
      access_ip: 10.10.1.1
    node2:
      ansible_host: 10.10.1.2
      ip: 10.10.1.2
      access_ip: 10.10.1.2
    node3:
      ansible_host: 10.10.1.3
      ip: 10.10.1.3
      access_ip: 10.10.1.3
    node4:
      ansible_host: 10.10.1.4
      ip: 10.10.1.4
      access_ip: 10.10.1.4
    node5:
      ansible_host: 10.10.1.5
      ip: 10.10.1.5
      access_ip: 10.10.1.5
  children:
    kube_control_plane:
      hosts:
        node1:
    kube_node:
      hosts:
        node2:
        node3:
        node4:
        node5:
    etcd:
      hosts:
        node1:
    k8s_cluster:
      children:
        kube_control_plane:
        kube_node:
    calico_rr:
      hosts: {}
In the example deployment, there is 1 master node (node1) and 4 worker nodes (node2-5) so configure the hosts.yaml to be as follows:
-
kube_control_plane: node1
-
kube_node: node2-5
-
etcd: node1
Review and change the cluster installation parameters in the inventory/mycluster/group_vars/all/all.yml and inventory/mycluster/group_vars/k8s_cluster/k8s-cluster.yml files.
In the inventory/mycluster/group_vars/all/all.yml file, remove the comment from the following line to enable Kubelet to serve on a read-only API (for metrics exposure) with no authentication or authorization:
Deployment Node Console
$ sed -i 's/#\ kube_read_only_port:/kube_read_only_port:/g' inventory/mycluster/group_vars/all/all.yml
In the inventory/mycluster/group_vars/k8s_cluster/k8s-cluster.yml file, set the value of kube_version to v1.29.0, set the container_manager to containerd, and make sure multi_networking is set to false - kube_network_plugin_multus: false (the plugin is installed later as part of NVIDIA network operator):
Deployment Node Console
$ vi inventory/mycluster/group_vars/k8s_cluster/k8s-cluster.yml

…
## Change this to use another Kubernetes version, e.g. a current beta release
kube_version: v1.29.0
…
## Container runtime
## docker for docker, crio for cri-o and containerd for containerd.
## Default: containerd
container_manager: containerd
…
# Setting multi_networking to true will install Multus: https://github.com/intel/multus-cni
kube_network_plugin_multus: false
…
In the inventory/mycluster/group_vars/all/etcd.yml file, set the etcd_deployment_type to host:
Deployment Node Console
$ vi inventory/mycluster/group_vars/all/etcd.yml

...

## Settings for etcd deployment type
# Set this to docker if you are using container_manager: docker
etcd_deployment_type: host
Deploying the cluster using Kubespray Ansible Playbook
To start the deployment process, run the following command:
Deployment Node Console
$ ansible-playbook -i inventory/mycluster/hosts.yaml --become --become-user=root cluster.yml
It takes a while for this deployment to complete. Make sure there are no errors.
A successful result looks similar to the following:
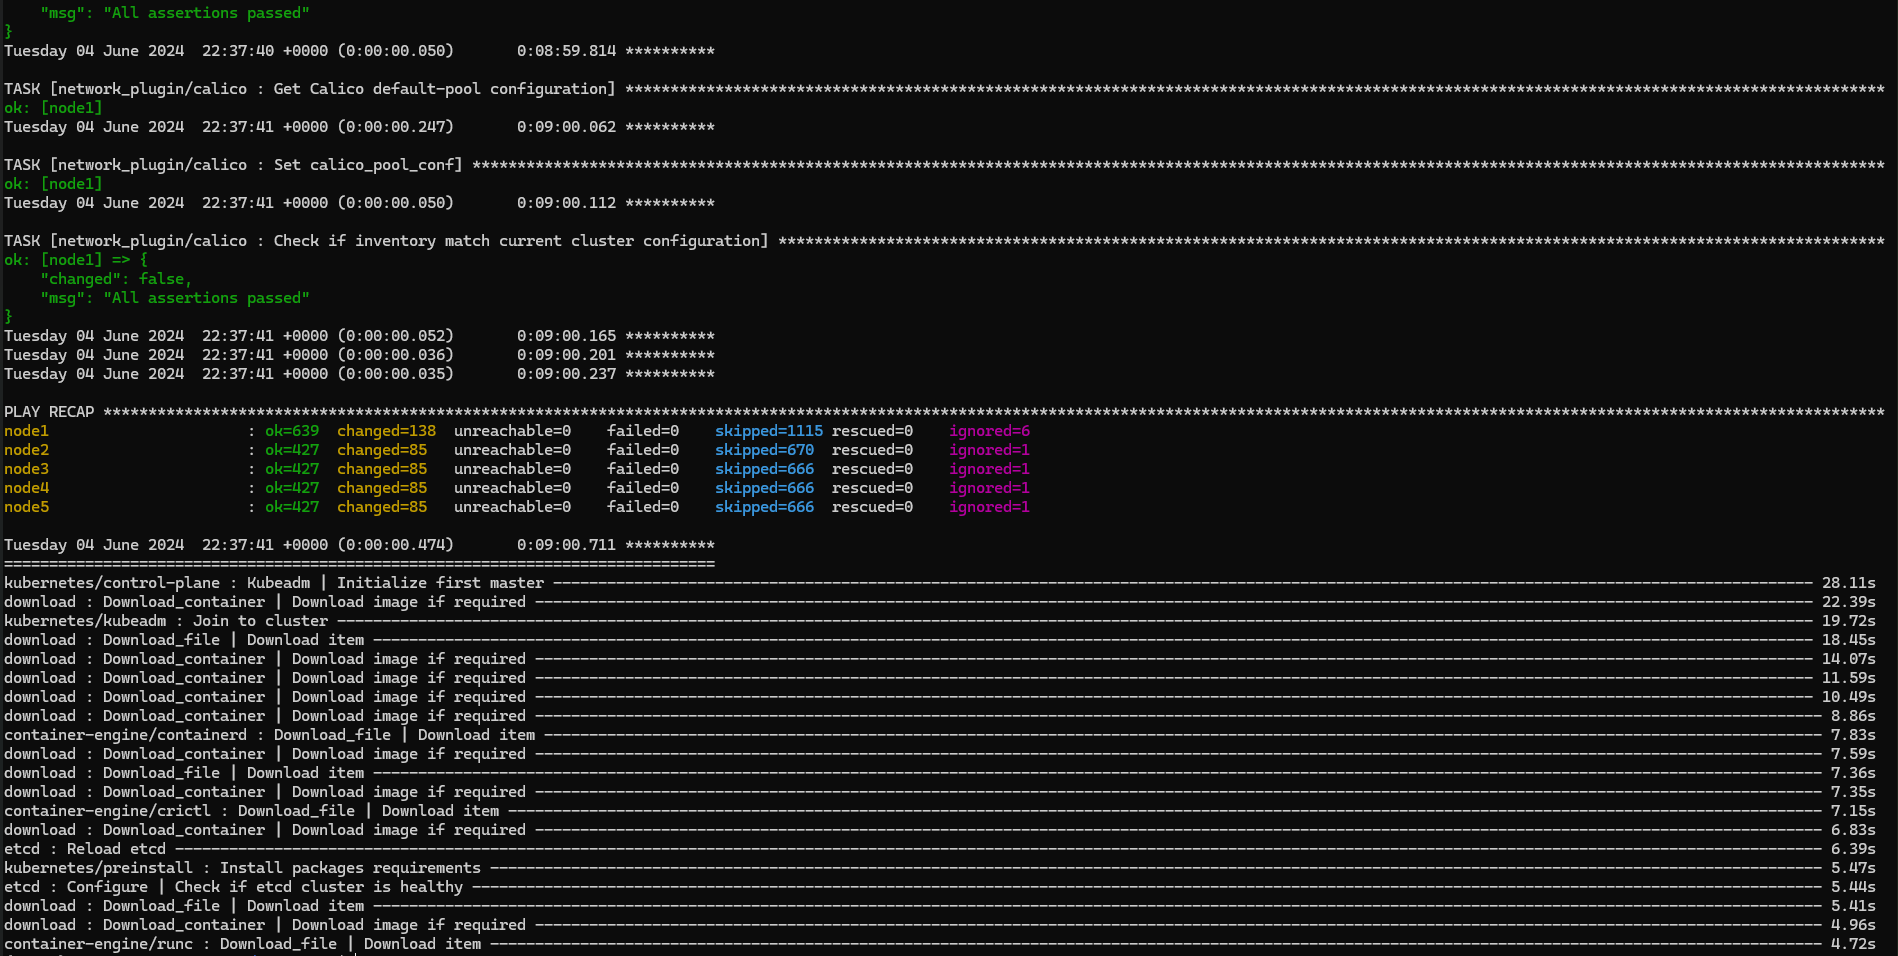
Now that the K8s cluster is deployed, connect to the K8s Master Node for the following sections and use the root account (where the K8s cluster credentials are stored).
K8s Deployment Verification
Below is an output example of a K8s cluster with the deployment information and with default Kubespray configuration using the Calico K8s CNI plugin.
To ensure that the K8s cluster is installed correctly, run the following commands:
Master Node Console
root@node1:~# kubectl get nodes -o wide

NAME    STATUS   ROLES           AGE    VERSION   INTERNAL-IP   EXTERNAL-IP   OS-IMAGE             KERNEL-VERSION       CONTAINER-RUNTIME
node1   Ready    control-plane   2m8s   v1.29.0   10.10.1.1     <none>        Ubuntu 22.04.4 LTS   5.15.0-113-generic   containerd://1.7.16
node2   Ready    <none>          93s    v1.29.0   10.10.1.2     <none>        Ubuntu 22.04.4 LTS   5.15.0-113-generic   containerd://1.7.16
node3   Ready    <none>          92s    v1.29.0   10.10.1.3     <none>        Ubuntu 22.04.4 LTS   5.15.0-113-generic   containerd://1.7.16
node4   Ready    <none>          93s    v1.29.0   10.10.1.4     <none>        Ubuntu 22.04.4 LTS   5.15.0-113-generic   containerd://1.7.16
node5   Ready    <none>          93s    v1.29.0   10.10.1.5     <none>        Ubuntu 22.04.4 LTS   5.15.0-113-generic   containerd://1.7.16

root@node1:~# kubectl get pods -n kube-system -o wide
NAME                                       READY   STATUS    RESTARTS        AGE     IP               NODE    NOMINATED NODE   READINESS GATES
calico-kube-controllers-68485cbf9c-6sf4h   1/1     Running   0               62s     10.233.102.143   node1   <none>           <none>
calico-node-fxpxl                          1/1     Running   0               79s     10.10.1.2        node2   <none>           <none>
calico-node-k6qzp                          1/1     Running   0               79s     10.10.1.5        node5   <none>           <none>
calico-node-mh4pp                          1/1     Running   0               79s     10.10.1.4        node4   <none>           <none>
calico-node-mslh4                          1/1     Running   0               79s     10.10.1.3        node3   <none>           <none>
calico-node-ngnxx                          1/1     Running   0               79s     10.10.1.1        node1   <none>           <none>
coredns-69db55dd76-qq5mw                   1/1     Running   0               51s     10.233.75.23     node2   <none>           <none>
coredns-69db55dd76-qrl6q                   1/1     Running   0               54s     10.233.102.129   node1   <none>           <none>
dns-autoscaler-6f4b597d8c-5cmgz            1/1     Running   0               52s     10.233.102.130   node1   <none>           <none>
kube-apiserver-node1                       1/1     Running   1               2m15s   10.10.1.1        node1   <none>           <none>
kube-controller-manager-node1              1/1     Running   2               2m15s   10.10.1.1        node1   <none>           <none>
kube-proxy-2hfcg                           1/1     Running   0               98s     10.10.1.3        node3   <none>           <none>
kube-proxy-444mg                           1/1     Running   0               98s     10.10.1.2        node2   <none>           <none>
kube-proxy-52ctj                           1/1     Running   0               98s     10.10.1.4        node4   <none>           <none>
kube-proxy-7g9xv                           1/1     Running   0               98s     10.10.1.1        node1   <none>           <none>
kube-proxy-zg6t2                           1/1     Running   0               98s     10.10.1.5        node5   <none>           <none>
kube-scheduler-node1                       1/1     Running   1               2m14s   10.10.1.1        node1   <none>           <none>
nginx-proxy-node2                          1/1     Running   0               101s    10.10.1.2        node2   <none>           <none>
nginx-proxy-node3                          1/1     Running   0               101s    10.10.1.3        node3   <none>           <none>
nginx-proxy-node4                          1/1     Running   0               102s    10.10.1.4        node4   <none>           <none>
nginx-proxy-node5                          1/1     Running   0               102s    10.10.1.5        node5   <none>           <none>
nodelocaldns-7tnjx                         1/1     Running   0               52s     10.10.1.2        node2   <none>           <none>
nodelocaldns-qkm5t                         1/1     Running   0               52s     10.10.1.4        node4   <none>           <none>
nodelocaldns-rhd9g                         1/1     Running   0               52s     10.10.1.5        node5   <none>           <none>
nodelocaldns-tg5pm                         1/1     Running   0               52s     10.10.1.3        node3   <none>           <none>
nodelocaldns-wlwkn                         1/1     Running   0               52s     10.10.1.1        node1   <none>           <none>
NVIDIA Network Operator Installation
NVIDIA Network Operator leverages Kubernetes CRDs and Operator SDK to manage networking-related components and enable fast networking and RDMA for workloads in K8s cluster. The Fast Network is a secondary network of the K8s cluster for applications that require high bandwidth or low latency.
You need to provision and configure several components. Perform all operator configuration and installation steps from the K8S master node with the root user account.
Prerequisites
Install helm on the K8S master node:
Master Node Console
# wget https://get.helm.sh/helm-v3.15.1-linux-amd64.tar.gz
# tar -zxvf helm-v3.15.1-linux-amd64.tar.gz
# mv linux-amd64/helm /usr/local/bin/helm
Label the worker nodes:
Master Node Console
# for i in $(seq 2 5); do kubectl label nodes node$i node-role.kubernetes.io/worker=; done
node/node2 labeled
node/node3 labeled
node/node4 labeled
node/node5 labeled
# kubectl get nodes
NAME    STATUS   ROLES           AGE   VERSION
node1   Ready    control-plane   12d   v1.29.0
node2   Ready    worker          12d   v1.29.0
node3   Ready    worker          12d   v1.29.0
node4   Ready    worker          12d   v1.29.0
node5   Ready    worker          12d   v1.29.0
Note
K8s Worker Node labeling is required for a proper installation of the NVIDIA Network Operator.
Deployment
Add the NVIDIA Network Operator Helm repository:
Master Node Console
# helm repo add nvidia https://helm.ngc.nvidia.com/nvidia
# helm repo update
Install the operator with custom values; use a configuration file to override some of the default values.
Generate the values.yaml file:
Master Node Console
# helm show values nvidia/network-operator --version v24.4.0 > values.yaml
Edit the values.yaml file to enable SR-IOV support, the secondary network for K8S pods, and to install the MLNX_OFED driver as part of the operator deployment (necessary for GDR):
values.yaml
...
nfd:
  enabled: true
...
sriovNetworkOperator:
  enabled: true
...

# NicClusterPolicy CR values:
deployCR: true
ofedDriver:
  deploy: true
  env:
  - name: UNLOAD_STORAGE_MODULES
    value: "true"
...

rdmaSharedDevicePlugin:
  deploy: false
...

sriovDevicePlugin:
  deploy: false
...

secondaryNetwork:
  deploy: true
  cniPlugins:
    deploy: true
    ...
  multus:
    deploy: true
    ...
  ipamPlugin:
    deploy: true
Deploy the operator:
Master Node Console
# helm install --wait network-operator nvidia/network-operator -n nvidia-network-operator --create-namespace --version v24.4.0 -f ./values.yaml
After deployment, the SRIOV Network Operator is configured, and SriovNetworkNodePolicy and SriovNetwork are deployed.
You can speed up the deployment before you deploy the operator, by configuring SriovNetworkNodePool and setting the maxUnavailable parameter to 2 instead of 1 to drain more than 1 node at a time:
sriovnetwork-pool-config.yaml
apiVersion: sriovnetwork.openshift.io/v1
kind: SriovNetworkPoolConfig
metadata:
  name: worker
  namespace: nvidia-network-operator
spec:
  maxUnavailable: 2
  nodeSelector:
    matchLabels:
      node-role.kubernetes.io/worker: ""
Apply the file:
Master Node Console
# kubectl apply -f sriovnetwork-pool-config.yaml
Create the configuration files and apply them.
sriovnetwork-node-policy.yaml configuration file example:
sriovnetwork-node-policy.yaml
apiVersion: sriovnetwork.openshift.io/v1
kind: SriovNetworkNodePolicy
metadata:
  name: policy-1
  namespace: nvidia-network-operator
spec:
  deviceType: netdevice
  mtu: 8950
  nicSelector:
    vendor: "15b3"
    pfNames: ["enp63s0f0np0"]
  nodeSelector:
    feature.node.kubernetes.io/pci-15b3.present: "true"
  numVfs: 8
  priority: 90
  isRdma: true
  resourceName: sriov_rdma
sriovnetwork.yaml configuration file example:
sriovnetwork.yaml
apiVersion: sriovnetwork.openshift.io/v1
kind: SriovNetwork
metadata:
  name: "sriov20"
  namespace: nvidia-network-operator
spec:
  vlan: 20
  spoofChk: "off"
  networkNamespace: "default"
  resourceName: "sriov_rdma"
  capabilities: '{ "mac": true }'
  ipam: |-
    {
      "datastore": "kubernetes",
      "kubernetes": {
        "kubeconfig": "/etc/cni/net.d/whereabouts.d/whereabouts.kubeconfig"
      },
      "log_file": "/tmp/whereabouts.log",
      "log_level": "debug",
      "type": "whereabouts",
      "range": "192.168.20.0/24"
    }
  metaPlugins : |
    {
      "type": "rdma"
    }
Apply the configuration files described above:
Master Node Console
# kubectl apply -f sriovnetwork-node-policy.yaml
# kubectl apply -f sriovnetwork.yaml
Wait for all required pods to be spawned:
Master Node Console
# kubectl get pod -n nvidia-network-operator
NAME                                                              READY   STATUS    RESTARTS   AGE
cni-plugins-ds-bqpc5                                              1/1     Running   0          8h
cni-plugins-ds-c98p7                                              1/1     Running   0          8h
cni-plugins-ds-jrxss                                              1/1     Running   0          8h
cni-plugins-ds-z65q4                                              1/1     Running   0          8h
kube-multus-ds-fdfpq                                              1/1     Running   0          8h
kube-multus-ds-kq6hr                                              1/1     Running   0          8h
kube-multus-ds-lw666                                              1/1     Running   0          8h
kube-multus-ds-nx5tb                                              1/1     Running   0          8h
mofed-ubuntu22.04-7d7f9f998-ds-47t7q                              1/1     Running   0          8h
mofed-ubuntu22.04-7d7f9f998-ds-8hsl8                              1/1     Running   0          8h
mofed-ubuntu22.04-7d7f9f998-ds-rhq7v                              1/1     Running   0          8h
mofed-ubuntu22.04-7d7f9f998-ds-vmjxr                              1/1     Running   0          8h
network-operator-5b75d4455d-tdgqm                                 1/1     Running   0          8h
network-operator-node-feature-discovery-master-568478db7d-k8l55   1/1     Running   0          8h
network-operator-node-feature-discovery-worker-8r94l              1/1     Running   0          8h
network-operator-node-feature-discovery-worker-bm6sm              1/1     Running   0          8h
network-operator-node-feature-discovery-worker-d67xg              1/1     Running   0          8h
network-operator-node-feature-discovery-worker-pnrn9              1/1     Running   0          8h
network-operator-node-feature-discovery-worker-rgfrg              1/1     Running   0          8h
network-operator-sriov-network-operator-6478f68965-tqlbb          1/1     Running   0          8h
sriov-device-plugin-2nz4d                                         1/1     Running   0          8h
sriov-device-plugin-8x64x                                         1/1     Running   0          8h
sriov-device-plugin-vw7mh                                         1/1     Running   0          8h
sriov-device-plugin-x4fnx                                         1/1     Running   0          8h
sriov-device-plugin-zxlc8                                         1/1     Running   0          8h
sriov-network-config-daemon-2w42j                                 1/1     Running   0          8h
sriov-network-config-daemon-4t7bb                                 1/1     Running   0          8h
sriov-network-config-daemon-fvl66                                 1/1     Running   0          8h
sriov-network-config-daemon-gvjgh                                 1/1     Running   0          8h
sriov-network-config-daemon-srbhs                                 1/1     Running   0          8h
whereabouts-87wmm                                                 1/1     Running   0          8h
whereabouts-kkg9q                                                 1/1     Running   0          8h
whereabouts-qk4v2                                                 1/1     Running   0          8h
whereabouts-trx2q                                                 1/1     Running   0          8h
Verify that a network attachment definition is created for the network and that the allocatable resources now include sriov_rdma identical to the number of VFs:
NVIDIA GPU Operator Installation
The NVIDIA GPU Operator uses the operator framework within Kubernetes to automate the management of all NVIDIA software components needed to provision the GPU. These components include the NVIDIA drivers (to enable CUDA), the Kubernetes device plugin for the GPUs, the NVIDIA Container Runtime, automatic node labelling, DCGM based monitoring and others. For information on platform support and getting started, visit the official documentation repository.
Prerequisites
Install Helm on the K8S master node (done previously).
Deployment
Add the NVIDIA GPU Operator Helm repository (same as with Network Operator):
Master Node Console
# helm repo add nvidia https://helm.ngc.nvidia.com/nvidia
# helm repo update
Verify that NFD is running on the cluster (enabled through NVIDIA Network Operator). The output should be true for all the nodes:
Master Node Console
# kubectl get nodes -o json | jq '.items[].metadata.labels | keys | any(startswith("feature.node.kubernetes.io"))'
true
true
true
true
true
Deploy the GPU Operator, enable GPUDirect RDMA, and disable the NFD plugin as it is already running in the cluster:
Master Node Console
# helm install --wait gpu-operator -n nvidia-gpu-operator --create-namespace nvidia/gpu-operator --set nfd.enabled=false --set driver.rdma.enabled=true
NAME: gpu-operator
LAST DEPLOYED: Wed Jun 19 10:40:35 2024
NAMESPACE: nvidia-gpu-operator
STATUS: deployed
REVISION: 1
TEST SUITE: None
Wait for all required pods to be spawned:
Master Node Console
# kubectl get pods -n nvidia-gpu-operator
NAME                                       READY   STATUS      RESTARTS   AGE
gpu-feature-discovery-2mx2x                1/1     Running     0          11m
gpu-feature-discovery-gz5lm                1/1     Running     0          7m23s
gpu-feature-discovery-vxfvp                1/1     Running     0          14m
gpu-feature-discovery-wfhhl                1/1     Running     0          4m19s
gpu-operator-7bbf8bb6b7-6mnrl              1/1     Running     0          20d
nvidia-container-toolkit-daemonset-cg4h6   1/1     Running     0          11m
nvidia-container-toolkit-daemonset-d9xr5   1/1     Running     0          7m23s
nvidia-container-toolkit-daemonset-fqx7n   1/1     Running     0          14m
nvidia-container-toolkit-daemonset-qj2rg   1/1     Running     0          4m19s
nvidia-cuda-validator-8nmqs                0/1     Completed   0          5m51s
nvidia-cuda-validator-dk9q2                0/1     Completed   0          13m
nvidia-cuda-validator-mtmn8                0/1     Completed   0          2m44s
nvidia-cuda-validator-zb9lc                0/1     Completed   0          9m45s
nvidia-dcgm-exporter-227m9                 1/1     Running     0          11m
nvidia-dcgm-exporter-7lptj                 1/1     Running     0          7m23s
nvidia-dcgm-exporter-7pfvv                 1/1     Running     0          4m19s
nvidia-dcgm-exporter-cmg9x                 1/1     Running     0          14m
nvidia-device-plugin-daemonset-njjc7       1/1     Running     0          14m
nvidia-device-plugin-daemonset-nnqgs       1/1     Running     0          11m
nvidia-device-plugin-daemonset-p2hqd       1/1     Running     0          4m19s
nvidia-device-plugin-daemonset-zqmbh       1/1     Running     0          7m23s
nvidia-driver-daemonset-2vc5m              2/2     Running     0          8m11s
nvidia-driver-daemonset-gst7x              2/2     Running     0          15m
nvidia-driver-daemonset-hpw6m              2/2     Running     0          12m
nvidia-driver-daemonset-xbm7n              2/2     Running     0          5m4s
nvidia-mig-manager-5nph5                   1/1     Running     0          7m23s
nvidia-mig-manager-84txd                   1/1     Running     0          14m
nvidia-mig-manager-clfzv                   1/1     Running     0          4m19s
nvidia-mig-manager-npl2x                   1/1     Running     0          11m
nvidia-operator-validator-4h5rc            1/1     Running     0          11m
nvidia-operator-validator-8krdh            1/1     Running     0          4m19s
nvidia-operator-validator-8m7nk            1/1     Running     0          14m
nvidia-operator-validator-g9qwj            1/1     Running     0          7m23s
Verify that the allocatable resources now include gpu, and that the NVIDIA kernel modules are loaded successfully on the worker nodes (in addition to the regular kernel modules, the nvidia-peermem kernel module must be loaded to enable GDR):
Infrastructure Bandwidth Validation
Verify deployment and that you can reach link speed performance on the high speed network by using various tests:
-
RDMA
-
Iperf TCP
-
GPUDirect RDMA
-
DPDK
Each of the tests are described thoroughly. At the end of each test, you'll see the achieved performance, proving link speed performance.
Notes
-
Make sure that the servers are tuned for maximum performance (not covered in this document).
-
You must enable and configure IOMMU in passthrough mode (mainly relevant for Iperf and DPDK tests).
-
Make sure to implement each one of the optimizations described below to achieve maximum performance.
Optimizing Worker Nodes for Performance
Before starting the different tests and to accommodate performance-sensitive applications, optimize the worker nodes for better performance by enabling pod scheduling on exclusive cores that are mapped to the same NUMA node of the NIC. Also, enable IOMMU and set it to passthrough mode for better performance.
Configuring CPU and Topology Manager Policies
Drain the worker node and make the node unschedulable (the example uses node3):
Master Node Console
# kubectl drain node3 --delete-emptydir-data --force --ignore-daemonsets
On the worker node, make sure to use the root account:
Worker Node Console
$ sudo su -
Check to which NUMA node the NIC is wired:
Worker Node Console
# cat /sys/class/net/enp63s0f0np0/device/numa_node
0
In this example, the NIC is wired to NUMA node 0.
Check the NUMA nodes of the CPU and which cores are in NUMA node 0:
Worker Node Console
# lscpu | grep NUMA
NUMA node(s):                    2
NUMA node0 CPU(s):               0-23
NUMA node1 CPU(s):               24-47
In this example, the cores that are in NUMA node 0 are: 0-23.
Configure the kubelet service on the worker node (using the kubelet-config.yaml file):
-
The "cpuManagerPolicy" attribute specifies the selected CPU manger policy (which can be either "none" or "static").
-
The "reservedSystemCPUs" attribute defines an explicit CPU set for OS system daemons and Kubernetes system daemons. (To move the system daemons and the Kubernetes daemons to the explicit CPU set defined by this option, use other mechanisms outside Kubernetes).
-
The "topologyManagerPolicy" attribute specifies the selected policy for the topology manager ("none", "best-effort", "restricted", or "single-numa-node").
Set the cpuManagerPolicy to static, which allows containers in Guaranteed pods with integer CPU requests access to exclusive CPUs on the node. Reserve some cores for the system using the reservedSystemCPUs option (kubelet requires a CPU reservation greater than zero to be made when the static policy is enabled), and make sure they belong to NUMA 1 (because the NIC in the example is wired to NUMA node 0, use cores from NUMA 0 if the NIC is wired to NUMA node 1). Also, define the topology to be single-numa-node so it only allows a pod to be admitted if all requested CPUs and devices can be allocated from exactly one NUMA node:
/etc/kubernetes/kubelet-config.yaml
...
# enable CPU Manager and Topology Manager
cpuManagerPolicy: static
cpuManagerReconcilePeriod: 10s
reservedSystemCPUs: "44,45,46,47"
topologyManagerPolicy: single-numa-node
featureGates:
  CPUManager: true
...
When you change reservedSystemCPUs or cpuManagerPolicy, delete the /var/lib/kubelet/cpu_manager_state file and restart the kubelet service:
Worker Node Console
# systemctl stop kubelet
# rm -f /var/lib/kubelet/cpu_manager_state
# systemctl restart kubelet
Reenable scheduling on the specified worker node:
Master Node Console
# kubectl uncordon node3
To verify that the configuration is a success, schedule a pod in Guaranteed QoS class (make sure to schedule it on the specific node you just configured):
nginx.yaml
apiVersion: v1
kind: Pod
metadata:
  labels:
    app: nginx
  name: nginx
spec:
  affinity:
    nodeAffinity:
      requiredDuringSchedulingIgnoredDuringExecution:
        nodeSelectorTerms:
        - matchExpressions:
          - key: kubernetes.io/hostname
            operator: In
            values:
            - node3
  containers:
  - name: nginx
    image: nginx
    resources:
      limits:
        memory: "200Mi"
        cpu: "2"
      requests:
        memory: "200Mi"
        cpu: "2"
Apply the configuration file above and verify it is running on the desired node:
Master Node Console
# kubectl apply -f nginx.yaml
pod/nginx created
# kubectl get pods -o wide | grep nginx
nginx                                1/1     Running   0          3m57s   10.233.71.34    node3   <none>           <none>
ssh to the worker node on which it is running and issue the following commands:
Worker Node Console
# ssh node3
# crictl ps | grep nginx
c0fa7b5edac77       fffffc90d343c       4 minutes ago       Running             nginx                          0                   325e71bdb981d       nginx
# crictl inspect c0fa7b5edac77 | jq '.status.resources.linux.cpusetCpus'
"0-1"
The output displays exclusive cores (0-1), which are located in NUMA node 0 as the NIC in the example.
Enable IOMMU in Passthrough Mode
Modify the GRUB_CMDLINE_LINUX_DEFAULT parameter in the /etc/default/grub file and configure IOMMU in passthrough mode:
Worker Node Console
# vi /etc/default/grub
...
GRUB_CMDLINE_LINUX_DEFAULT="iommu=pt"
...
Apply the new configuration to grub by running the command below and reboot the host (remember to enable IOMMU on the BIOS in case it is disabled):
Worker Node Console
# update-grub
# reboot
When the worker nodes are back up, verify that the IOMMU configuration is applied correctly by running the following ansible command from the depserver:
Depserver Node Console
user@depserver:~/kubespray$ ansible -m shell -a "dmesg | grep 'type: Passthrough'" -i inventory/mycluster/hosts.yaml kube_node --become
node2 | CHANGED | rc=0 >>
[    3.051710] iommu: Default domain type: Passthrough (set via kernel command line)
node3 | CHANGED | rc=0 >>
[    3.067741] iommu: Default domain type: Passthrough (set via kernel command line)
node4 | CHANGED | rc=0 >>
[    3.174857] iommu: Default domain type: Passthrough (set via kernel command line)
node5 | CHANGED | rc=0 >>
[    3.190489] iommu: Default domain type: Passthrough (set via kernel command line)
Performance Tests
RoCE Bandwidth Test
-
-
Create a test DaemonSet using the following YAML to create a pod on every node that you can use to test RDMA connectivity and performance over the high-speed network.
Notice that the YAML includes an annotation referencing the required network ("sriov20") and has resource requests for a single SRIOV virtual function ("nvidia,com/sriov_rdma").
The container image specified below must include NVIDIA user space drivers and perftest.
example-daemon.yaml
apiVersion: apps/v1 kind: DaemonSet metadata: name: example-daemon labels: app: example-dae spec: selector: matchLabels: app: example-dae template: metadata: labels: app: example-dae annotations: k8s.v1.cni.cncf.io/networks: sriov20 spec: containers: - image: <container_image> name: example-dae-pod securityContext: capabilities: add: [ "IPC_LOCK" ] resources: limits: memory: 16Gi cpu: 8 nvidia.com/sriov_rdma: '1' requests: memory: 16Gi cpu: 8 nvidia.com/sriov_rdma: '1' command: - sleep - inf -
Apply the resource.
Master Node Console
# kubectl apply -f example-daemon.yaml -
Validate that the daemon set is running successfully. You should see four pods running, one on each worker node.
Master Node Console
# kubectl get pod -o wide
NAME                   READY   STATUS    RESTARTS   AGE   IP              NODE    NOMINATED NODE   READINESS GATES
example-daemon-l52tb   1/1     Running   0          6s    10.233.75.54    node2   <none>           <none>
example-daemon-p7xt8   1/1     Running   0          6s    10.233.97.173   node5   <none>           <none>
example-daemon-phmcm   1/1     Running   0          6s    10.233.71.20    node3   <none>           <none>
example-daemon-pvjcs   1/1     Running   0          6s    10.233.74.86    node4   <none>           <none>
-
-
Now that the test DaemonSet is running, run a performance test to check the RDMA performance between two pods running on two different worker nodes.
-
Connect to one of the pods in the DaemonSet.
Master Node Console
# kubectl exec -it example-daemon-l52tb -- bash -
From within the container, check its IP address on the high-speed network interface (net1) and see that it is recognizable as an RDMA device.
First pod console
root@example-daemon-l52tb:/# ip a 1: lo: <LOOPBACK,UP,LOWER_UP> mtu 65536 qdisc noqueue state UNKNOWN group default qlen 1000 link/loopback 00:00:00:00:00:00 brd 00:00:00:00:00:00 inet 127.0.0.1/8 scope host lo valid_lft forever preferred_lft forever inet6 ::1/128 scope host valid_lft forever preferred_lft forever 2: eth0@if84: <BROADCAST,MULTICAST,UP,LOWER_UP> mtu 1450 qdisc noqueue state UP group default qlen 1000 link/ether ba:c6:9c:98:99:e0 brd ff:ff:ff:ff:ff:ff link-netnsid 0 inet 10.233.75.54/32 scope global eth0 valid_lft forever preferred_lft forever inet6 fe80::b8c6:9cff:fe98:99e0/64 scope link valid_lft forever preferred_lft forever 65: net1: <BROADCAST,MULTICAST,UP,LOWER_UP> mtu 8950 qdisc mq state UP group default qlen 1000 link/ether 0e:4a:41:e5:71:9c brd ff:ff:ff:ff:ff:ff inet 192.168.20.16/24 brd 192.168.20.255 scope global net1 valid_lft forever preferred_lft forever inet6 fe80::c4a:41ff:fee5:719c/64 scope link valid_lft forever preferred_lft forever root@example-daemon-l52tb:/# rdma link link rocep63s0f0v4/1 state ACTIVE physical_state LINK_UP netdev net1 -
Start the ib_write_bw server side.
First pod console
root@example-daemon-l52tb:/# ib_write_bw -a -F -q 4 --report_gbits
************************************
* Waiting for client to connect... *
************************************
-
Using another console window, reconnect to the master node and connect to the second pod in the deployment.
Master Node Console
# kubectl exec -it example-daemon-p7xt8 -- bash -
Repeat the steps above to verify it has a high speed network interface that is recognizable as a RDMA device.
-
-
From within the container, start the ib_write_bw client (use the IP address from the server side container).
Verify that the maximum bandwidth between containers reaches more than 190 Gb/s.Second pod console
root@example-daemon-p7xt8:/# ib_write_bw -a -F -q 4 --report_gbits 192.168.20.16
---------------------------------------------------------------------------------------
                    RDMA_Write BW Test
 Dual-port       : OFF          Device         : rocep63s0f0v7
 Number of qps   : 4            Transport type : IB
 Connection type : RC           Using SRQ      : OFF
 PCIe relax order: ON
 ibv_wr* API     : ON
 TX depth        : 128
 CQ Moderation   : 100
 Mtu             : 4096[B]
 Link type       : Ethernet
 GID index       : 3
 Max inline data : 0[B]
 rdma_cm QPs     : OFF
 Data ex. method : Ethernet
---------------------------------------------------------------------------------------
 local address: LID 0000 QPN 0x01cc PSN 0x5283ae RKey 0x048f07 VAddr 0x007f7f2b956000
 GID: 00:00:00:00:00:00:00:00:00:00:255:255:192:168:20:21
 local address: LID 0000 QPN 0x01cd PSN 0x9fcf00 RKey 0x048f07 VAddr 0x007f7f2c156000
 GID: 00:00:00:00:00:00:00:00:00:00:255:255:192:168:20:21
 local address: LID 0000 QPN 0x01ce PSN 0x76a44a RKey 0x048f07 VAddr 0x007f7f2c956000
 GID: 00:00:00:00:00:00:00:00:00:00:255:255:192:168:20:21
 local address: LID 0000 QPN 0x01cf PSN 0x7d0ed1 RKey 0x048f07 VAddr 0x007f7f2d156000
 GID: 00:00:00:00:00:00:00:00:00:00:255:255:192:168:20:21
 remote address: LID 0000 QPN 0x016c PSN 0xf537cb RKey 0x030f07 VAddr 0x007ffaae24a000
 GID: 00:00:00:00:00:00:00:00:00:00:255:255:192:168:20:16
 remote address: LID 0000 QPN 0x016d PSN 0x748d59 RKey 0x030f07 VAddr 0x007ffaaea4a000
 GID: 00:00:00:00:00:00:00:00:00:00:255:255:192:168:20:16
 remote address: LID 0000 QPN 0x016e PSN 0x1ba62f RKey 0x030f07 VAddr 0x007ffaaf24a000
 GID: 00:00:00:00:00:00:00:00:00:00:255:255:192:168:20:16
 remote address: LID 0000 QPN 0x016f PSN 0x8e9b52 RKey 0x030f07 VAddr 0x007ffaafa4a000
 GID: 00:00:00:00:00:00:00:00:00:00:255:255:192:168:20:16
---------------------------------------------------------------------------------------
 #bytes     #iterations    BW peak[Gb/sec]    BW average[Gb/sec]   MsgRate[Mpps]
 2          20000           0.045390            0.045313            2.832047
 4          20000           0.091348            0.091268            2.852139
 8          20000            0.18               0.18               2.853169
 16         20000            0.37               0.36               2.850147
 32         20000            0.73               0.73               2.849719
 64         20000            1.46               1.46               2.854070
 128        20000            2.93               2.93               2.861795
 256        20000            5.85               5.85               2.854513
 512        20000            11.62              11.61              2.833429
 1024       20000            33.96              25.34              3.093360
 2048       20000            67.56              57.63              3.517562
 4096       20000            134.61             119.12             3.635178
 8192       20000            192.58             187.25             2.857281
 16384      20000            195.09             191.90             1.464081
 32768      20000            193.87             193.85             0.739461
 65536      20000            194.66             194.65             0.371261
 131072     20000            195.18             195.18             0.186135
 262144     20000            193.91             191.18             0.091160
 524288     20000            195.69             195.69             0.046655
 1048576    20000            195.80             195.80             0.023341
 2097152    20000            195.84             195.84             0.011673
 4194304    20000            195.87             195.87             0.005837
 8388608    20000            195.88             195.88             0.002919
---------------------------------------------------------------------------------------
iperf TCP Test
-
Create a test DaemonSet using the YAML from the previous example to create a pod on every node that you can use to test TCP connectivity and performance over the high-speed network. Note that the container image specified in the test must include iperf.
The example test above uses an iperf3 version (3.16) that supports multi thread and parallel client streams.
If you are using an older version for your testing, start multiple iperf3 servers, each on a different port and bind it to a different core to achieve best performance.
-
Connect to one of the pods in the DaemonSet.
Master Node Console
# kubectl exec -it example-daemon-tv626 -- bash -
From within the container, check its IP address on the high-speed network interface (net1).
First pod console
root@example-daemon-tv626:/# ip a 1: lo: <LOOPBACK,UP,LOWER_UP> mtu 65536 qdisc noqueue state UNKNOWN group default qlen 1000 link/loopback 00:00:00:00:00:00 brd 00:00:00:00:00:00 inet 127.0.0.1/8 scope host lo valid_lft forever preferred_lft forever inet6 ::1/128 scope host valid_lft forever preferred_lft forever 2: eth0@if90: <BROADCAST,MULTICAST,UP,LOWER_UP> mtu 1450 qdisc noqueue state UP group default qlen 1000 link/ether da:18:68:be:70:18 brd ff:ff:ff:ff:ff:ff link-netnsid 0 inet 10.233.75.36/32 scope global eth0 valid_lft forever preferred_lft forever inet6 fe80::d818:68ff:febe:7018/64 scope link valid_lft forever preferred_lft forever 84: net1: <BROADCAST,MULTICAST,UP,LOWER_UP> mtu 8950 qdisc mq state UP group default qlen 1000 link/ether 96:7f:6a:f0:54:5b brd ff:ff:ff:ff:ff:ff inet 192.168.20.18/24 brd 192.168.20.255 scope global net1 valid_lft forever preferred_lft forever inet6 fe80::947f:6aff:fef0:545b/64 scope link valid_lft forever preferred_lft forever -
Start an iperf3 server listener (make sure to bind it to the high speed interface).
First Pod Console
root@example-daemon-tv626:/# iperf3 -s -B 192.168.20.18 ----------------------------------------------------------- Server listening on 5201 (test #1) ----------------------------------------------------------- -
Use another console window to reconnect to the master node and connect to the second pod in the deployment.
Master Node Console
# kubectl exec -it example-daemon-n7kc4 -- bash -
From within the container, check its IP address on the high-speed network interface (net1).
Second pod console
root@example-daemon-n7kc4:/# ip a
1: lo: <LOOPBACK,UP,LOWER_UP> mtu 65536 qdisc noqueue state UNKNOWN group default qlen 1000
    link/loopback 00:00:00:00:00:00 brd 00:00:00:00:00:00
    inet 127.0.0.1/8 scope host lo
       valid_lft forever preferred_lft forever
    inet6 ::1/128 scope host
       valid_lft forever preferred_lft forever
2: eth0@if84: <BROADCAST,MULTICAST,UP,LOWER_UP> mtu 1450 qdisc noqueue state UP group default qlen 1000
    link/ether 86:14:2d:e7:80:73 brd ff:ff:ff:ff:ff:ff link-netnsid 0
    inet 10.233.74.65/32 scope global eth0
       valid_lft forever preferred_lft forever
    inet6 fe80::8414:2dff:fee7:8073/64 scope link
       valid_lft forever preferred_lft forever
75: net1: <BROADCAST,MULTICAST,UP,LOWER_UP> mtu 8950 qdisc mq state UP group default qlen 1000
    link/ether ee:f1:64:93:54:c9 brd ff:ff:ff:ff:ff:ff
    inet 192.168.20.21/24 brd 192.168.20.255 scope global net1
       valid_lft forever preferred_lft forever
    inet6 fe80::ecf1:64ff:fe93:54c9/64 scope link
       valid_lft forever preferred_lft forever
-
-
Start the iperf3 client and verify that it reaches above 190 Gb/s.
Second pod console
root@example-daemon-tv626:/# iperf3 -c 192.168.20.18 -B 192.168.20.21 -P 8 -t 30 -i 10
Connecting to host 192.168.20.18, port 5201
[  5] local 192.168.20.21 port 49789 connected to 192.168.20.18 port 5201
[  7] local 192.168.20.21 port 42701 connected to 192.168.20.18 port 5201
[  9] local 192.168.20.21 port 40905 connected to 192.168.20.18 port 5201
[ 11] local 192.168.20.21 port 36625 connected to 192.168.20.18 port 5201
[ 13] local 192.168.20.21 port 47409 connected to 192.168.20.18 port 5201
[ 15] local 192.168.20.21 port 52191 connected to 192.168.20.18 port 5201
[ 17] local 192.168.20.21 port 50621 connected to 192.168.20.18 port 5201
[ 19] local 192.168.20.21 port 55499 connected to 192.168.20.18 port 5201
[ ID] Interval           Transfer     Bitrate         Retr  Cwnd
[  5]   0.00-10.01  sec  26.9 GBytes  23.1 Gbits/sec  449   2.61 MBytes
[  7]   0.00-10.01  sec  32.3 GBytes  27.7 Gbits/sec  183   1.82 MBytes
[  9]   0.00-10.01  sec  27.0 GBytes  23.1 Gbits/sec  451   2.96 MBytes
[ 11]   0.00-10.01  sec  32.4 GBytes  27.8 Gbits/sec  305   2.93 MBytes
[ 13]   0.00-10.01  sec  29.6 GBytes  25.4 Gbits/sec  171   1.85 MBytes
[ 15]   0.00-10.01  sec  24.2 GBytes  20.7 Gbits/sec  170   3.05 MBytes
[ 17]   0.00-10.01  sec  25.9 GBytes  22.3 Gbits/sec   74   2.98 MBytes
[ 19]   0.00-10.01  sec  28.5 GBytes  24.5 Gbits/sec  453   2.61 MBytes
[SUM]   0.00-10.01  sec   227 GBytes   195 Gbits/sec  2256
- - - - - - - - - - - - - - - - - - - - - - - - -
...
...
...
- - - - - - - - - - - - - - - - - - - - - - - - -
[ ID] Interval           Transfer     Bitrate         Retr
[  5]   0.00-30.01  sec  80.4 GBytes  23.0 Gbits/sec  995             sender
[  5]   0.00-30.01  sec  80.4 GBytes  23.0 Gbits/sec                  receiver
[  7]   0.00-30.01  sec  92.1 GBytes  26.4 Gbits/sec  637             sender
[  7]   0.00-30.01  sec  92.1 GBytes  26.4 Gbits/sec                  receiver
[  9]   0.00-30.01  sec  82.4 GBytes  23.6 Gbits/sec  781             sender
[  9]   0.00-30.01  sec  82.4 GBytes  23.6 Gbits/sec                  receiver
[ 11]   0.00-30.01  sec  95.2 GBytes  27.3 Gbits/sec  801             sender
[ 11]   0.00-30.01  sec  95.2 GBytes  27.3 Gbits/sec                  receiver
[ 13]   0.00-30.01  sec  88.5 GBytes  25.3 Gbits/sec  580             sender
[ 13]   0.00-30.01  sec  88.5 GBytes  25.3 Gbits/sec                  receiver
[ 15]   0.00-30.01  sec  81.1 GBytes  23.2 Gbits/sec  674             sender
[ 15]   0.00-30.01  sec  81.1 GBytes  23.2 Gbits/sec                  receiver
[ 17]   0.00-30.01  sec  80.5 GBytes  23.1 Gbits/sec  691             sender
[ 17]   0.00-30.01  sec  80.5 GBytes  23.1 Gbits/sec                  receiver
[ 19]   0.00-30.01  sec  82.8 GBytes  23.7 Gbits/sec  1049             sender
[ 19]   0.00-30.01  sec  82.8 GBytes  23.7 Gbits/sec                  receiver
[SUM]   0.00-30.01  sec   683 GBytes   196 Gbits/sec  6208             sender
[SUM]   0.00-30.01  sec   683 GBytes   196 Gbits/sec                  receiver

iperf Done.
GPUDirect RDMA Test
Notes
-
Performing an optimal GPUDirect RDMA Benchmark test requires a server with PCIe Bridges. The network adapter and GPU used in this test must be located under the same PCIe Bridge device and associated with the same CPU NUMA Node.
-
You can use the "lspci -tv" command to display the device hierarchy and verify that the adapter or GPU PCI devices are hosted under the same PCIe Bridge.
-
You can use "lspci -vvv -s <PCI_Device_ID>" to identify the NUMA node associated with the adapter or GPU PCI devices.
-
-
In the servers used for this test, the Network-RDMA device (ConnectX-7) and GPU device (PCIe A100) share NUMA Node 0 and are connected under the same PCIe Bridge device.
-
For the GPUDirect RDMA benchmark test described in this section, the NVIDIA Network Operator and NVIDIA GPU Operator are installed with the appropriate drivers - MLNX_OFED and nvidia-peermem. Without them (and CUDA), GPUDirect RDMA does not work!
-
Some of the configurations applied in this section are not persistent; you must reapply the configuration after a server or instance reboot.
-
Prepare the setup for running GDR by applying the following steps on all of the worker nodes.
-
Install the mstflint tool to be able to perform firmware changes on your adapter.
Worker Node Console
# apt install -y mstflint -
Set the Advanced PCI settings firmware parameter on your adapter to true and reboot the host for the change to take effect.
Worker Node Console
# mstconfig -d 3f:00.0 -y set ADVANCED_PCI_SETTINGS=1 # reboot -
Increase the adapter’s maximum accumulated read requests and reboot the host.
Worker Node Console
# mstconfig -d 3f:00.0 -y set MAX_ACC_OUT_READ=44 # reboot-
The value of 44 maximum requests used in the example above is a best practice value for a 200Gb/s test over a server with a PCIe Gen4 CPU.
-
In some cases, you might have to increase the PCIe MaxReadReq size of the network device to 4KB using the setpci command to further optimize the bandwidth test results.
-
-
Verify that the adapter firmware parameters have been applied.
Worker Node Console
# mstconfig -d 3f:00.0 q | egrep "ADVANCED_PCI_SETTINGS|MAX_ACC_OUT_READ" MAX_ACC_OUT_READ 44 ADVANCED_PCI_SETTINGS True(1) -
Set the PCIe MaxReadReq size of the adapter to 4KB (the default is 512 bytes) and verify that the changes have been applied.
Worker Node Console
# setpci -s 3f:00.0 68.w=5000:f000 # lspci -s 3f:00.0 -vvv | grep MaxReadReq MaxPayload 256 bytes, MaxReadReq 4096 bytes -
Disable ACS on all PCIe bridge devices in the system.
-
IO virtualization (also known as, VT-d or IOMMU) can interfere with GPU Direct by redirecting all PCIe point-to-point traffic to the CPU root complex, causing a significant performance reduction or even a hang. Make sure that ACS is disabled on the PCIe. A Value of <flag> with ‘+' means enabled, while '-’ means disabled. Make sure all ACS flags are disabled.
-
In many server architectures, there are multiple chained PCIe Bridge devices serving a bulk of PCIe slots. The adapter and GPU might be connected to different sub devices in this PCIe bridge chain.
-
The provided script disables ACS on all PCIe Bridge devices in the system.
-
This step is not persistent and has to be re-applied every time you reboot the server.
Check the adapter.
Worker Node Console
# lspci -s 3f:00.0 -vvv | grep ACSCtl
ACSCtl: SrcValid- TransBlk- ReqRedir- CmpltRedir- UpstreamFwd- EgressCtrl- DirectTrans-
If enabled, run the following command:
Worker Node Console
# setpci -s 3f:00.0 f2a.w=0000Run the following script to ensure that the PCI Access Control List for all PCI bridges is disabled.
Worker Node Console
# for BDF in `lspci -d "*:*:*" | awk '{print $1}'`; do # skip if it doesn't support ACS sudo setpci -v -s ${BDF} ECAP_ACS+0x6.w > /dev/null 2>&1 if [ $? -ne 0 ]; then continue fi sudo setpci -v -s ${BDF} ECAP_ACS+0x6.w=0000 done -
-
-
Set the GPU clock speed to the maximum value - the example uses A100, in which the max allowed clock is 1410. Use the nvidia-smi command in the driver containers.
-
List all the driver pods.
Master Node Console
# kubectl get pods -n nvidia-gpu-operator | grep driver nvidia-driver-daemonset-8ngqz 2/2 Running 8 (5h20m ago) 13h nvidia-driver-daemonset-mt44z 2/2 Running 12 (5h15m ago) 13h nvidia-driver-daemonset-ncc8x 2/2 Running 11 (4h40m ago) 13h nvidia-driver-daemonset-nw52t 2/2 Running 8 (5h21m ago) 13h -
In each one of the pods, adjust the clock speed to 1410 (the example uses indexes 0 and 1 because there are two GPUs in each worker).
Master Node Console
# kubectl exec -it nvidia-driver-daemonset-8ngqz -n nvidia-gpu-operator -- nvidia-smi -i 0 -lgc 1410 GPU clocks set to "(gpuClkMin 1410, gpuClkMax 1410)" for GPU 00000000:3C:00.0 All done. # kubectl exec -it nvidia-driver-daemonset-8ngqz -n nvidia-gpu-operator -- nvidia-smi -i 1 -lgc 1410 GPU clocks set to "(gpuClkMin 1410, gpuClkMax 1410)" for GPU 00000000:40:00.0 All done. ... -
Verify the new value is set correctly with the dcgm-exporter endpoint. Use the service Cluster IP for query and DCGM_FI_DEV_SM_CLOCK metric.
Master Node Console
# kubectl get svc -n nvidia-gpu-operator
NAME                   TYPE        CLUSTER-IP      EXTERNAL-IP   PORT(S)    AGE
gpu-operator           ClusterIP   10.233.29.218   <none>        8080/TCP   7d21h
nvidia-dcgm-exporter   ClusterIP   10.233.24.139   <none>        9400/TCP   7d21h

# for i in $(seq 1 4); do curl -s 10.233.24.139:9400/metrics | grep "DCGM_FI_DEV_SM_CLOCK{"; done
DCGM_FI_DEV_SM_CLOCK{gpu="0",UUID="GPU-e4031089-4e6f-da56-ba01-fe13a26bd050",device="nvidia0",modelName="NVIDIA A100-PCIE-40GB",Hostname="node2",DCGM_FI_DRIVER_VERSION="550.54.15"} 1410
DCGM_FI_DEV_SM_CLOCK{gpu="1",UUID="GPU-c25937b2-2a78-bff9-b213-2359d296300c",device="nvidia1",modelName="NVIDIA A100-PCIE-40GB",Hostname="node2",DCGM_FI_DRIVER_VERSION="550.54.15"} 1410
DCGM_FI_DEV_SM_CLOCK{gpu="0",UUID="GPU-9f469254-473d-22ed-c524-57fe28c44f91",device="nvidia0",modelName="NVIDIA A100-PCIE-40GB",Hostname="node3",DCGM_FI_DRIVER_VERSION="550.54.15"} 1410
DCGM_FI_DEV_SM_CLOCK{gpu="1",UUID="GPU-dd1fa1c5-fe82-35fb-4df5-55fc19793488",device="nvidia1",modelName="NVIDIA A100-PCIE-40GB",Hostname="node3",DCGM_FI_DRIVER_VERSION="550.54.15"} 1410
DCGM_FI_DEV_SM_CLOCK{gpu="0",UUID="GPU-516c8879-9187-bebe-5705-a08a852fc1ba",device="nvidia0",modelName="NVIDIA A100-PCIE-40GB",Hostname="node5",DCGM_FI_DRIVER_VERSION="550.54.15"} 1410
DCGM_FI_DEV_SM_CLOCK{gpu="1",UUID="GPU-b422c6d8-5b48-1a26-7d9a-d4a439cdf152",device="nvidia1",modelName="NVIDIA A100-PCIE-40GB",Hostname="node5",DCGM_FI_DRIVER_VERSION="550.54.15"} 1410
DCGM_FI_DEV_SM_CLOCK{gpu="0",UUID="GPU-89373171-3f52-c598-ddc0-3b79a6e5cb17",device="nvidia0",modelName="NVIDIA A100-PCIE-40GB",Hostname="node4",DCGM_FI_DRIVER_VERSION="550.54.15"} 1410
DCGM_FI_DEV_SM_CLOCK{gpu="1",UUID="GPU-72a692f2-7851-74a2-6ddc-35c81f162821",device="nvidia1",modelName="NVIDIA A100-PCIE-40GB",Hostname="node4",DCGM_FI_DRIVER_VERSION="550.54.15"} 1410
-
-
Create a DaemonSet using the following yaml file. The example uses the mellanox/cuda-perftest image to be able to use GDR-enabled ib_write_bw.
cudaperf-daemon.yaml
apiVersion: apps/v1 kind: DaemonSet metadata: name: cudaperf-daemon labels: app: cudaperf-dae spec: selector: matchLabels: app: cudaperf-dae template: metadata: labels: app: cudaperf-dae annotations: k8s.v1.cni.cncf.io/networks: sriov20 spec: containers: - image: mellanox/cuda-perftest:latest name: cudaperf-dae-pod securityContext: capabilities: add: [ "IPC_LOCK" ] resources: limits: memory: 16Gi cpu: 8 nvidia.com/sriov_rdma: '1' nvidia.com/gpu: '1' requests: memory: 16Gi cpu: 8 nvidia.com/sriov_rdma: '1' nvidia.com/gpu: '1' command: - sleep - inf -
Verify the adapter bandwidth with GDR.
-
Connect to one of the pods in the daemon set.
Master Node Console
# kubectl exec -it cudaperf-daemon-8krhz -- bash -
Make sure that the network adapter and the GPU are connected on the same PCIe switch (look for either PIX or PXB output).
First Pod Console
root@cudaperf-daemon-8krhz:~# nvidia-smi topo -m GPU0 NIC0 CPU Affinity NUMA Affinity GPU NUMA ID GPU0 X PIX 0-7 0 N/A NIC0 PIX X Legend: X = Self SYS = Connection traversing PCIe as well as the SMP interconnect between NUMA nodes (e.g., QPI/UPI) NODE = Connection traversing PCIe as well as the interconnect between PCIe Host Bridges within a NUMA node PHB = Connection traversing PCIe as well as a PCIe Host Bridge (typically the CPU) PXB = Connection traversing multiple PCIe bridges (without traversing the PCIe Host Bridge) PIX = Connection traversing at most a single PCIe bridge NV# = Connection traversing a bonded set of # NVLinks NIC Legend: NIC0: rocep63s0f0v5 -
Start the ib_write_bw server side with the --use_cuda flag.
First Pod Console
root@cudaperf-daemon-8krhz:~# ib_write_bw -a -F --report_gbits -q 4 --use_cuda 0 ************************************ * Waiting for client to connect... * ************************************ -
Connect to another pod in the daemon set.
Master Node Console
# kubectl exec -it cudaperf-daemon-xdchn -- bash -
Verify GPU and network adapter affinity.
Second Pod Console
root@cudaperf-daemon-xdchn:~# nvidia-smi topo -m GPU0 NIC0 CPU Affinity NUMA Affinity GPU NUMA ID GPU0 X PIX 0-7 0 N/A NIC0 PIX X Legend: X = Self SYS = Connection traversing PCIe as well as the SMP interconnect between NUMA nodes (e.g., QPI/UPI) NODE = Connection traversing PCIe as well as the interconnect between PCIe Host Bridges within a NUMA node PHB = Connection traversing PCIe as well as a PCIe Host Bridge (typically the CPU) PXB = Connection traversing multiple PCIe bridges (without traversing the PCIe Host Bridge) PIX = Connection traversing at most a single PCIe bridge NV# = Connection traversing a bonded set of # NVLinks NIC Legend: NIC0: rocep63s0f0v2 -
Start the ib_write_bw client with the --use_cuda flag and the IP address of the first pod, and verify that the speed is above 190 Gb/sec.
Second Pod Console
root@cudaperf-daemon-xdchn:~# ib_write_bw -a -F --report_gbits -q 4 --use_cuda 0 192.168.20.23 initializing CUDA Listing all CUDA devices in system: CUDA device 0: PCIe address is 40:00 Picking device No. 0 [pid = 20, dev = 0] device name = [NVIDIA A100-PCIE-40GB] creating CUDA Ctx making it the current CUDA Ctx cuMemAlloc() of a 67108864 bytes GPU buffer allocated GPU buffer address at 00007fbe28000000 pointer=0x7fbe28000000 --------------------------------------------------------------------------------------- RDMA_Write BW Test Dual-port : OFF Device : rocep63s0f0v2 Number of qps : 4 Transport type : IB Connection type : RC Using SRQ : OFF PCIe relax order: ON ibv_wr* API : ON TX depth : 128 CQ Moderation : 100 Mtu : 4096[B] Link type : Ethernet GID index : 3 Max inline data : 0[B] rdma_cm QPs : OFF Data ex. method : Ethernet --------------------------------------------------------------------------------------- local address: LID 0000 QPN 0x00f0 PSN 0xe967be RKey 0x010f08 VAddr 0x007fbe2a000000 GID: 00:00:00:00:00:00:00:00:00:00:255:255:192:168:20:18 local address: LID 0000 QPN 0x00f1 PSN 0x8549d0 RKey 0x010f08 VAddr 0x007fbe2a800000 GID: 00:00:00:00:00:00:00:00:00:00:255:255:192:168:20:18 local address: LID 0000 QPN 0x00f2 PSN 0x42ceda RKey 0x010f08 VAddr 0x007fbe2b000000 GID: 00:00:00:00:00:00:00:00:00:00:255:255:192:168:20:18 local address: LID 0000 QPN 0x00f3 PSN 0x688e21 RKey 0x010f08 VAddr 0x007fbe2b800000 GID: 00:00:00:00:00:00:00:00:00:00:255:255:192:168:20:18 remote address: LID 0000 QPN 0x0270 PSN 0x6fe017 RKey 0x070f08 VAddr 0x007ff498000000 GID: 00:00:00:00:00:00:00:00:00:00:255:255:192:168:20:23 remote address: LID 0000 QPN 0x0271 PSN 0xf27db5 RKey 0x070f08 VAddr 0x007ff498800000 GID: 00:00:00:00:00:00:00:00:00:00:255:255:192:168:20:23 remote address: LID 0000 QPN 0x0272 PSN 0x7da55b RKey 0x070f08 VAddr 0x007ff499000000 GID: 00:00:00:00:00:00:00:00:00:00:255:255:192:168:20:23 remote address: LID 0000 QPN 0x0273 PSN 0x19c90e RKey 0x070f08 VAddr 0x007ff499800000 GID: 00:00:00:00:00:00:00:00:00:00:255:255:192:168:20:23 --------------------------------------------------------------------------------------- #bytes #iterations BW peak[Gb/sec] BW average[Gb/sec] MsgRate[Mpps] 2 20000 0.045310 0.045232 2.827029 4 20000 0.091674 0.088883 2.777584 8 20000 0.18 0.18 2.866542 16 20000 0.37 0.37 2.863911 32 20000 0.73 0.73 2.864631 64 20000 1.47 1.47 2.864966 128 20000 2.93 2.93 2.863358 256 20000 5.87 5.87 2.864869 512 20000 11.74 11.73 2.864219 1024 20000 23.47 23.45 2.862455 2048 20000 46.85 46.82 2.857363 4096 20000 93.96 93.86 2.864305 8192 20000 187.75 187.71 2.864201 16384 20000 195.78 195.70 1.493081 32768 20000 195.77 195.73 0.746669 65536 20000 195.77 195.76 0.373390 131072 20000 195.56 195.09 0.186055 262144 20000 195.78 195.78 0.093354 524288 20000 195.83 195.83 0.046690 1048576 20000 195.84 195.84 0.023346 2097152 20000 195.82 195.81 0.011671 4194304 20000 198.88 198.88 0.005927 8388608 20000 195.84 195.84 0.002918 --------------------------------------------------------------------------------------- deallocating RX GPU buffer 00007fbe28000000 destroying current CUDA Ctx -
Summary view in the first pod.
First Pod Console
root@cudaperf-daemon-8krhz:~# ib_write_bw -a -F --report_gbits -q 4 --use_cuda 0

************************************
* Waiting for client to connect... *
************************************
initializing CUDA
Listing all CUDA devices in system:
CUDA device 0: PCIe address is 40:00

Picking device No. 0
[pid = 22, dev = 0] device name = [NVIDIA A100-PCIE-40GB]
creating CUDA Ctx
making it the current CUDA Ctx
cuMemAlloc() of a 67108864 bytes GPU buffer
allocated GPU buffer address at 00007ff496000000 pointer=0x7ff496000000
---------------------------------------------------------------------------------------
                    RDMA_Write BW Test
 Dual-port       : OFF          Device         : rocep63s0f0v5
 Number of qps   : 4            Transport type : IB
 Connection type : RC           Using SRQ      : OFF
 PCIe relax order: ON
 ibv_wr* API     : ON
 CQ Moderation   : 100
 Mtu             : 4096[B]
 Link type       : Ethernet
 GID index       : 3
 Max inline data : 0[B]
 rdma_cm QPs     : OFF
 Data ex. method : Ethernet
---------------------------------------------------------------------------------------
 local address: LID 0000 QPN 0x0270 PSN 0x6fe017 RKey 0x070f08 VAddr 0x007ff498000000
 GID: 00:00:00:00:00:00:00:00:00:00:255:255:192:168:20:23
 local address: LID 0000 QPN 0x0271 PSN 0xf27db5 RKey 0x070f08 VAddr 0x007ff498800000
 GID: 00:00:00:00:00:00:00:00:00:00:255:255:192:168:20:23
 local address: LID 0000 QPN 0x0272 PSN 0x7da55b RKey 0x070f08 VAddr 0x007ff499000000
 GID: 00:00:00:00:00:00:00:00:00:00:255:255:192:168:20:23
 local address: LID 0000 QPN 0x0273 PSN 0x19c90e RKey 0x070f08 VAddr 0x007ff499800000
 GID: 00:00:00:00:00:00:00:00:00:00:255:255:192:168:20:23
 remote address: LID 0000 QPN 0x00f0 PSN 0xe967be RKey 0x010f08 VAddr 0x007fbe2a000000
 GID: 00:00:00:00:00:00:00:00:00:00:255:255:192:168:20:18
 remote address: LID 0000 QPN 0x00f1 PSN 0x8549d0 RKey 0x010f08 VAddr 0x007fbe2a800000
 GID: 00:00:00:00:00:00:00:00:00:00:255:255:192:168:20:18
 remote address: LID 0000 QPN 0x00f2 PSN 0x42ceda RKey 0x010f08 VAddr 0x007fbe2b000000
 GID: 00:00:00:00:00:00:00:00:00:00:255:255:192:168:20:18
 remote address: LID 0000 QPN 0x00f3 PSN 0x688e21 RKey 0x010f08 VAddr 0x007fbe2b800000
 GID: 00:00:00:00:00:00:00:00:00:00:255:255:192:168:20:18
---------------------------------------------------------------------------------------
 #bytes     #iterations    BW peak[Gb/sec]    BW average[Gb/sec]   MsgRate[Mpps]
 8388608    20000            195.84             195.84             0.002918
---------------------------------------------------------------------------------------
-
DPDK
Notes
-
To perform the DPDK test, enable Huge Pages on the worker nodes. Kubernetes supports the allocation and consumption of pre-allocated HugePages by applications in a Pod. The nodes automatically discover and report all HugePages resources as schedulable resources. For additional information on K8s HugePages management, see here.
-
Performing an optimal DPDK Benchmark test requires IOMMU in passthrough mode.
-
TRex v3.03 is required to reach link speed performance for 200 Gb/sec adapters.
-
Prepare the setup to run the DPDK test by enabling huge pages (IOMMU in passthrough mode). In addition, perform adapter firmware tuning to achieve the best results.
-
Modify the GRUB_CMDLINE_LINUX_DEFAULT parameter in the /etc/default/grub file. The setting below allocates 1GB * 16 pages = 16GB and 2MB * 2048 pages= 4GB HugePages on boot time (the example uses only the 1GB pages).
Worker Node Console
# vi /etc/default/grub
...
GRUB_CMDLINE_LINUX_DEFAULT="default_hugepagesz=1G hugepagesz=1G hugepages=16 hugepagesz=2M hugepages=2048 iommu=pt"
...
Apply the new configuration to grub by running the command below and reboot the host.
Worker Node Console
# update-grub # reboot -
Verify that the new configuration is applied correctly. Check the huge pages allocation through the master node.
Master Node Console
# for i in $(seq 2 5); do kubectl get node node$i -o json | jq '.status.allocatable."hugepages-1Gi", .status.allocatable."hugepages-2Mi"'; done "16Gi" "4Gi" "16Gi" "4Gi" "16Gi" "4Gi" "16Gi" "4Gi" -
Enable relax ordering and CQE Compression for the ConnectX-7 adapter and reboot the host for the changes to take effect.
Worker Node Console
# mstconfig -d 3f:00.0 -y set PCI_WR_ORDERING=1 CQE_COMPRESSION=1 # reboot -
Verify that the changes have been applied correctly.
Worker Node Console
# mstconfig -d 3f:00.0 q | egrep "PCI_WR_ORDERING|CQE_COMPRESSION"
         CQE_COMPRESSION                     AGGRESSIVE(1)
         PCI_WR_ORDERING                     force_relax(1)
-
-
DPDK traffic emulation is shown in the Testbed Flow Diagram below. The traffic is pushed from the TRex pod through the SRIOV VF net1 interface to the TestPMD pod through the SRIOV network interface net1. The testPMD pod swaps the mac-address and reroutes ingress traffic through the same net1 interface to the same interface on TRex pod.
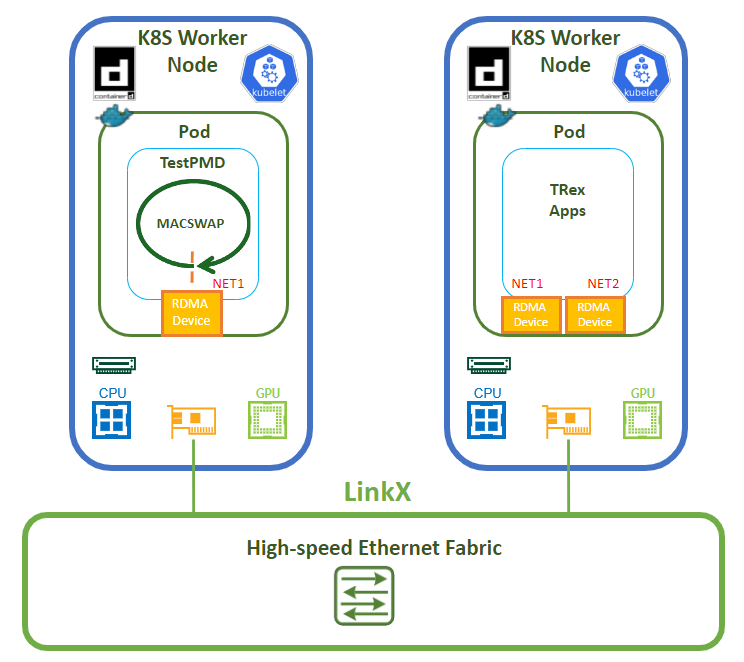
-
Create a sample pod dpdk-testpmd.yaml.
-
TestPMD and TRex image creation is not covered here; however, a brief description is included.
-
TestPMD (based on Ubuntu base image):
-
RDMA Core userspace components: rdma-core, ibverbs-utils.
-
MLNX_OFED: mlnx-ofed-dpdk.
-
-
TRex (based on CentOS base image):
-
RDMA Core userspace components: rdma-core-devel, libibverbs, libibverbs-devel.
-
Additional packages: hostname, iproute, net-tools, ethtool, nmap, iputils, perf, numactl, sysstat, htop.
-
dpdk-testpmd.yaml
apiVersion: v1 kind: Pod metadata: name: dpdk-testpmd labels: app: dpdk-testpmd annotations: k8s.v1.cni.cncf.io/networks: '[ { "name": "sriov20", "mac": "40:00:00:00:00:01" } ]' spec: containers: - image: <dpdk_testpmd_container-image> name: dpdk-testpmd-pod securityContext: capabilities: add: ["IPC_LOCK"] volumeMounts: - mountPath: /mnt/huge name: hugepage resources: limits: memory: 16Gi cpu: 8 hugepages-1Gi: 2Gi nvidia.com/sriov_rdma: '1' requests: memory: 16Gi cpu: 8 hugepages-1Gi: 2Gi nvidia.com/sriov_rdma: '1' command: ["sleep", "infinity"] volumes: - name: hugepage emptyDir: medium: HugePagesThe example assigns a specific MAC address (40:00:00:00:00:01) to the pod for convenience (this is possible because the sriovnetwork is created with MAC capability.
-
Apply the following yaml file.
Master Node Console
# kubectl apply -f dpdk-testpmd.yaml -
Verify that the pod is running successfully.
Master Node Console
# kubectl get pods NAME READY STATUS RESTARTS AGE dpdk-testpmd 1/1 Running 0 51m -
Connect to the pod.
Master Node Console
# kubectl exec -it dpdk-testpmd -- bashWithin the container, check the available network interfaces and to which PCI slot it is connected.
TestPMD Pod Console
root@dpdk-testpmd:~# ip a 1: lo: <LOOPBACK,UP,LOWER_UP> mtu 65536 qdisc noqueue state UNKNOWN group default qlen 1000 link/loopback 00:00:00:00:00:00 brd 00:00:00:00:00:00 inet 127.0.0.1/8 scope host lo valid_lft forever preferred_lft forever inet6 ::1/128 scope host valid_lft forever preferred_lft forever 2: eth0@if79: <BROADCAST,MULTICAST,UP,LOWER_UP> mtu 1450 qdisc noqueue state UP group default qlen 1000 link/ether ea:22:b8:49:88:f1 brd ff:ff:ff:ff:ff:ff link-netnsid 0 inet 10.233.75.19/32 scope global eth0 valid_lft forever preferred_lft forever inet6 fe80::e822:b8ff:fe49:88f1/64 scope link valid_lft forever preferred_lft forever 74: net1: <BROADCAST,MULTICAST,UP,LOWER_UP> mtu 8950 qdisc mq state UP group default qlen 1000 link/ether 40:00:00:00:00:01 brd ff:ff:ff:ff:ff:ff permaddr 56:80:e7:14:2b:de inet 192.168.20.23/24 brd 192.168.20.255 scope global net1 valid_lft forever preferred_lft forever inet6 fe80::4200:ff:fe00:1/64 scope link valid_lft forever preferred_lft forever root@dpdk-testpmd:~# rdma link link rocep63s0f0v7/1 state ACTIVE physical_state LINK_UP netdev net1 root@dpdk-testpmd:~# ls -l /sys/class/net/ | grep net1 lrwxrwxrwx 1 root root 0 Jul 23 12:58 net1 -> ../../devices/pci0000:20/0000:20:03.1/0000:25:00.0/0000:26:08.0/0000:3d:00.0/0000:3e:00.0/0000:3f:01.1/net/net1 -
Because the example uses a single-numa-node topology and deploys a pod in Guaranteed QoS class, it is bound to specific CPU cores on the host. In another console, SSH to the worker node on which the TestPMD is running to determine to which cores it is assigned.
Worker Node Console
# crictl ps | grep dpdk 8ef92f6d4fcb9 2fc8e5351239d 56 minutes ago Running dpdk-testpmd-pod 0 b6d3df7a1b00f dpdk-testpmd # crictl inspect 8ef92f6d4fcb9 | jq '.status.resources.linux.cpusetCpus' "0-7" -
Start the TestPMD application with the following command.
TestPMD Pod Console
root@dpdk-testpmd:~# dpdk-testpmd -l 0-7 -a 3f:01.1,mprq_en=1,rxqs_min_mprq=1,mprq_log_stride_num=9 -- --burst=64 --txd=2048 --rxd=2048 --mbcache=512 --rxq=8 --txq=8 --nb-cores=4 --rss-udp --forward-mode=macswap -a -i ... ... ... Configuring Port 0 (socket 0) mlx5_net: Port 0 Rx queue 0 size of a stride for Multi-Packet RQ is adjusted to match the mbuf size (1646) mlx5_net: Port 0 Rx queue 1 size of a stride for Multi-Packet RQ is adjusted to match the mbuf size (1646) mlx5_net: Port 0 Rx queue 2 size of a stride for Multi-Packet RQ is adjusted to match the mbuf size (1646) mlx5_net: Port 0 Rx queue 3 size of a stride for Multi-Packet RQ is adjusted to match the mbuf size (1646) mlx5_net: Port 0 Rx queue 4 size of a stride for Multi-Packet RQ is adjusted to match the mbuf size (1646) mlx5_net: Port 0 Rx queue 5 size of a stride for Multi-Packet RQ is adjusted to match the mbuf size (1646) mlx5_net: Port 0 Rx queue 6 size of a stride for Multi-Packet RQ is adjusted to match the mbuf size (1646) mlx5_net: Port 0 Rx queue 7 size of a stride for Multi-Packet RQ is adjusted to match the mbuf size (1646) Port 0: 00:00:00:00:00:00 Checking link statuses... Done Start automatic packet forwarding macswap packet forwarding - ports=1 - cores=4 - streams=8 - NUMA support enabled, MP allocation mode: native Logical Core 1 (socket 0) forwards packets on 2 streams: RX P=0/Q=0 (socket 0) -> TX P=0/Q=0 (socket 0) peer=02:00:00:00:00:00 RX P=0/Q=1 (socket 0) -> TX P=0/Q=1 (socket 0) peer=02:00:00:00:00:00 Logical Core 2 (socket 0) forwards packets on 2 streams: RX P=0/Q=2 (socket 0) -> TX P=0/Q=2 (socket 0) peer=02:00:00:00:00:00 RX P=0/Q=3 (socket 0) -> TX P=0/Q=3 (socket 0) peer=02:00:00:00:00:00 Logical Core 3 (socket 0) forwards packets on 2 streams: RX P=0/Q=4 (socket 0) -> TX P=0/Q=4 (socket 0) peer=02:00:00:00:00:00 RX P=0/Q=5 (socket 0) -> TX P=0/Q=5 (socket 0) peer=02:00:00:00:00:00 Logical Core 4 (socket 0) forwards packets on 2 streams: RX P=0/Q=6 (socket 0) -> TX P=0/Q=6 (socket 0) peer=02:00:00:00:00:00 RX P=0/Q=7 (socket 0) -> TX P=0/Q=7 (socket 0) peer=02:00:00:00:00:00 macswap packet forwarding packets/burst=64 nb forwarding cores=4 - nb forwarding ports=1 port 0: RX queue number: 8 Tx queue number: 8 Rx offloads=0x0 Tx offloads=0x0 RX queue: 0 RX desc=2048 - RX free threshold=64 RX threshold registers: pthresh=0 hthresh=0 wthresh=0 RX Offloads=0x0 TX queue: 0 TX desc=2048 - TX free threshold=0 TX threshold registers: pthresh=0 hthresh=0 wthresh=0 TX offloads=0x0 - TX RS bit threshold=0 testpmd>-
DPDK applications split command line arguments into arguments for the DPDK Environmental Abstraction Layer (EAL), which can be used by any DPDK application running on Linux and arguments for the application itself (TestPMD in our case). The two sets of arguments are separated using the standard convention of --.
-
Some of the EAL command line options used:
-
-l: List of cores to run on (0-7 in the examples).
-
-a: PCI device to use (3f:01.1 in the examples).
-
-
Some of the TestPMD command line options used:
-
--rxq/txq: Number of RX/TX queues per port.
-
--rxd/txd: Number of descriptors in the RX/TX rings.
-
--nb-cores: Number of forwarding cores (the examples do not use all of the listed cores).
-
-a: Start forwarding on initialization.
-
-i: Interactive mode.
-
-
-
-
Deploy the TRex pod. Create two ConfigMaps, one for configuration and one for the test file.
-
Create the trex-config.yaml ConfigMap.
trex-config.yaml
apiVersion: v1 kind: ConfigMap metadata: name: trex-config data: trex_cfg.yaml : | - port_limit: 2 version: 3 interfaces: - "{PCIDEVICE_1}" - "{PCIDEVICE_2}" port_bandwidth_gb: 200 port_info: - dest_mac: 40:00:00:00:00:01 src_mac: 30:00:00:00:00:01 - dest_mac: 40:00:00:00:00:01 src_mac: 30:00:00:00:00:02 platform: master_thread_id: {MASTER_CPU} latency_thread_id: {LATENCY_CPU} dual_if: - socket: 0 threads: [{CPUS}]-
The examples assign constant static MAC addresses for TRex interfaces due to MAC capability in the sriovnetwork.yaml. This is done for convenience purposes only.
-
The variables that are not statically configured and will be known when the pod itself is deployed:
-
PCIDEVICE_1/2: The PCI slot of the VFs that will be assigned to the pod (TRex requires at least two ports to start - the example simulates the traffic using only one of them).
-
MASTER_CPU: One of the CPUs from the assigned CPUs to the pod that will be used for master/UI.
-
LATENCY_CPU: One of the CPUs from the assigned CPUs to the pod that will be used for latency measurement.
-
CPUS: The rest of the CPUs from the assigned CPUs to the pod that aren't master/latency.
-
-
The example statically configures the socket to 0 because the network adapter is located there and the example uses single-numa-topology.
-
-
Create the trex-test.yaml ConfigMap.
trex-test.yaml
apiVersion: v1 kind: ConfigMap metadata: name: trex-test data: testpmd.py : | from trex_stl_lib.api import * class STLS1(object): def create_stream (self): pkt = Ether()/IP(src="16.0.0.1",dst="48.0.0.1")/UDP(dport=12)/({PAYLOAD_SIZE}*'x') vm = STLScVmRaw( [ STLVmFlowVar(name="v_port", min_value=4337, max_value=5337, size=2, op="inc"), STLVmWrFlowVar(fv_name="v_port", pkt_offset= "UDP.sport" ), STLVmFixChecksumHw(l3_offset="IP",l4_offset="UDP",l4_type=CTRexVmInsFixHwCs.L4_TYPE_UDP), ] ) return STLStream(packet = STLPktBuilder(pkt = pkt ,vm = vm ) , mode = STLTXCont(pps = 8000000) ) def get_streams (self, direction = 0, **kwargs): # create 1 stream return [ self.create_stream() ] # dynamic load - used for trex console or simulator def register(): return STLS1()PAYLOAD_SIZE: As the name implies, defines the UDP payload size.
-
Apply the configuration files described above.
Master Node Console
# kubectl apply -f trex-config.yaml # kubectl apply -f trex-test.yaml -
Create the trex.yaml Pod configuration file.
trex.yaml
apiVersion: v1 kind: Pod metadata: name: trex labels: app: trex annotations: k8s.v1.cni.cncf.io/networks: '[ { "name": "sriov20", "mac": "30:00:00:00:00:01" }, { "name": "sriov20", "mac": "30:00:00:00:00:02" } ]' spec: affinity: podAntiAffinity: requiredDuringSchedulingIgnoredDuringExecution: - labelSelector: matchExpressions: - key: app operator: In values: - dpdk-testpmd topologyKey: kubernetes.io/hostname containers: - image: <trex_container_image> name: trex securityContext: capabilities: add: ["IPC_LOCK", "SYS_RESOURCE", "NET_RAW", "NET_ADMIN"] volumeMounts: - name: trex-config mountPath: /opt/templates/ - name: trex-test mountPath: /opt/tests/ - mountPath: /mnt/huge name: hugepages - name: modules mountPath: /lib/modules resources: limits: memory: 1Gi cpu: 16 hugepages-1Gi: 8Gi nvidia.com/sriov_rdma: '2' requests: memory: 1Gi cpu: 16 hugepages-1Gi: 8Gi nvidia.com/sriov_rdma: '2' command: ["/bin/bash", "-c", "sleep INF"] volumes: - name: modules hostPath: path: /lib/modules - name: trex-config configMap: name: trex-config - name: trex-test configMap: name: trex-test - name: hugepages emptyDir: medium: HugePages -
Apply the configuration file described above.
Master Node Console
# kubectl apply -f trex.yaml -
Connect to the TRex pod.
Master Node Console
# kubectl exec -it trex -- bash -
Update the configuration file within the container. Based on the previous shown methods, determine on which cores the container is running and which PCI devices are attached.
TRex Pod Console
[root@trex trex]# cp /opt/templates/trex_cfg.yaml /etc/trex_cfg.yaml [root@trex trex]# cp /opt/tests/testpmd.py ./ [root@trex trex]# vi /etc/trex_cfg.yaml - port_limit: 2 version: 2 interfaces: - "3f:00.6" - "3f:00.5" port_bandwidth_gb: 200 port_info: - dest_mac: 40:00:00:00:00:01 src_mac: 30:00:00:00:00:01 - dest_mac: 40:00:00:00:00:01 src_mac: 30:00:00:00:00:02 platform: master_thread_id: 8 latency_thread_id: 23 dual_if: - socket: 0 threads: [9,10,11,12,13,14,15,16,17,18,19,20,21,22] [root@trex trex]# vi testpmd.py ... pkt = Ether()/IP(src="16.0.0.1",dst="48.0.0.1")/UDP(dport=12)/(1472*'x') ... -
Start TRex traffic generator using the following command.
TRex Pod Console
[root@trex trex]# ./t-rex-64 --no-ofed-check --no-hw-flow-stat -i -c 14 -
In another console, connect to the same TRex pod and run trex-console for visualization and traffic generation to the TestPMD pod.
TRex 2nd Pod Console
# kubectl exec -it trex -- bash
[root@trex trex]# ./trex-console

Using 'python3' as Python interpeter


Connecting to RPC server on localhost:4501                   [SUCCESS]


Connecting to publisher server on localhost:4500             [SUCCESS]


Acquiring ports [0, 1]:                                      [SUCCESS]


Server Info:

Server version:   v3.03 @ STL
Server mode:      Stateless
Server CPU:       14 x AMD EPYC 7F72 24-Core Processor
Ports count:      2 x 200Gbps @ ConnectX Family mlx5Gen Virtual Function

-=TRex Console v3.0=-

Type 'help' or '?' for supported actions

trex>tui
-
-
Start to generate traffic to the TestPMD pod and verify you can reach line rate performance.
TRex 2nd Pod Console
tui> start -f testpmd.py -m 100% -p 0
Global Statistics

connection   : localhost, Port 4501                       total_tx_L2  : 197.15 Gbps
version      : STL @ v3.03                                total_tx_L1  : 199.74 Gbps
cpu_util.    : 89.85% @ 14 cores (14 per dual port)       total_rx     : 197.02 Gbps
rx_cpu_util. : 0.0% / 0 pps                               total_pps    : 16.23 Mpps
async_util.  : 0% / 16.34 bps                             drop_rate    : 0 bps
total_cps.   : 0 cps                                      queue_full   : 438,273,395 pkts

Port Statistics

   port    |         0         |         1         |       total
-----------+-------------------+-------------------+------------------
owner      |              root |              root |
link       |                UP |                UP |
state      |      TRANSMITTING |              IDLE |
speed      |          200 Gb/s |          200 Gb/s |
CPU util.  |            89.85% |              0.0% |
--         |                   |                   |
Tx bps L2  |       197.15 Gbps |             0 bps |       197.15 Gbps
Tx bps L1  |       199.74 Gbps |             0 bps |       199.74 Gbps
Tx pps     |        16.23 Mpps |             0 pps |        16.23 Mpps
Line Util. |           99.87 % |               0 % |
---        |                   |                   |
Rx bps     |       197.02 Gbps |             0 bps |       197.02 Gbps
Rx pps     |        16.22 Mpps |             0 pps |        16.22 Mpps
----       |                   |                   |
Appendix
Validating the fabric
To validate the fabric, assign IP addresses to the servers. Each stretched VLAN acts as a local subnet to all the servers connected to it, so all the servers connected to the same VLAN must have IP addresses in the same subnet.
You can ARP between them and verify that they see each other on the same local subnet.
This example shows node1:
You can also validate on the switches that:
1) The IP addresses of the VTEPs are propagated by BGP to all the leaf switches successfully and all the server IP addresses are learned.
Repeat the following command on the leaf switches:
2) The ARP entries were successfully propagated by EVPN (the example verifies from leaf3), and examine the router MAC addresses corresponding to all remote VTEPs for symmetric routing.
3) EVPN-MH is configured and functioning properly on the infrastructure rack leaf switches: Global information, Ethernet Segment information, Ethernet Segment learned for each VNI and BGP Ethernet Segment information.
Done!
Authors

|
Guy Zilberman Guy Zilberman is a solution architect at NVIDIA's Networking Solutions Labs, bringing extensive experience from several leadership roles in cloud computing.
|
|
|
Vitaliy Razinkov Vitaliy Razinkov is a Solutions Architect on the NVIDIA Networking team, specializing in complex Kubernetes, OpenShift, and Microsoft solutions. With over 25 years of experience in senior technical roles, he brings deep expertise in designing and implementing advanced infrastructures. Vitaliy has authored several reference design guides on Microsoft technologies, RoCE/RDMA-accelerated machine learning in Kubernetes/OpenShift, and containerized solutions—all available on the NVIDIA Networking Documentation site. |


|
Shachar Dor Shachar Dor joined the Solutions Lab team after working more than ten years as a software architect at NVIDIA Networking (previously Mellanox Technologies), where he was responsible for the architecture of network management products and solutions. Shachar's focus is on networking technologies, especially around fabric bring-up, configuration, monitoring, and life-cycle management. |
Last updated: