Created on May 22, 2025
Scope
This Reference Deployment Guide (RDG) provides detailed instructions for setting up a centralized monitoring stack for DOCA Telemetry Service (DTS) instances running on NVIDIA BlueField-3 DPUs, deployed, and managed using DPF in a Kubernetes cluster.
Leveraging NVIDIA's DPF, administrators can provision and manage DPUs within a Kubernetes cluster while deploying and orchestrating infrastructure services such as HBN and accelerated OVN-Kubernetes. Together with DTS, this enables extensive monitoring of DPU resources. This approach fully utilizes NVIDIA DPU hardware acceleration and offloading capabilities, maximizing data center workload efficiency and performance.
The information is intended for experienced system administrators, system engineers, and solution architects who want to deploy a high-performance, DPU-enabled Kubernetes cluster and monitor its DPU resources.
-
This RDG assumes the user has already installed DPF, successfully provisioned the DPUs, and deployed different DOCA services (amongst them DOCA Telemetry Service).
-
For more information about DPF installation, refer to: RDG for DPF with OVN-Kubernetes and HBN Services - NVIDIA Docs.
-
This reference implementation, as the name implies, is a specific, opinionated deployment example designed to address the use case described above.
-
While other approaches may exist to implement similar solutions, this document provides a detailed guide for this particular method.
Abbreviations and Acronyms
|
Term |
Definition |
Term |
Definition |
|---|---|---|---|
|
DOCA |
Data Center Infrastructure-on-a-Chip Architecture |
K8S |
Kubernetes |
|
DPF |
DOCA Platform Framework |
OVN |
Open Virtual Network |
|
DPU |
Data Processing Unit |
PVC |
Persistent Volume Claim |
|
DTS |
DOCA Telemetry Service |
RDG |
Reference Deployment Guide |
|
HBN |
Host Based Networking |
TSDB |
Time Series Database |
Introduction
DOCA Platform Framework (DPF) is a system for provisioning and orchestrating NVIDIA BlueField DPUs and DPU services in a Kubernetes cluster.
DPF simplifies DPU management by providing orchestration through a Kubernetes API, handling DPU provisioning and lifecycle management, and enabling efficient deployment and orchestration of infrastructure services on DPUs.
One of those services is DOCA Telemetry Service (DTS), which collects data from built-in providers and external telemetry applications. DTS supports several export mechanisms, including a Prometheus endpoint that can be scraped by a Prometheus server. Using Grafana as a visualization platform for the collected data, users can conveniently monitor their DPU resources.
In large DPU clusters provisioned and managed by DPF, with associated DTS services running on them, an automated and scalable approach for monitoring those DTS instances is essential to prevent overburdening the cluster and system administrators.
By utilizing DPF orchestration capabilities, Kubernetes-native tools, and Prometheus service discovery, an efficient monitoring solution can be achieved.
This guide provides a practical example of such a solution, demonstrating how to enable centralized DPU monitoring.
References
Solution Architecture
Key Components and Technologies
-
NVIDIA BlueField® Data Processing Unit (DPU)
The NVIDIA® BlueField® data processing unit (DPU) ignites unprecedented innovation for modern data centers and supercomputing clusters. With its robust compute power and integrated software-defined hardware accelerators for networking, storage, and security, BlueField creates a secure and accelerated infrastructure for any workload in any environment, ushering in a new era of accelerated computing and AI.
-
NVIDIA DOCA Software Framework
NVIDIA DOCA™ unlocks the potential of the NVIDIA® BlueField® networking platform. By harnessing the power of BlueField DPUs and SuperNICs, DOCA enables the rapid creation of applications and services that offload, accelerate, and isolate data center workloads. It lets developers create software-defined, cloud-native, DPU- and SuperNIC-accelerated services with zero-trust protection, addressing the performance and security demands of modern data centers.
-
NVIDIA ConnectX SmartNICs
10/25/40/50/100/200 and 400G Ethernet Network Adapters
The industry-leading NVIDIA® ConnectX® family of smart network interface cards (SmartNICs) offer advanced hardware offloads and accelerations.
NVIDIA Ethernet adapters enable the highest ROI and lowest Total Cost of Ownership for hyperscale, public and private clouds, storage, machine learning, AI, big data, and telco platforms.
-
NVIDIA LinkX Cables
The NVIDIA® LinkX® product family of cables and transceivers provides the industry’s most complete line of 10, 25, 40, 50, 100, 200, and 400GbE in Ethernet and 100, 200 and 400Gb/s InfiniBand products for Cloud, HPC, hyperscale, Enterprise, telco, storage and artificial intelligence, data center applications.
-
NVIDIA Spectrum Ethernet Switches
Flexible form-factors with 16 to 128 physical ports, supporting 1GbE through 400GbE speeds.
Based on a ground-breaking silicon technology optimized for performance and scalability, NVIDIA Spectrum switches are ideal for building high-performance, cost-effective, and efficient Cloud Data Center Networks, Ethernet Storage Fabric, and Deep Learning Interconnects.
NVIDIA combines the benefits of NVIDIA Spectrum™ switches, based on an industry-leading application-specific integrated circuit (ASIC) technology, with a wide variety of modern network operating system choices, including NVIDIA Cumulus® Linux, SONiC and NVIDIA Onyx®.
-
NVIDIA Cumulus Linux
NVIDIA® Cumulus® Linux is the industry's most innovative open network operating system that allows you to automate, customize, and scale your data center network like no other.
-
Kubernetes
Kubernetes is an open-source container orchestration platform for deployment automation, scaling, and management of containerized applications.
-
OVN-Kubernetes
OVN-Kubernetes (Open Virtual Networking - Kubernetes) is an open-source project that provides a robust networking solution for Kubernetes clusters with OVN (Open Virtual Networking) and Open vSwitch (Open Virtual Switch) at its core. It is a Kubernetes networking conformant plugin written according to the CNI (Container Network Interface) specifications.
Solution Design
The solution design is based on RDG for DPF with OVN-Kubernetes and HBN Services - Solution Design.
K8s Cluster Logical Design - Monitoring Stack
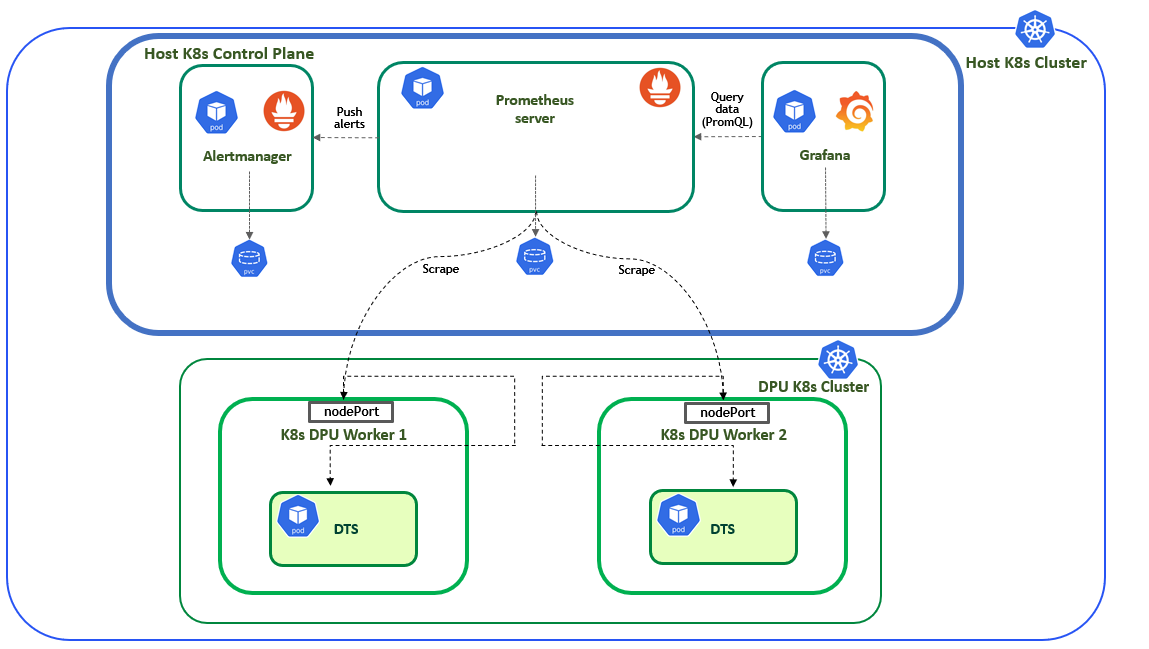
The following K8s logical design illustration demonstrates the main components of the monitoring stack in this solution:
-
1 x Prometheus server pod - scrapes metrics from instrumented jobs.
-
1 x Grafana pod - provides visualization for the collected data.
-
1 x Alertmanager pod - handles alerts sent by the Prometheus server.
The entire monitoring stack is deployed and managed using the kube-prometheus-stack Helm chart. Each pod is deployed as a StatefulSet, which also manages the PVCs providing persistent storage. Using service discovery (DNS based in this example), and by configuring the DTS DPUService to expose its Prometheus endpoint port to the host cluster, the Prometheus server can automatically detect every DTS instance in the DPU K8s cluster and pull metrics from it.
-
A more detailed explanation about the solution is provided in the following sections of the RDG.
-
The DPU K8s control plane is omitted from this scheme to simplify the view. For further details about the K8s cluster design, refer to RDG for DPF with OVN-Kubernetes and HBN Services - K8s Cluster Logical Design.
Software Stack Components
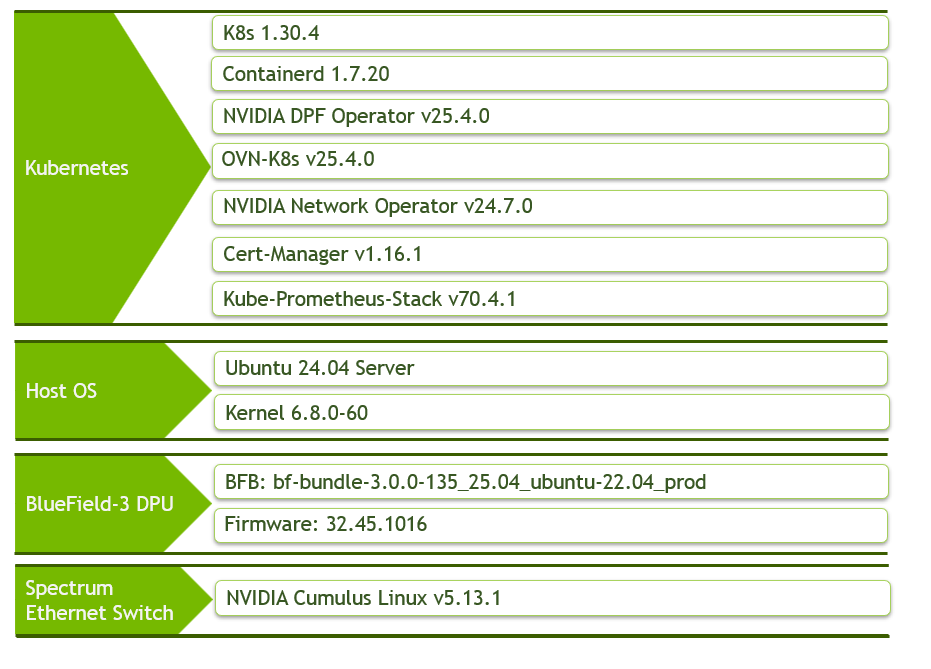
Make sure to use the exact same versions for the software stack as described above.
Bill of Materials
The bill of materials is based upon the same hardware as demonstrated in RDG for DPF with OVN-Kubernetes and HBN Services - Bill of Materials.
Deployment and Configuration
Node and Switch Definitions
Refer to RDG for DPF with OVN-Kubernetes and HBN Services - Node and Switch Definitions.
Wiring
Refer to RDG for DPF with OVN-Kubernetes and HBN Services - Wiring.
Fabric Configuration
Refer to RDG for DPF with OVN-Kubernetes and HBN Services - Fabric Configuration.
DTS Upgrade to Configure ConfigPorts
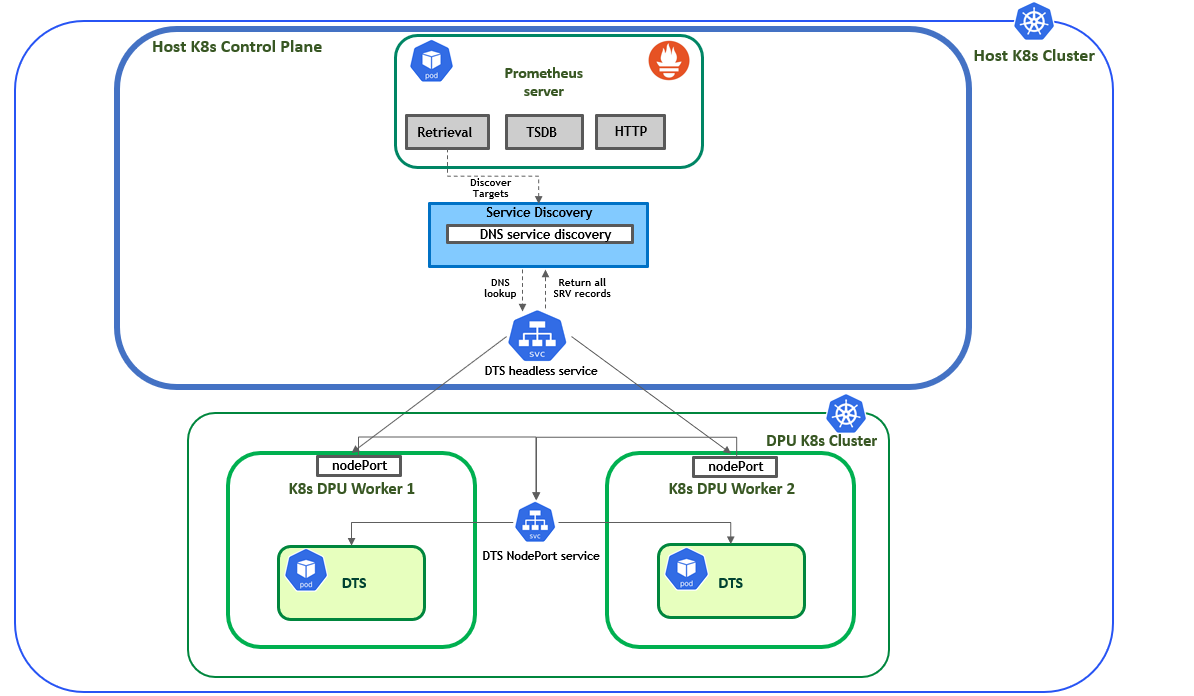
The following section explains how to leverage the DNS capabilities provided by Kubernetes to obtain a dynamic list of all the replicas for a service. This allows Prometheus to be kept informed automatically about which DTS instances it needs to scrape, without needing to statically reconfigure it every time an additional DTS instance is added to the K8s cluster.
To achieve this, several configurations are required:
-
A headless service on the host cluster, which in turn will create an SRV record, allowing Prometheus to utilize its DNS-based service discovery feature.
-
The DTS Prometheus endpoint port (
9100by default) needs to be exposed to the host cluster via a NodePort service. -
An EndPointSlice to back the headless service on the host cluster with the DPU IPs as its endpoints and the nodePorts values as its port.
Fortunately, all of these can be configured using the ConfigPorts field for the DTS DPUService. For more information on this feature, refer to: dpuservice-configPorts.
The following illustration demonstrates the explanation provided above:
Proceed with the following configuration:
-
Upgrade the DTS DPUService using the following configuration:
manifests/05-dpudeployment-installation/dpuserviceconfig_dts.yaml
YAML--- apiVersion: svc.dpu.nvidia.com/v1alpha1 kind: DPUServiceConfiguration metadata: name: dts namespace: dpf-operator-system spec: deploymentServiceName: "dts" serviceConfiguration: configPorts: serviceType: None ports: - name: httpserverport protocol: TCP port: 9100manifests/05-dpudeployment-installation/dpuservicetemplate_dts.yaml
YAML--- apiVersion: svc.dpu.nvidia.com/v1alpha1 kind: DPUServiceTemplate metadata: name: dts namespace: dpf-operator-system spec: deploymentServiceName: "dts" helmChart: source: repoURL: $HELM_REGISTRY_REPO_URL version: 1.0.6 chart: doca-telemetry values: exposedPorts: ports: httpserverport: true -
Run the following command:
-
The following command assumes the user has cloned the doca-platform Git repository, changed to the necessary directory inside it and defined the variables required for the DPF installation.
-
For more information, check: RDG for DPF with OVN-Kubernetes and HBN Services - DPF Installation Software Prerequisites and Required Variables.
Jump Node Console
$ cat manifests/05-dpudeployment-installation/*dts.yaml | envsubst | kubectl apply -f - -
-
Verify that the DTS DPUService is in the ready state and that a headless service has been created on the host cluster:
The following verification commands may need to be run multiple times to ensure the condition is met.
Jump Node Console
$ kubectl wait --for=condition=ApplicationsReady --namespace dpf-operator-system dpuservices -l svc.dpu.nvidia.com/owned-by-dpudeployment=dpf-operator-system_ovn-hbn | grep dts dpuservice.svc.dpu.nvidia.com/dts-mk55x condition met $ kubectl get svc -n dpf-operator-system | grep dts dts-mk55x ClusterIP None <none> 9100/TCP 2m24s -
Verify that the SRV record is resolvable from the host cluster:
-
In this example the
master1node is used (since it has an IP in the pod subnet). SSH into the respective node:Jump Node Console
depuser@jump:~$ ssh master1 -
Resolve the headless service SRV record, which should return all DTS endpoint SRV records (2 in this example):
Replace
dts-mk55xwith your service name.Master1 Console
depuser@master1:~# dig srv _httpserverport._tcp.dts-mk55x.dpf-operator-system.svc.cluster.local +short
0 50 30342 worker1-0000-89-00.dts-mk55x.dpf-operator-system.svc.cluster.local.
0 50 30342 worker2-0000-89-00.dts-mk55x.dpf-operator-system.svc.cluster.local.
-
Setup Centralized Monitoring Stack
Prometheus is a monitoring platform that collects metrics from monitored targets by scraping metrics HTTP endpoints on these targets.
Grafana is an open-source software which allows users to query, visualize, alert on, and explore their metrics, logs, and traces wherever they are stored and turn TSDBs data into insightful graphs and visualizations.
In this RDG, the monitoring stack will be installed using the kube-prometheus-stack Helm chart.
This chart installs the core components of the kube-prometheus stack, including a collection of Kubernetes manifests, Grafana dashboards, Prometheus rules, and documentation and scripts. Together they provide an easy-to-operate, end-to-end monitoring solution for Kubernetes cluster using Prometheus Operator.
-
Add the Prometheus-Community repository and update it:
Jump Node Console
$ helm repo add prometheus-community https://prometheus-community.github.io/helm-charts $ helm repo update -
The following
kube-prometheus-stack.yamlvalues file will be applied:-
The Prometheus server is already configured with DNS-based service discovery to automatically discover all DTS instances in the cluster (DNS points to the headless service SRV record created earlier).
-
The Prometheus server, Grafana, and Alertmanager StatefulSets are backed by PVCs using the
local-pathStorageClass, each with a size of10Gi. By default, the PVCs are retained in case of StatefulSet deletion or scale-down. -
All of the services in the stack are deployed with a service of type
NodePortfor easy access to their UIs from a browser in the jump host. -
All of the pods are configured to run on the control plane nodes with an anti-affinity for better load sharing.
kube-prometheus-stack.yaml
YAMLalertmanager: service: type: NodePort alertmanagerSpec: storage: volumeClaimTemplate: spec: storageClassName: local-path accessModes: ["ReadWriteOnce"] resources: requests: storage: 10Gi nodeSelector: node-role.kubernetes.io/control-plane: "" affinity: podAntiAffinity: preferredDuringSchedulingIgnoredDuringExecution: - weight: 100 podAffinityTerm: labelSelector: matchExpressions: - key: app.kubernetes.io/name operator: In values: - prometheus - grafana topologyKey: kubernetes.io/hostname tolerations: - key: node-role.kubernetes.io/control-plane operator: Exists effect: NoSchedule - key: node-role.kubernetes.io/master operator: Exists effect: NoSchedule grafana: persistence: enabled: true storageClassName: "local-path" nodeSelector: node-role.kubernetes.io/control-plane: "" tolerations: - key: node-role.kubernetes.io/control-plane operator: Exists effect: NoSchedule - key: node-role.kubernetes.io/master operator: Exists effect: NoSchedule affinity: podAntiAffinity: preferredDuringSchedulingIgnoredDuringExecution: - weight: 100 podAffinityTerm: labelSelector: matchExpressions: - key: app.kubernetes.io/name operator: In values: - prometheus - alertmanager topologyKey: kubernetes.io/hostname service: type: NodePort useStatefulSet: true kubeStateMetrics: enabled: false nodeExporter: enabled: false prometheusOperator: admissionWebhooks: patch: nodeSelector: node-role.kubernetes.io/control-plane: "" tolerations: - key: node-role.kubernetes.io/control-plane operator: Exists effect: NoSchedule - key: node-role.kubernetes.io/master operator: Exists effect: NoSchedule nodeSelector: node-role.kubernetes.io/control-plane: "" tolerations: - key: node-role.kubernetes.io/control-plane operator: Exists effect: NoSchedule - key: node-role.kubernetes.io/master operator: Exists effect: NoSchedule prometheus: service: type: NodePort prometheusSpec: tolerations: - key: node-role.kubernetes.io/control-plane operator: Exists effect: NoSchedule - key: node-role.kubernetes.io/master operator: Exists effect: NoSchedule nodeSelector: node-role.kubernetes.io/control-plane: "" affinity: podAntiAffinity: preferredDuringSchedulingIgnoredDuringExecution: - weight: 100 podAffinityTerm: labelSelector: matchExpressions: - key: app.kubernetes.io/name operator: In values: - grafana - alertmanager topologyKey: kubernetes.io/hostname storageSpec: volumeClaimTemplate: spec: storageClassName: local-path accessModes: ["ReadWriteOnce"] resources: requests: storage: 10Gi additionalScrapeConfigs: - job_name: 'dts-metrics' dns_sd_configs: - names: - '_httpserverport._tcp.dts-mk55x.dpf-operator-system.svc.cluster.local' relabel_configs: - source_labels: [__address__] target_label: dpu_instance action: replace regex: '^([^.]+)\..*$' -
-
Install the kube-prometheus-stack Helm chart using the following command:
Jump Node Console
$ helm install --create-namespace --namespace kube-prometheus-stack kube-prometheus-stack prometheus-community/kube-prometheus-stack --version v70.4.1 -f kube-prometheus-stack.yaml -
Verify that all the pods in the kube-prometheus-stack namespace are in ready state:
Jump Node Console
$ kubectl wait --for=condition=ready --namespace kube-prometheus-stack pods --all pod/alertmanager-kube-prometheus-stack-alertmanager-0 condition met pod/kube-prometheus-stack-grafana-0 condition met pod/kube-prometheus-stack-operator-584fccf98d-w8hnc condition met pod/prometheus-kube-prometheus-stack-prometheus-0 condition met -
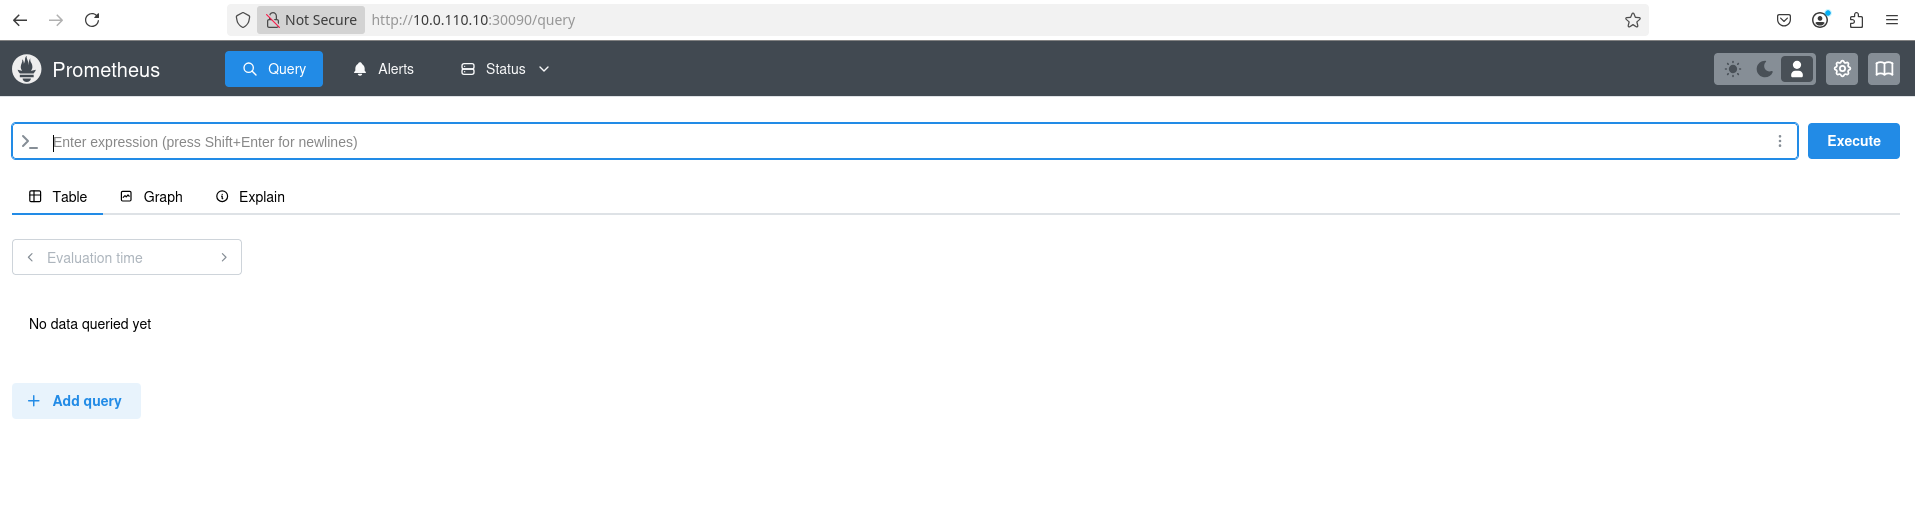
Verify in the Prometheus UI that the DNS service discovery works well.
-
Enter an RDP session, open a web browser, and enter http://<TARGETCLUSTER_API_SERVER_HOST>:30090 to access the Prometheus web UI:
-
By default, in the
kube-prometheus-stackchart, port30090is the port forNodePorttype service for Prometheus UI. -
10.0.110.10is the IP address corresponding to the variableTARGETCLUSTER_API_SERVER_HOSTin this RDG.
-
-
Navigate to Status → Service Discovery. You should see something similar to the following under
dts-metricsjob: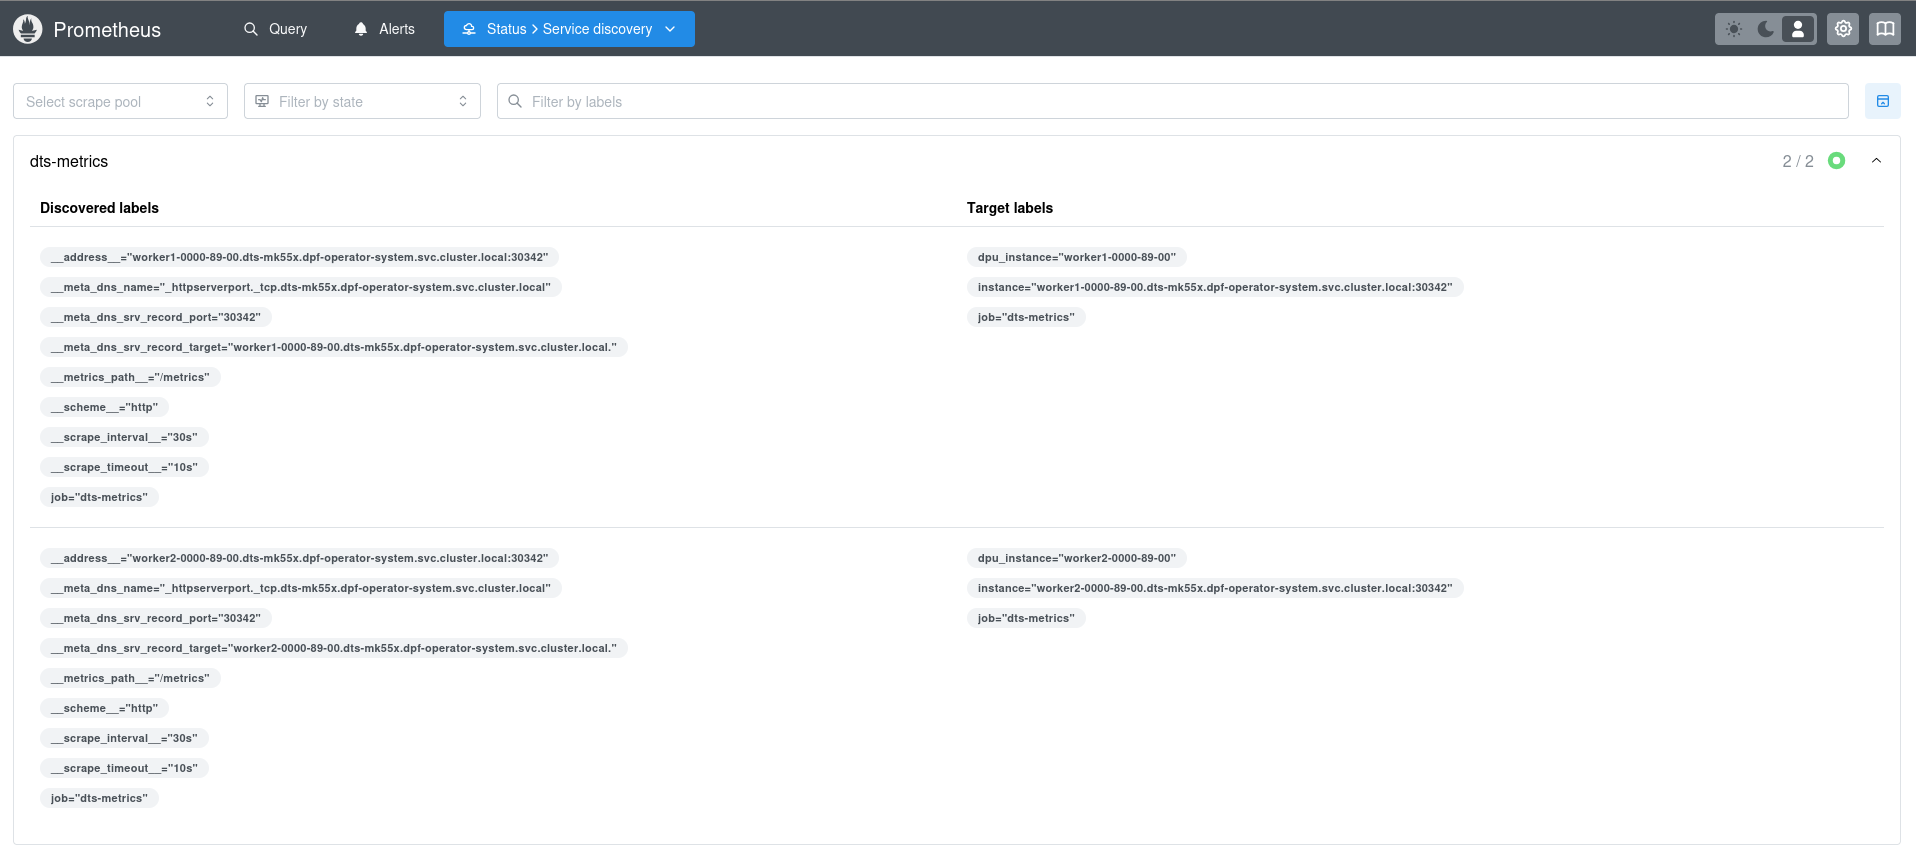
-
Navigate to Status → Target health to verity both DTS endpoints are in the 'UP' state under
dts-metricsjob: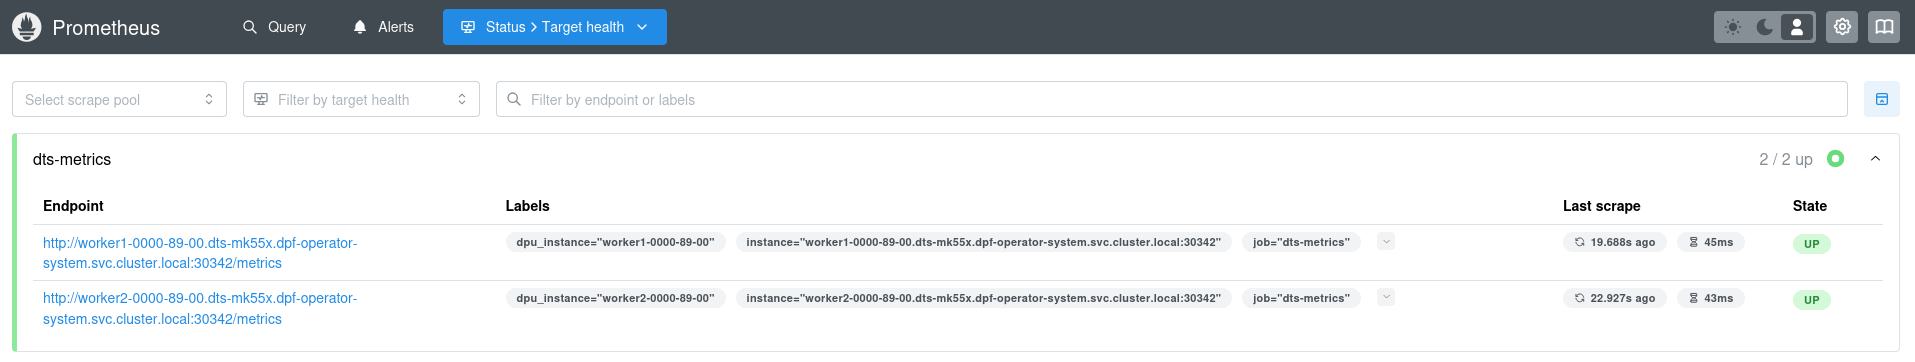
-
Display metrics in Grafana
To view the metrics DTS exposed by Grafana and construct useful monitoring graphs, access the Grafana UI:
-
Find out the
nodePortof the GrafanaNodePortservice:Jump Node Console
$ kubectl get svc -n kube-prometheus-stack kube-prometheus-stack-grafana NAME TYPE CLUSTER-IP EXTERNAL-IP PORT(S) AGE kube-prometheus-stack-grafana NodePort 10.233.29.146 <none> 80:31443/TCP 9m46s -
In the RDP session, open a web browser and enter http://<TARGETCLUSTER_API_SERVER_HOST>:<Grafana-svc-nodePort>(
10.0.110.10and31443respectively in this example):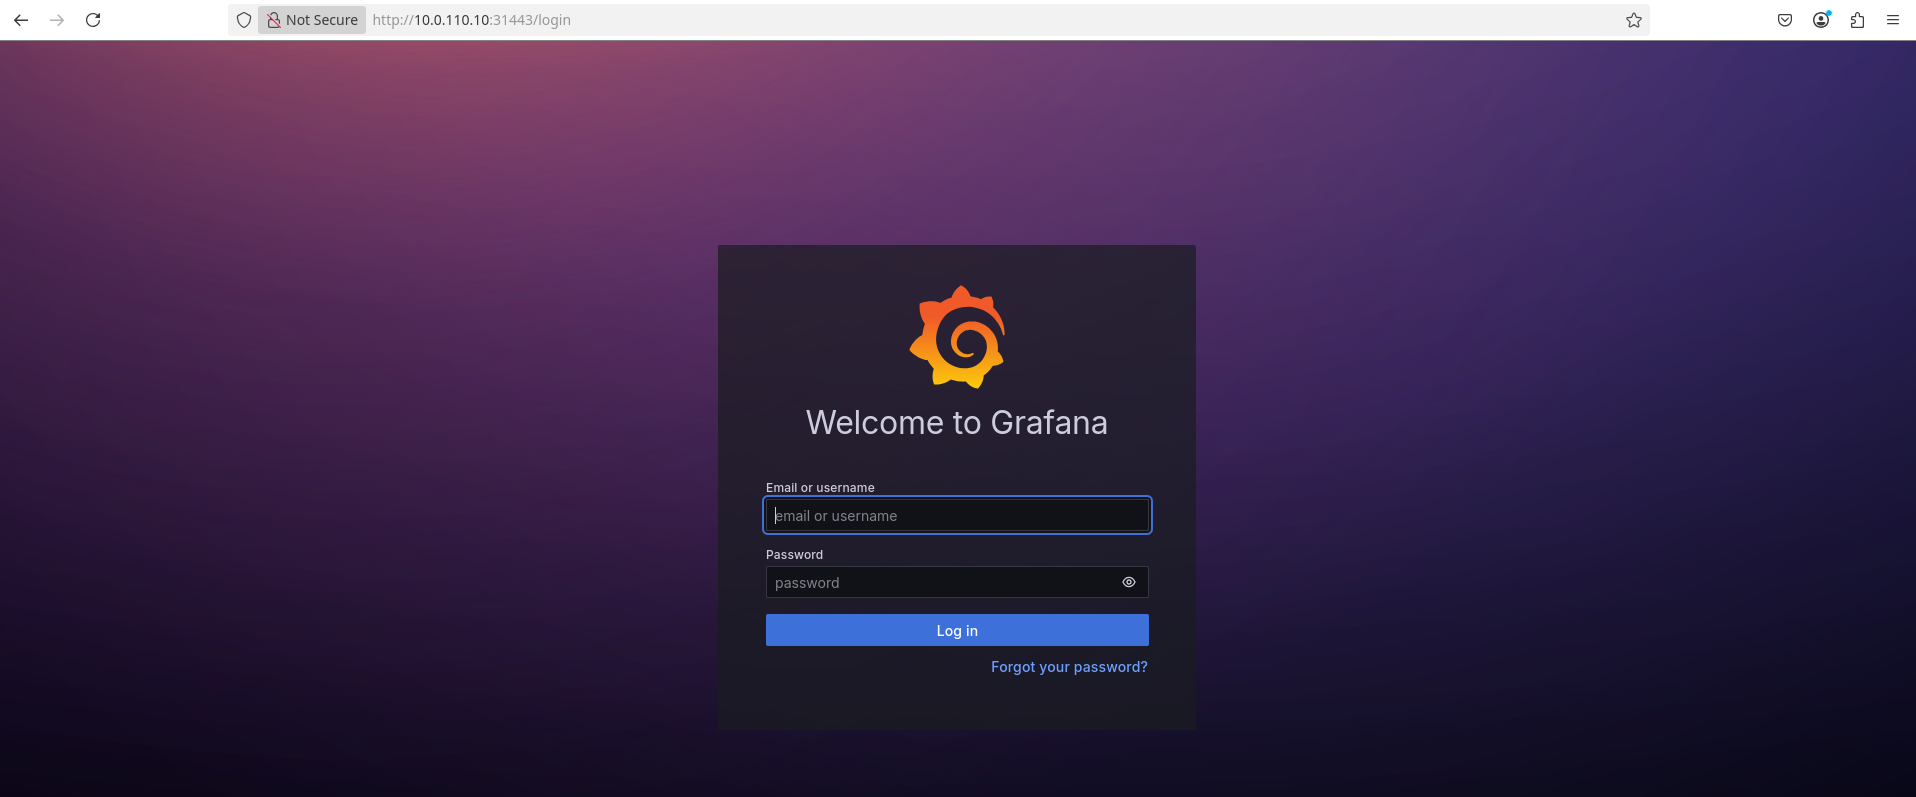
-
Enter the admin login credentials to access the Grafana home page:
-
To obtain the Grafana secret name in the
kube-prometheus-stackoperator namespace, run:Jump Node Console
$ kubectl get secrets -n kube-prometheus-stack | grep grafana NAME TYPE DATA AGE kube-prometheus-stack-grafana Opaque 3 10m -
Run the following command to obtain the admin username:
Jump Node Console
$ kubectl get secrets -n kube-prometheus-stack kube-prometheus-stack-grafana -o json | jq '.data."admin-user"' | cut -d '"' -f 2 | base64 --decode -
Output example:
Jump Node Console
admin -
Run the following command to obtain the admin password:
Jump Node Console
$ kubectl get secrets -n kube-prometheus-stack kube-prometheus-stack-grafana -o json | jq '.data."admin-password"' | cut -d '"' -f 2 | base64 --decode -
Output example:
Jump Node Console
prom-operator -
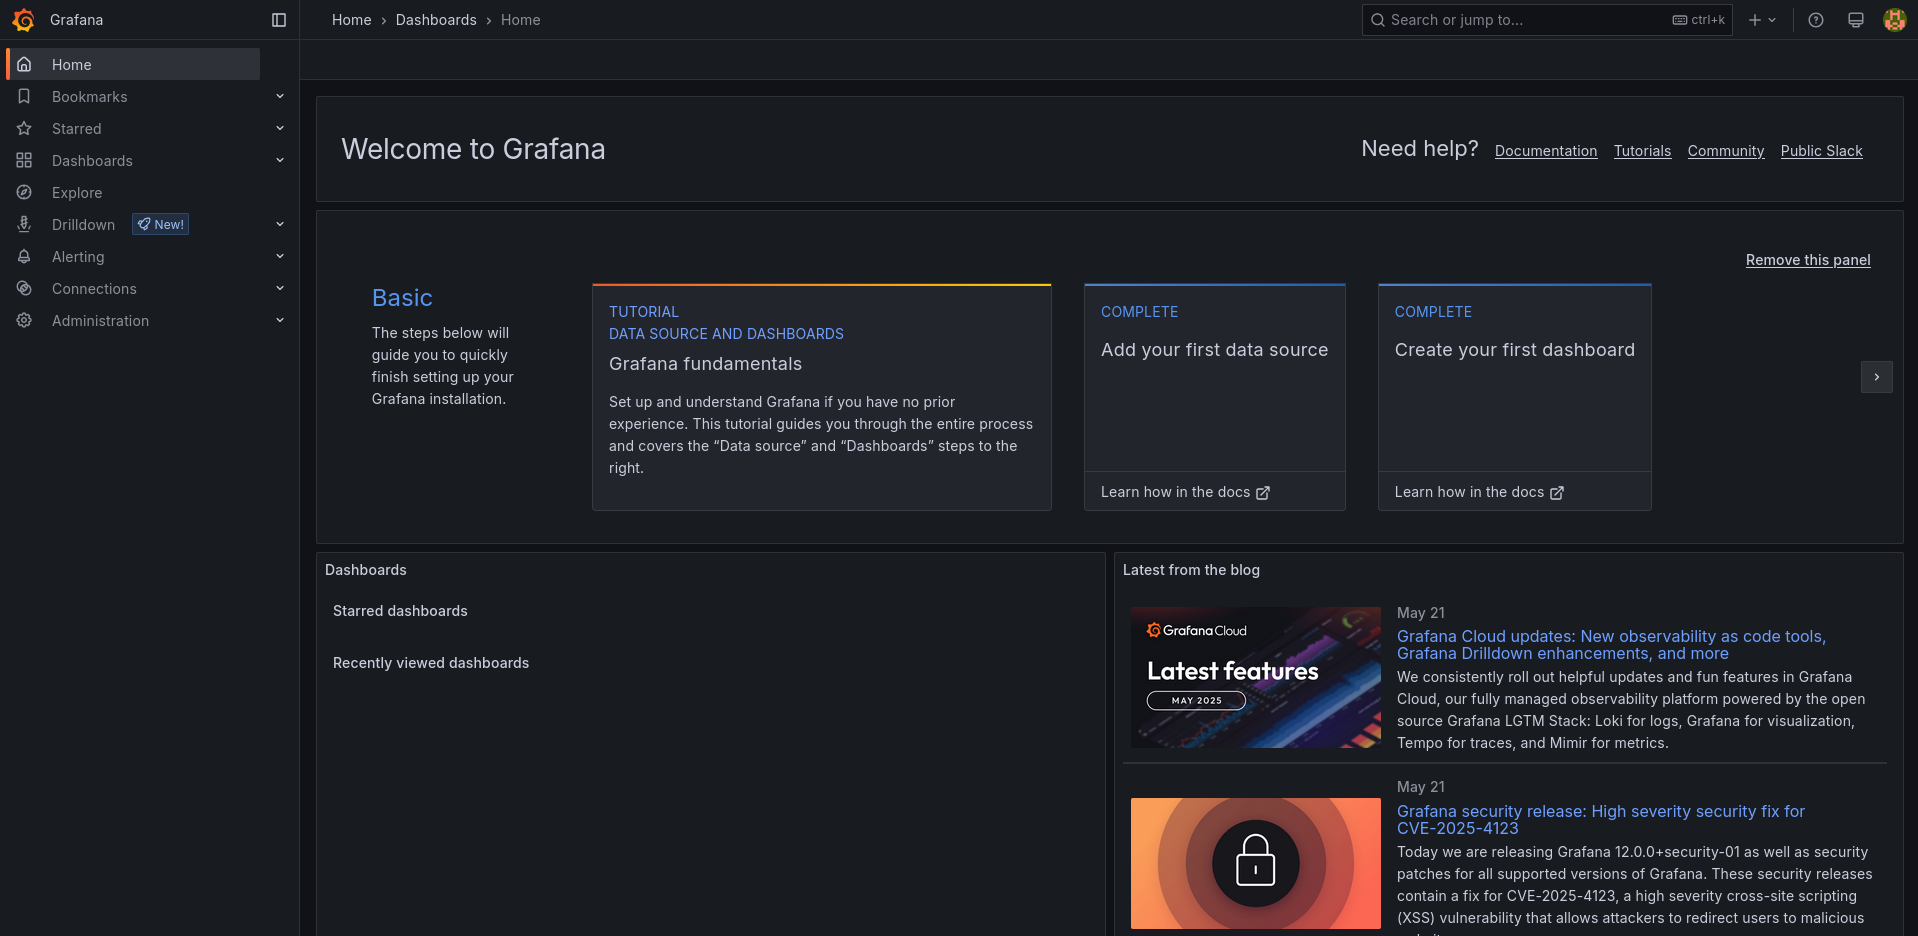
Return to the login page and enter the credentials previously obtained:
-
-
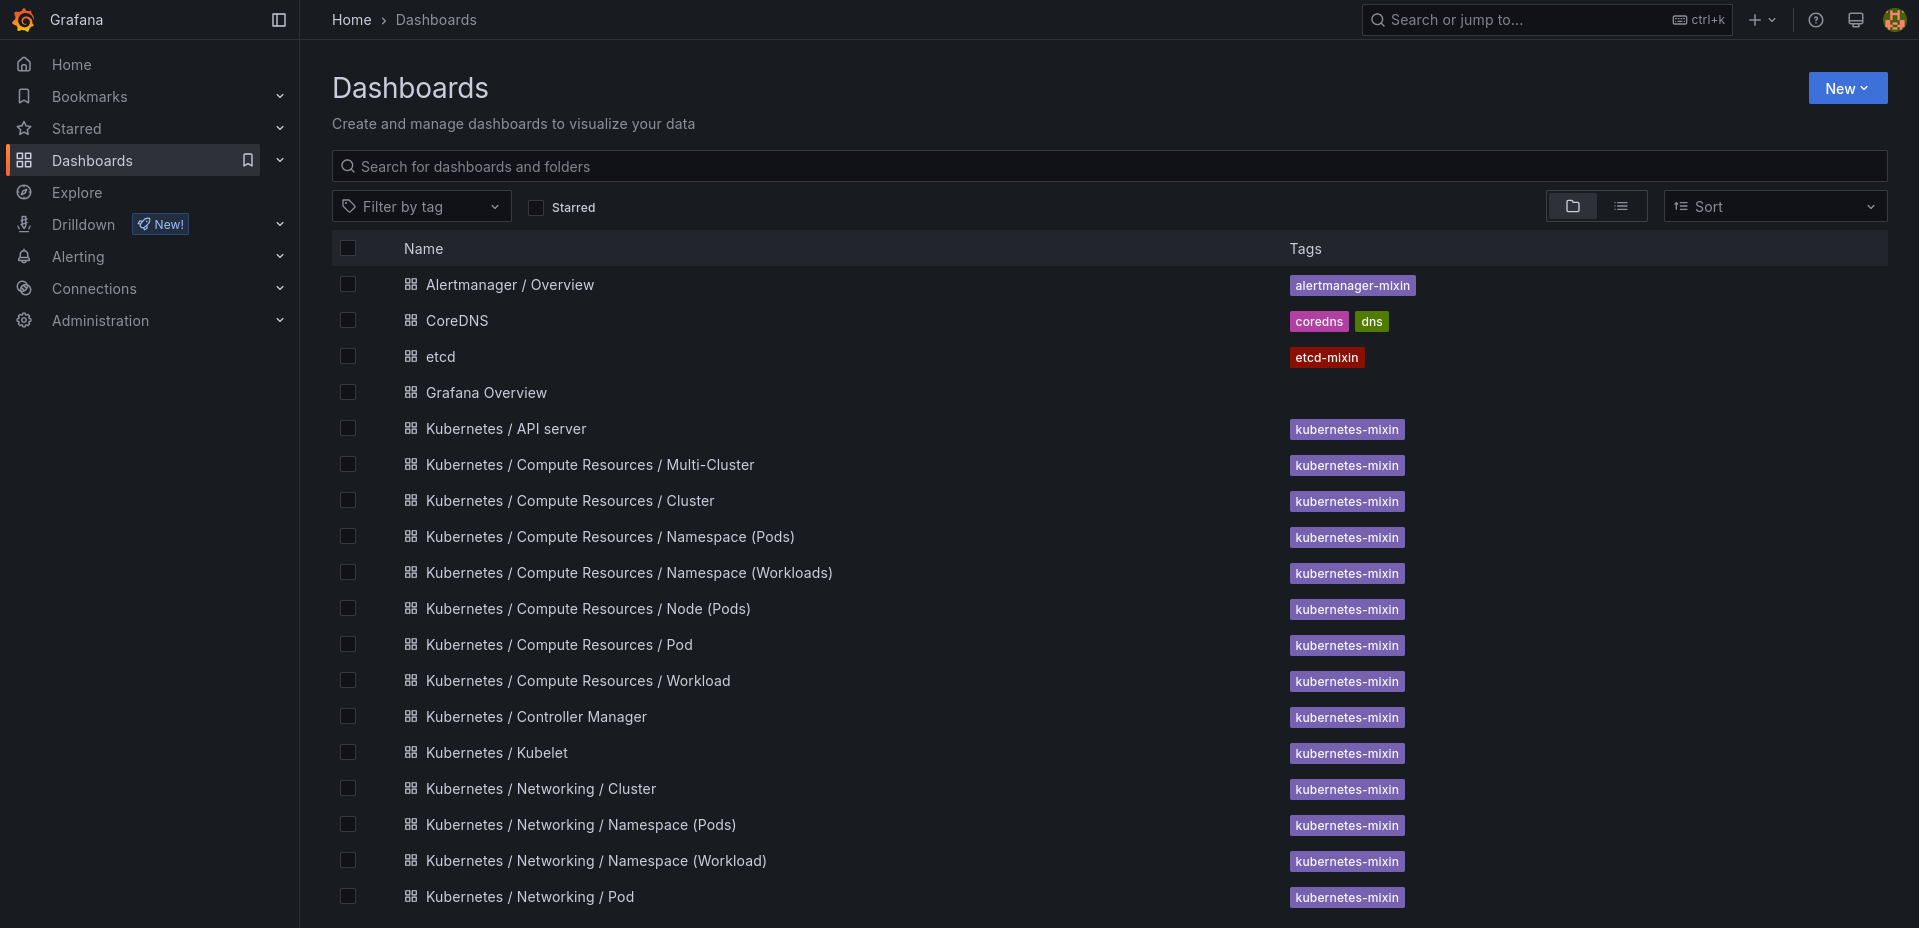
Navigate to the Dashboards page where pre-configured dashboards installed by the kube-prometheus-stack helm chart are already available:
-
Click on New → New Dashboard → Add visualization → Select Prometheus as Data Source. After that, start adding panels based on different DTS metrics. For instance:
-
Click Back to dashboard in the top-right corner of the new panel.
-
Click Settings in the top-right corner of the new dashboard.
-
Go to the Variables tab.
-
Add the following variables:
-
"Select variable type":
Data source, "General": ("Name":datasource), "Data source options": ("Type":Prometheus)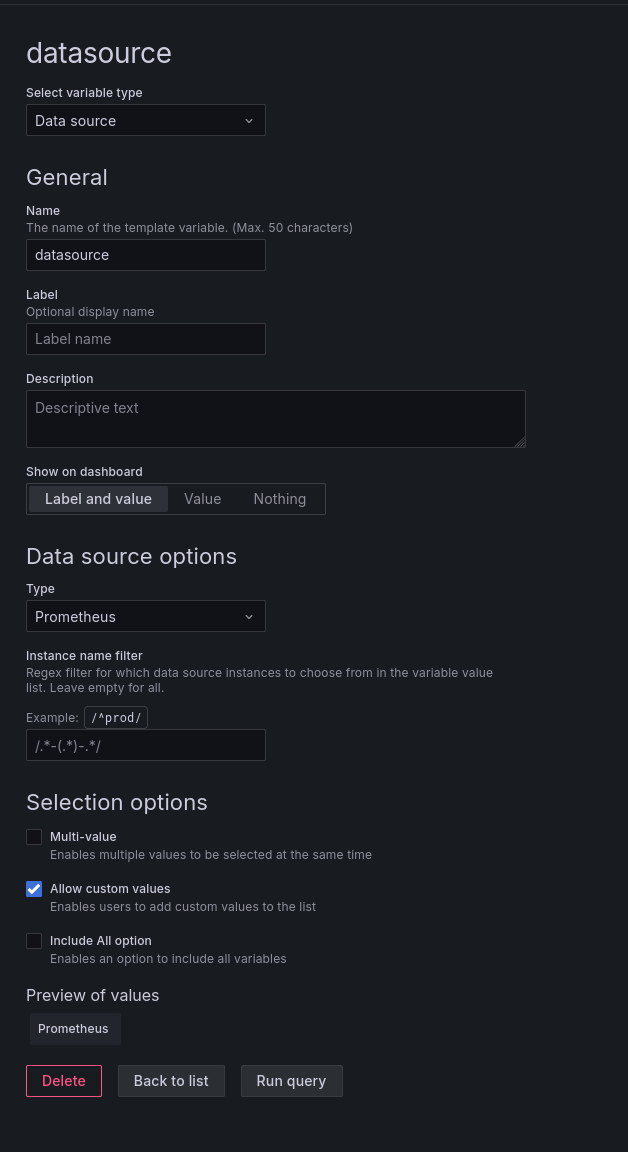
-
"Select variable type":
Query, "General": ("Name":dpu_instance, "Label":dpu_instance), "Query options": ("Data source":$(datasource), "Query": ("Query type":Label values, "Label":dpu_instance, "Metric":pf0vf0_eth_rx_bytes, "Label filters":job =~ dts-metrics))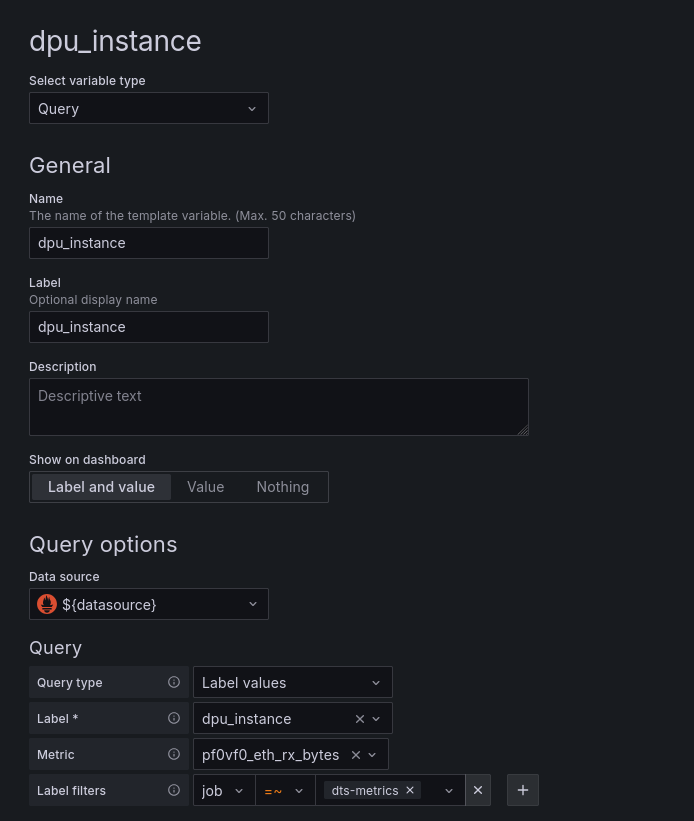
-
-
Return to the main dashboard page and click Edit on the previously added empty panel.
-
Configure the new panel as follows:
-
Under the 1st query row (marked as 'A' by default), switch from Builder to Code.
-
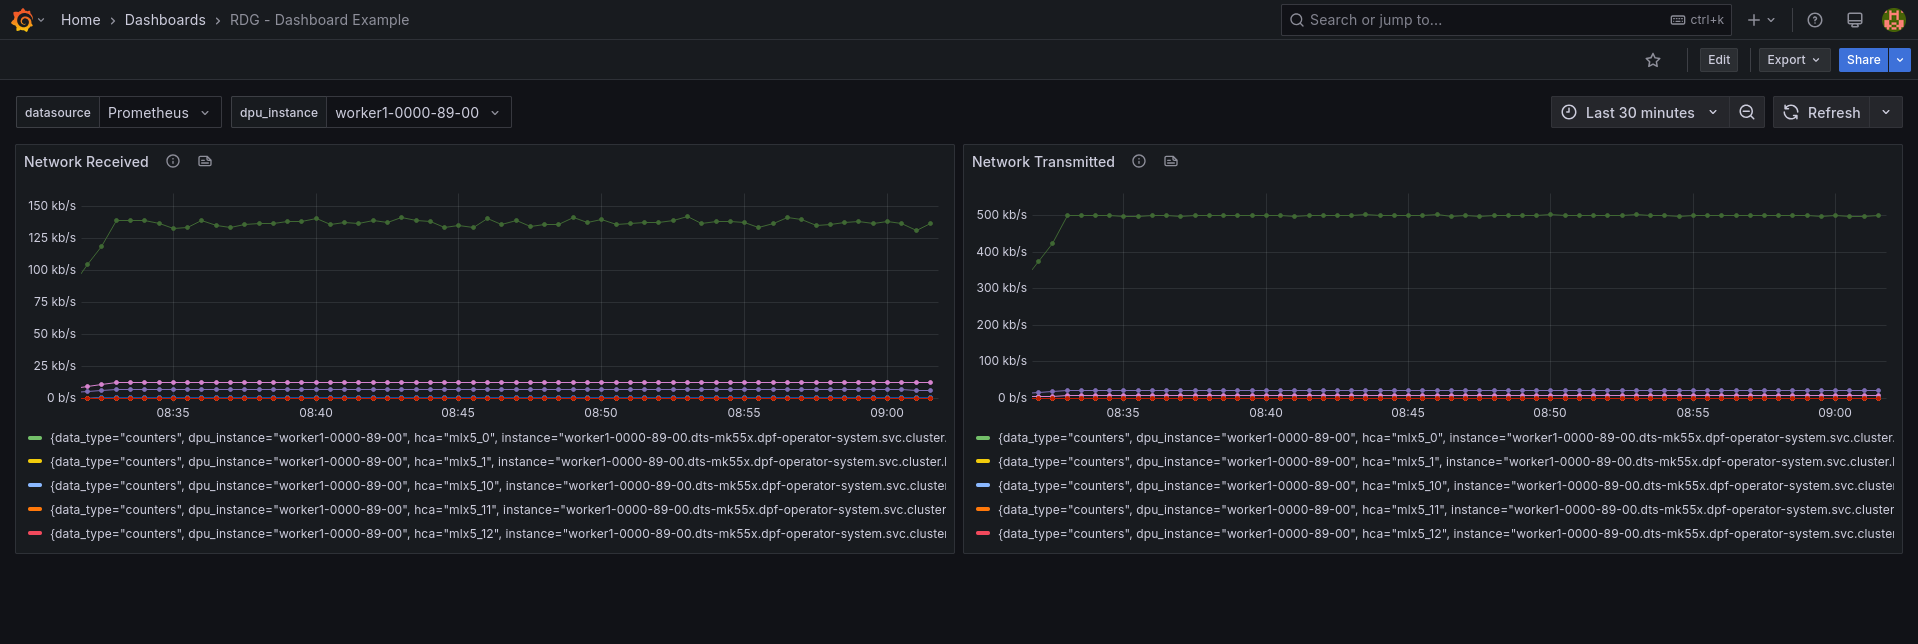
Enter the following query to display the average rate of received bits per second in the last 5 minutes:
Network Received PromQL
rate(label_replace({__name__=~".*_eth_rx_bytes", job="dts-metrics", dpu_instance="$dpu_instance"},"name_label","$1","__name__", "(.+)")[5m:]) * 8 -
On the right-side of the screen under "Panel options", configure:
-
Title:
Network Received -
Description:
Network received (bits/s) -
Unit:
bits/sec(SI) -
Min:
0
-
-
Click Run queries to display the data in the panel.
-
-
Click Back to dashboard and then choose Add → Visualization.
-
Configure an additional panel:
-
Run the following query to display the average rate of transmitted bits per second in the last 5 minutes:
Network Transmitted PromQL
rate(label_replace({__name__=~".*_eth_tx_bytes", job="dts-metrics", dpu_instance="$dpu_instance"},"name_label","$1","__name__", "(.+)")[5m:]) * 8 -
On the right-side of the screen under "Panel options", configure:
-
Title:
Network Transmitted -
Description:
Network transmitted (bits/s) -
Unit:
bits/sec(SI) -
Min:
0
-
-
Click Run queries to display the data in the panel.
-
-
Click Back to dashboard and align the panels:
-
Click Save dashboard in the top-right corner of the dashboard.
-
Authors

|
Guy Zilberman Guy Zilberman is a solution architect at NVIDIA's Networking Solutions Labs, bringing extensive experience from several leadership roles in cloud computing.
|
Last updated: