Plugin Release Notes
Changes and New Features
|
Plugin Version |
Feature |
||
|---|---|---|---|
|
1.0.2-0 |
Limitations:
|
||
Bug Fixes
|
Plugin Version |
Bug Fix |
|---|---|
|
1.0.2-0 |
N/A |
Overview
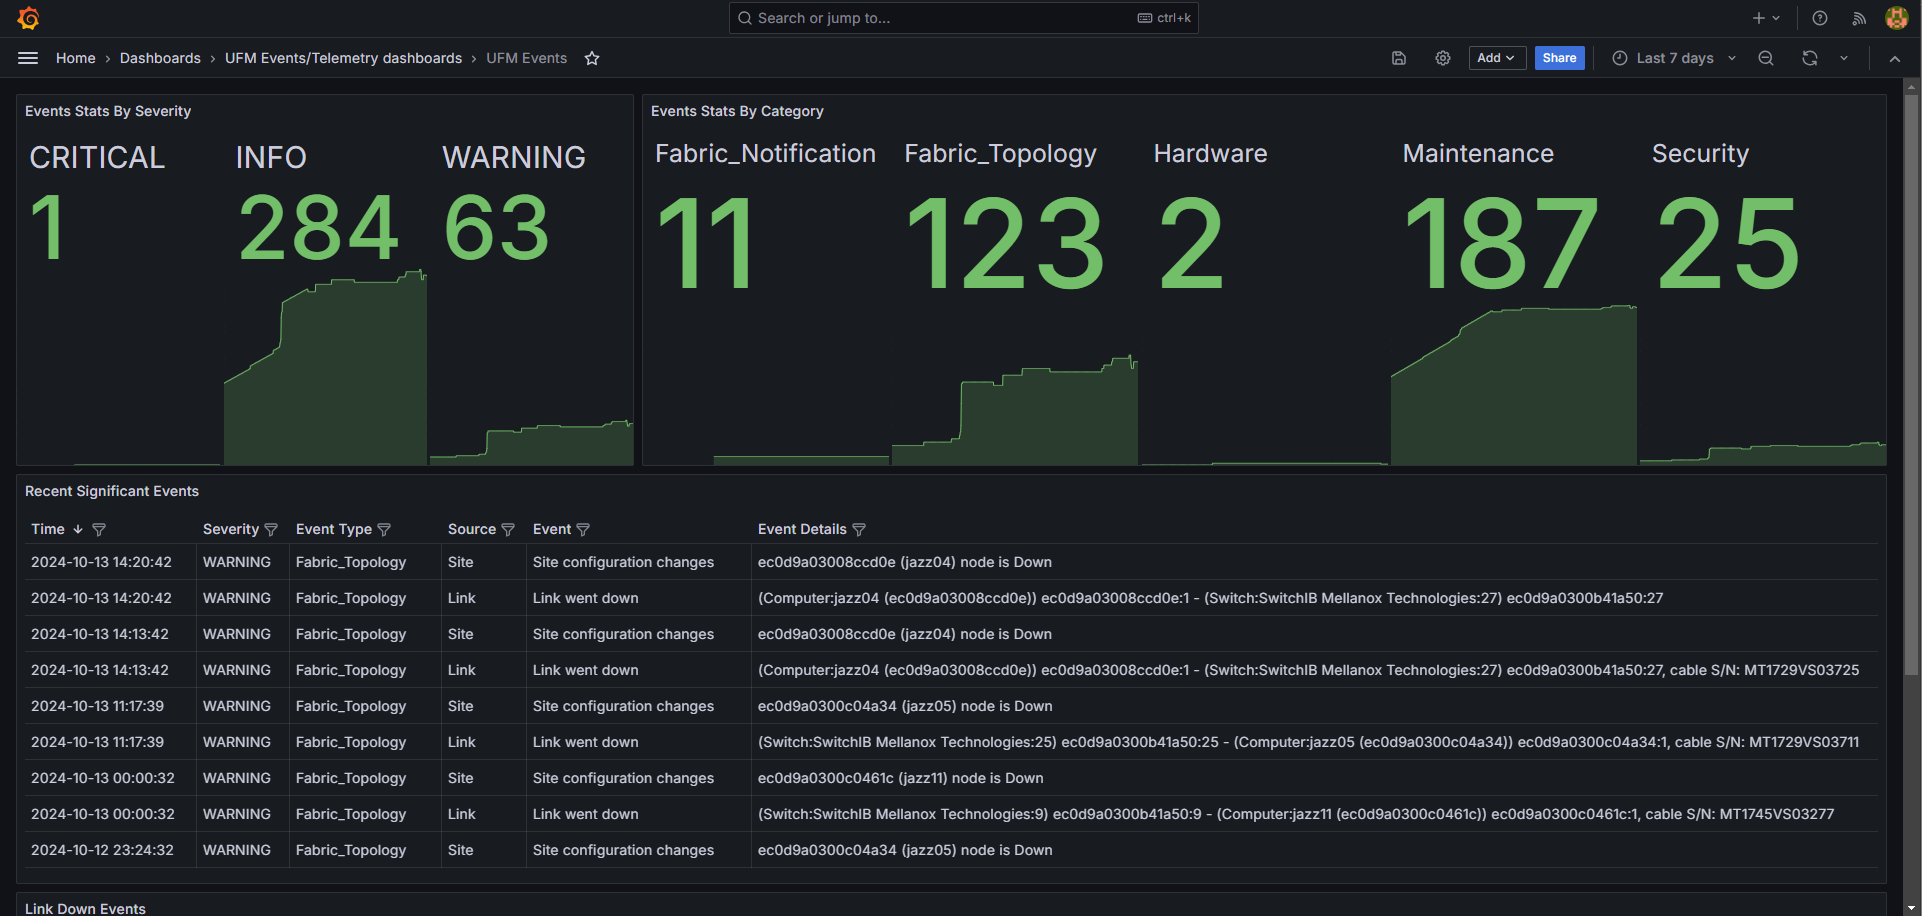
This plugin monitors and parses UFM events from the event.log file using Fluentd. It pushes the logs to a Loki server and visualizes them through Grafana dashboards.
Installation
-
Install Plugin on UFM.
-
Access Grafana Dashboard at:
http://<IP>:3002(default credentials:admin/admin).
Components
-
Fluentd: Parses
event.logfile, extracts relevant fields, and pushes logs to Loki. -
Loki: Aggregates and stores logs.
-
Grafana: Visualizes logs with predefined panels (e.g., Events Stats, Topology Changes, Hardware Events).
Configuration Files
-
Fluentd:
/opt/ufm/files/conf/plugins/ufm_events_grafana_dashboard/fluentd/fluentd.conf -
Loki:
/opt/ufm/files/conf/plugins/ufm_events_grafana_dashboard/loki/loki-local-config.yaml -
Grafana:
/opt/ufm/files/conf/plugins/ufm_events_grafana_dashboard/grafana/grafana.ini
Logs
Plugin logs are stored in /opt/ufm/files/log/plugins/ufm_events_grafana_dashboard/.
Usage
Navigate to Grafana -> Dashboards -> UFM Events to view predefined panels or create custom queries under the Explore section.
Last updated: