This guide provides instructions for building and developing applications that require telemetry data collection from NVIDIA® BlueField® and NVIDIA® ConnectX® families of networking platforms.
Introduction
The doca_telemetry_pcc library provides access to algorithm information and counter statistics for any Programmable Congestion Control (PCC) implementations currently installed on NVIDIA® BlueField or ConnectX® networking platforms.
DOCA Telemetry PCC is supported at alpha level.
Prerequisites
To use DOCA Telemetry PCC, the following prerequisites must be met:
-
fwctldriver installed and loaded (see instructions in NVIDIA MLNX_OFED Documentation v24.07-0.6.1.0)To verify whether the
fwctldriver is successfully loaded:Bash$ ls /sys/class/fwctl/Expected output:
Bashfwctl0 fwctl1If the directory
/sys/class/fwctldoes not exist or is empty, follow these steps:-
Search for the
fwctlpackage:The output may indicate either$ apt search fwctl
fwctl-dkmsorfwctl-modules. -
Install the appropriate package:
Or:$ sudo apt install fwctl-dkms
$ sudo apt install fwctl-modules
-
Load the
mlx5_fwctlmodule:$ sudo modprobe mlx5_fwctl
-
Confirm the module is loaded:
Expected output:$ lsmod | grep fwctl
mlx5_fwctl             20480  0
fwctl                  24576  1 mlx5_fwctl
mlx5_core            2211840  2 mlx5_fwctl,mlx5_ib
mlx_compat             20480  17 rdma_cm,ib_ipoib,mlxdevm,nvme,mlxfw,mlx5_fwctl,iw_cm,nvme_core,nvme_fabrics,ib_umad,fwctl,ib_core,rdma_ucm,ib_uverbs,mlx5_ib,ib_cm,mlx5_core
-
-
Firmware version 28.43.1000 for ConnectX-7 or 32.43.1000 for BlueField-3
Environment
DOCA Telemetry-based applications can run on either the host machine (ConnectX-7 or BlueField-3 and newer) or the DPU target (BlueField-3 and newer).
Architecture
DOCA Telemetry PCC allows for the collection of information from any PCC images installed and actively running on a ConnectX or BlueField device.
To interact with a device, a separate doca_telemetry_pcc context must be created for each device. A device typically corresponds to a specific port on a NIC.
The doca_telemetry_pcc context operates independently of any doca_pcc contexts. This means that changes to the configuration of a running PCC image, such as disabling an algorithm, are not automatically reflected in the telemetry context. Implementing applications must handle these changes either by directly interacting with the PCC application or by scanning all algorithm slots to determine which are currently active.
It is assumed that a new PCC image will not be installed while a doca_telemetry_pcc context is active on the device.
If a complete PCC re-image is performed, a new doca_telemetry_pcc context must be created.
Schema Retrieval
Slots/Algorithms
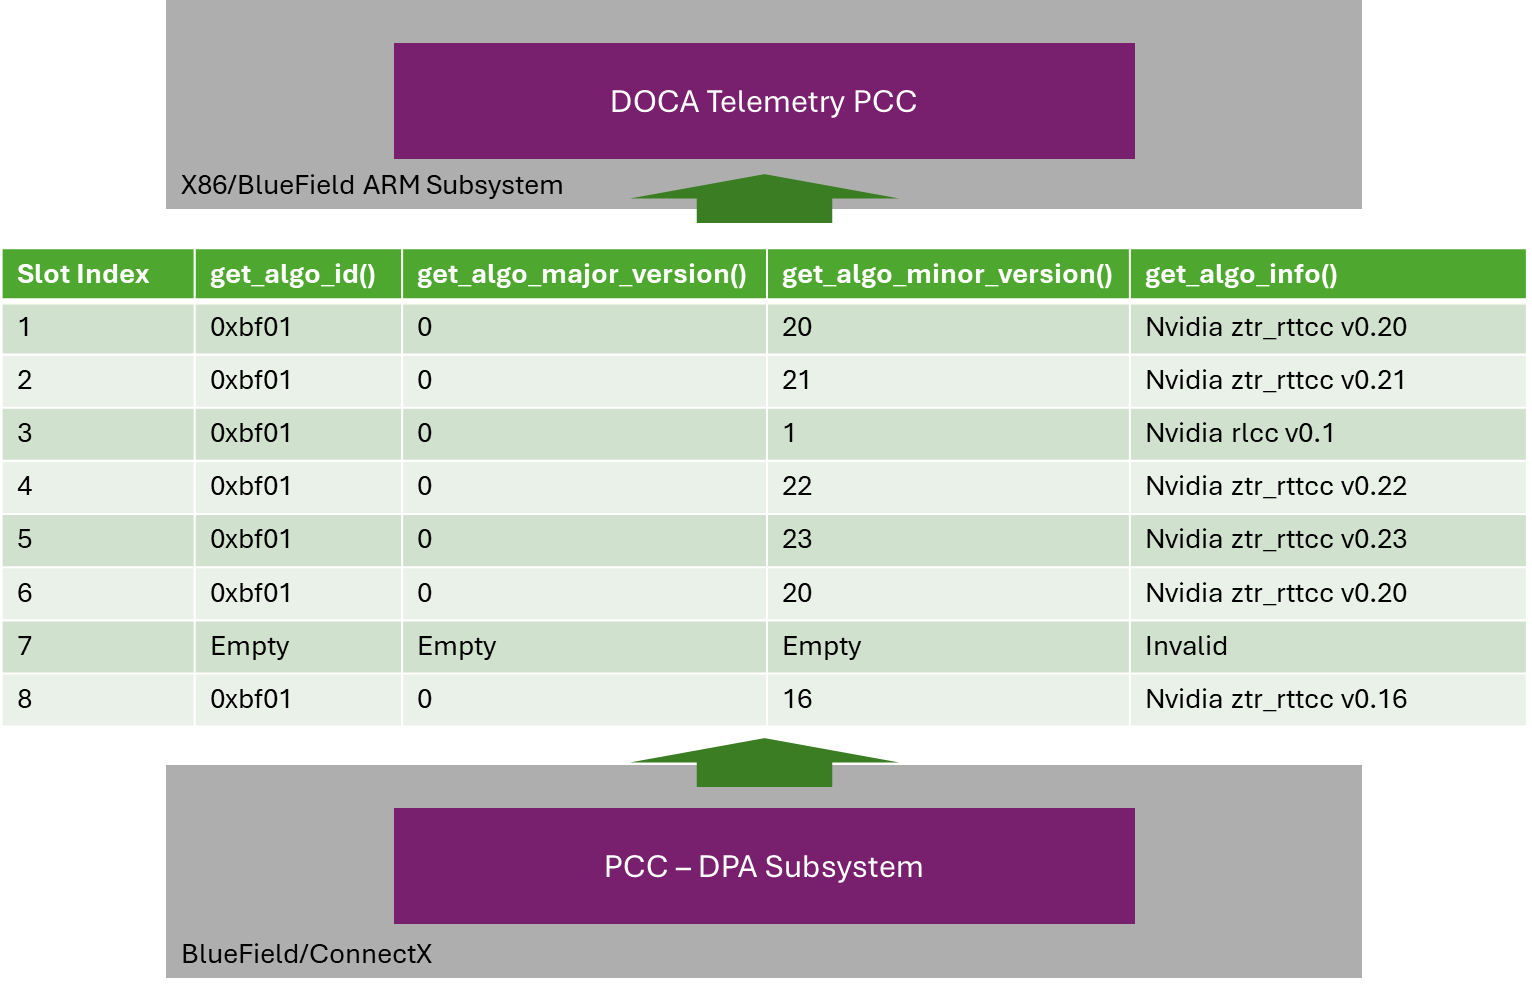
An active PCC image running on the DPA subsystem of a device can contain multiple Congestion Control algorithms. Each algorithm is assigned to a specific "slot," with only one slot/algorithm active on the device at any given time.
The algorithms in each slot cannot be modified without re-imaging the PCC algorithm on the DPAs. While DOCA Telemetry PCC does not provide functionality to configure slots or algorithms, it enables the calling application to retrieve information about the algorithms installed in each populated slot.
For example:
Counter Information
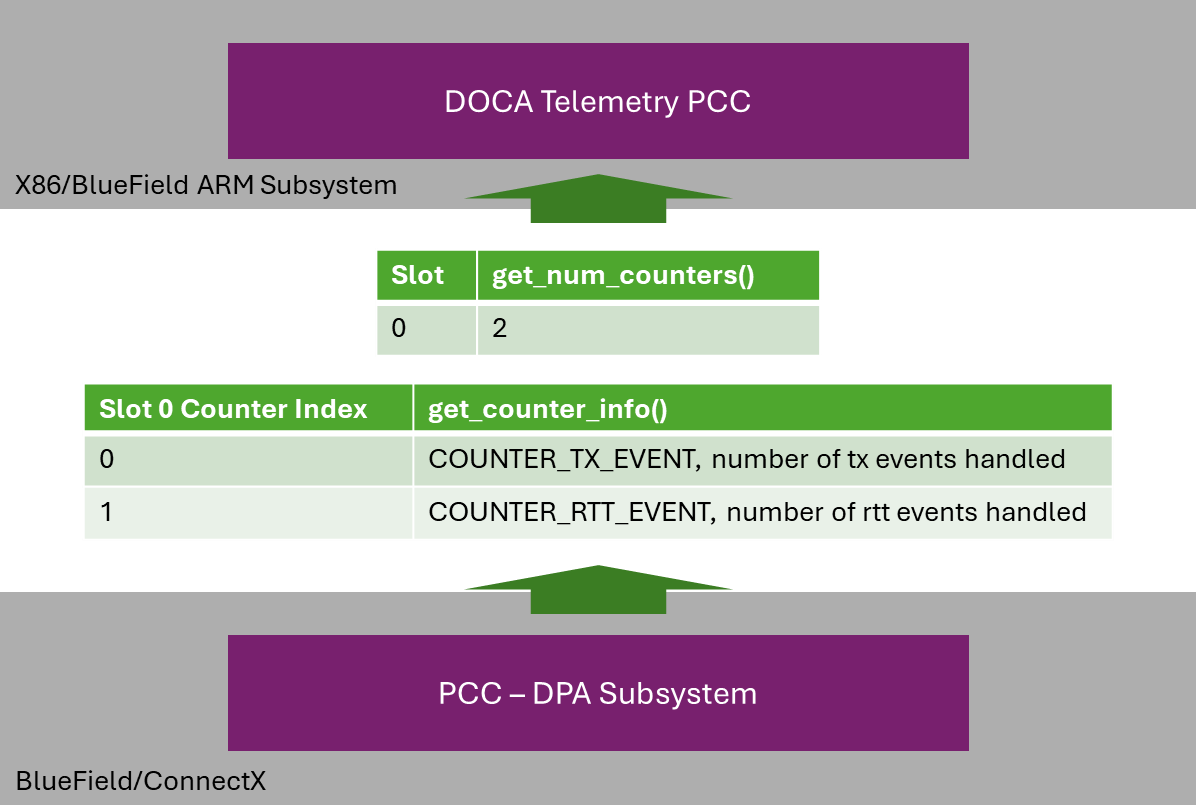
Similar to slots, the counter definitions for each algorithm cannot be modified without re-imaging a new PCC.
DOCA Telemetry PCC allows applications to retrieve the number of counters defined for an algorithm applied to a specific port. Each counter's definition can then be accessed using an index value, ranging from 0 to total_counters-1.
For example:
Run-time Retrieval
Status
The congestion algorithm actively running on a device at any given time is determined by the lowest enabled slot index, as multiple slots can be marked as enabled simultaneously.
The enabling or disabling of a slot can be triggered dynamically at runtime by external processes, independent of DOCA Telemetry PCC. Automatically detecting these changes falls outside the scope of a doca_telemetry_pcc context. It is the user's responsibility to either scan all slots periodically or interface directly with the external process to monitor changes.
In addition to enabling/disabling a slot, counters for a slot can also be enabled or disabled. Only one slot can have active counters at any given time. If counters are not active on an algorithm slot, any attempt to poll their values will result in a DOCA_ERROR_BAD_STATE.
The status of both the slot and its counters can be inspected using the doca_telemetry_pcc_get_algo_enable_status API.
Since PCC configuration is managed outside DOCA Telemetry PCC, there is no guarantee that system conditions remain consistent between API calls. For example, get_algo_enable_status() may indicate that counters are enabled, but subsequent polling of those counters could fail if they were disabled between the calls.
Counters
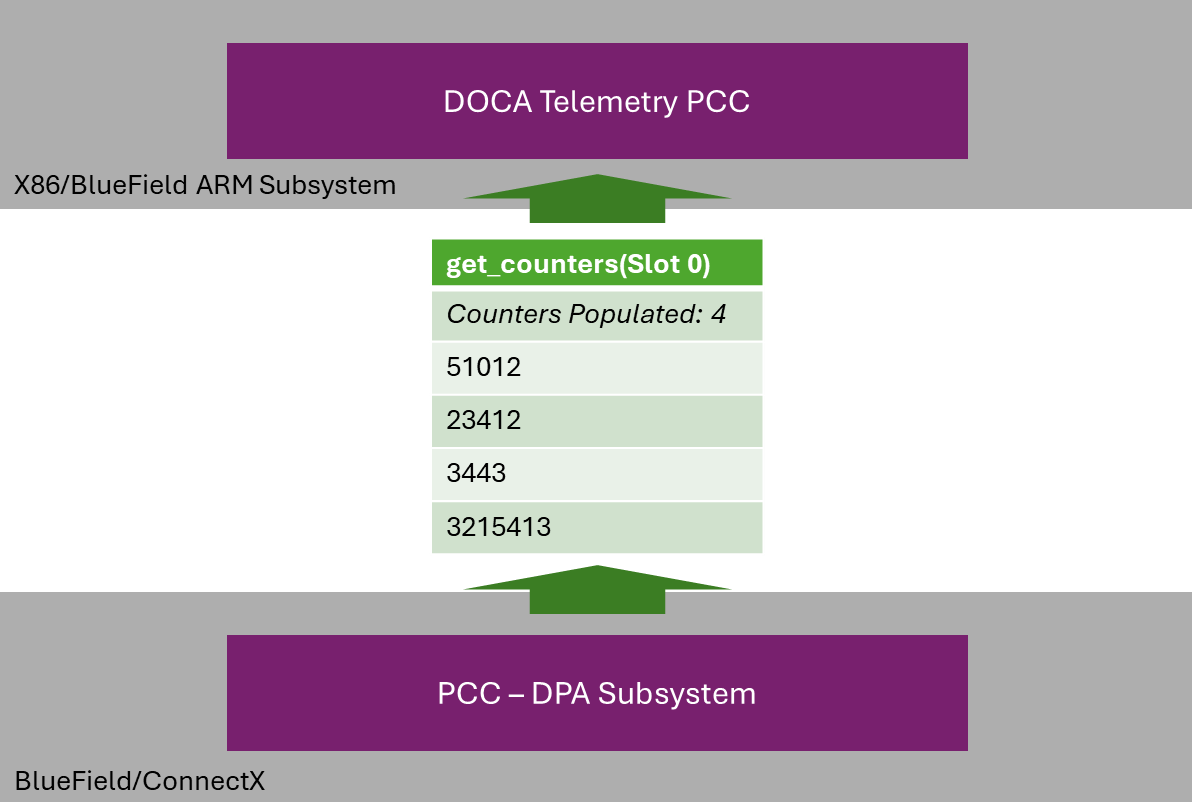
Counter values for a slot with enabled counters can be polled using a doca_telemetry_pcc context associated with a specific device.
When retrieving counter values, the API returns all available counters as a block rather than individually. The counters are provided in an array of 32-bit values, along with the total number of counters populated in the array.
It is assumed that the user is familiar with what each counter index represents (refer to the "DOCA Telemetry PCC | id (3.3.0_Jan26GA)DOCATelemetryPCC CounterInformation" section for details).
DOCA Telemetry PCC provides another API function which enables the resetting of counters if so required.
State Machine
This section outlines the various states the doca_telemetry_pcc context transitions through, the methods for transitioning between these states, and the operations permitted in each state.
Idle
The context has been created and is Idle.
In this state, it is expected for the application to:
-
Destroy the context.
-
Start the context for processing.
Allowed operations:
-
Configuring the context.
It is possible to reach this state as follows:
|
Previous State |
Transition Action |
|---|---|
|
None |
Create the context |
|
Running |
Call stop |
Running
In this state it is expected for the application to:
-
Stop the context.
Allowed operations:
-
Calling stop, moving the application to "Idle" state
It is possible to reach this state as follows:
|
Previous State |
Transition Action |
|---|---|
|
Idle |
Successfully start the context |
There are currently no state restrictions on the majority of API functions.
Alternative Datapath Options
DOCA Telemetry PCC supports only CPU-based datapaths.
DOCA Telemetry PCC Sample
This section describes a telemetry PCC sample based on the doca_telemetry_pcc library. The sample illustrates the utilization of DOCA telemetry PCC APIs to initialize and configure the doca_telemetry_pcc context, as well as querying and parsing PCC schema and counters.
These samples are also available on GitHub.
Running the Sample
-
Refer to the following documents:
-
DOCA Installation Guide for Linux for details on how to install BlueField-related software.
-
NVIDIA BlueField Platform Software Troubleshooting Guide for any issue you may encounter with the installation, compilation, or execution of DOCA samples.
-
-
To build a given sample, run the following command. If you downloaded the sample from GitHub, update the path in the first line to reflect the location of the sample file:
cd /opt/mellanox/doca/samples/doca_telemetry/telemetry_pcc
meson /tmp/build
ninja -C /tmp/build
The binary
doca_telemetry_pccis created under/tmp/build/.
Sample usage:
Usage: doca_telemetry_pcc [DOCA Flags] [Program Flags]

DOCA Flags:
  -h, --help                        Print a help synopsis
  -v, --version                     Print program version information
  -l, --log-level                   Set the (numeric) log level for the program <10=DISABLE, 20=CRITICAL, 30=ERROR, 40=WARNING, 50=INFO, 60=DEBUG, 70=TRACE>
  --sdk-log-level                   Set the SDK (numeric) log level for the program <10=DISABLE, 20=CRITICAL, 30=ERROR, 40=WARNING, 50=INFO, 60=DEBUG, 70=TRACE>
  -j, --json <path>                 Parse command line flags from an input json file

Program Flags:
  -p, --pci-addr                    DOCA device PCI device address
The sample includes:
-
Locating and opening a DOCA device.
-
Creating a
doca_telemetry_pccinstance. -
Parsing all possible slots, printing each:
-
Algo ID
-
Major version
-
Minor version
-
Description
-
-
Determining and displaying the current enabled status of each slot.
-
Counter values and descriptions for any slot with counters enabled.
-
Destroying the
doca_telemetry_pcccontext.
Last updated: