

DOCA Telemetry Diag for Windows is irrelevant to DOCA Linux developers. It is installed as part of the DOCA package to allow for exporting telemetry diagnostics data to management software that is run in a Windows environment.
This guide provides instructions on building and developing applications which require collecting telemetry information provided by NVIDIA® BlueField® and NVIDIA® ConnectX® families of networking platforms.
1. Introduction
doca_telemetry_diag provides programable access to an on-device mechanism which allows sampling of diagnostic data (e.g., statistics and counters). doca_telemetry_diag allows configuring such parameters as required data IDs or sampling period, and retrieving the generated information in several formats.
1.1. Architecture
Diagnostic data is stored in firmware as a cyclic buffer of samples. Each sample represents the values of all the requested diagnostic data IDs and their corresponding sampling timestamps.
1.2. Device and Ownership
The DOCA telemetry library requires a ConnectX/BlueField DOCA device to sample from. The device can be accessed using any of its physical functions (PFs).
The device supports two ownership models:
-
Single domain
-
Multiple domains
1.2.1. Single Domain Ownership Model
In this ownership model only one domain exists per device. Upon creation, the doca_telemetry_diag context assumes control of the associated hardware resources to prevent conflicts and ensure accurate data sampling. In rare instances, ownership may be overridden (e.g., if a process crashes before releasing ownership).
The force_ownership parameter may be used when creating the context from a second process.
Once ownership is enforced for one PF, it cannot be claimed by a different PF. It is recommended to always use PF0 to prevent potential conflicts.
1.2.2. Multi Domain Ownership Model
In this ownership model a device can support multiple domains. Each doca_telemetry_diag context will use one of the available domains. This allows for the case where if the first domain does not use all the hardware resources then a second domain could be created to utilize the remaining resources. There are some technical limitations when using multi domain mode, the most notable of these are:
-
Synchronized start is not supported.
-
Some Data ID values require a hardware resource that cannot be shared between domains. If another domain attempts to use a Data ID which requires the occupied hardware resource, it will be rejected
-
The force ownership flag is ignored.
-
The achieved sampling period for a context can be impacted by any already started contexts on the same device.
If multiple devices exist in a setup, a doca_telemetry_diag context should be created for each individual domain.
WinOF-2 provides specific commands to switch between single-domain and multi-domain mode.
For WinOF-2 users, there is not any difference for a single doca_telemetry_diag instance to run under single-domain or multi-domain mode. User applications developed for single-domain mode does not need any change to run under multi-domain mode.
1.3. Configuration Phase
1.3.1. Configuration
The context can be configured to match the application use case.
To discover if a certain configuration is supported, or what the min/max value for it is, refer to section "Device Support".
1.3.1.1. Sampling Mode
The DOCA Telemetry Diagnostics library supports the following operational sampling methods:
-
Single sampling – Samples are collected and stored until the firmware buffer is filled, at which point sampling is automatically terminated.
You can manually restart the context to collect new samples, which will overwrite the previous data in the buffer.
-
Repetitive sampling – Samples are continuously collected. When the firmware buffer fills, new samples automatically overwrite the oldest samples. This process continues indefinitely until the context is explicitly stopped.
-
On demand – The device does not continuously collect samples in the background. Instead, the device fetches a single sample of the data strictly upon each manual query.
1.3.1.1.1. Considerations for Repetitive Sampling Mode
When configuring the DOCA Telemetry Diagnostics library to repetitive sampling, it is important to ensure that the firmware buffer is adequately sized to handle the data flow between hardware sampling and software retrieval. The firmware buffer size is dictated by the log_max_num_samples property.
-
Determine sampling rates:
-
Hardware sampling rate – the frequency at which the hardware collects data (e.g., every 100 µsec)
-
Software retrieval rate – the average time interval between successive data retrievals by the software (e.g., every 500 msec)
-
Calculate AverageSamplesPerRetrieval using the following equation:
'%3e%3cg transform='translate(167%2c0)'%3e%3cg transform='translate(-13%2c0)'%3e%3cg transform='translate(0%2c68)'%3e%3cuse xlink:href='%23MJMATHI-41' x='0' y='0'%3e%3c/use%3e%3cuse xlink:href='%23MJMATHI-76' x='750' y='0'%3e%3c/use%3e%3cuse xlink:href='%23MJMATHI-65' x='1236' y='0'%3e%3c/use%3e%3cuse xlink:href='%23MJMATHI-72' x='1702' y='0'%3e%3c/use%3e%3cuse xlink:href='%23MJMATHI-61' x='2154' y='0'%3e%3c/use%3e%3cuse xlink:href='%23MJMATHI-67' x='2683' y='0'%3e%3c/use%3e%3cuse xlink:href='%23MJMATHI-65' x='3164' y='0'%3e%3c/use%3e%3cuse xlink:href='%23MJMATHI-53' x='3630' y='0'%3e%3c/use%3e%3cuse xlink:href='%23MJMATHI-61' x='4276' y='0'%3e%3c/use%3e%3cuse xlink:href='%23MJMATHI-6D' x='4805' y='0'%3e%3c/use%3e%3cuse xlink:href='%23MJMATHI-70' x='5684' y='0'%3e%3c/use%3e%3cuse xlink:href='%23MJMATHI-6C' x='6187' y='0'%3e%3c/use%3e%3cuse xlink:href='%23MJMATHI-65' x='6486' y='0'%3e%3c/use%3e%3cuse xlink:href='%23MJMATHI-73' x='6952' y='0'%3e%3c/use%3e%3cuse xlink:href='%23MJMATHI-50' x='7422' y='0'%3e%3c/use%3e%3cuse xlink:href='%23MJMATHI-65' x='8173' y='0'%3e%3c/use%3e%3cuse xlink:href='%23MJMATHI-72' x='8640' y='0'%3e%3c/use%3e%3cuse xlink:href='%23MJMATHI-52' x='9091' y='0'%3e%3c/use%3e%3cuse xlink:href='%23MJMATHI-65' x='9851' y='0'%3e%3c/use%3e%3cuse xlink:href='%23MJMATHI-74' x='10317' y='0'%3e%3c/use%3e%3cuse xlink:href='%23MJMATHI-72' x='10679' y='0'%3e%3c/use%3e%3cuse xlink:href='%23MJMATHI-69' x='11130' y='0'%3e%3c/use%3e%3cuse xlink:href='%23MJMATHI-65' x='11476' y='0'%3e%3c/use%3e%3cuse xlink:href='%23MJMATHI-76' x='11942' y='0'%3e%3c/use%3e%3cuse xlink:href='%23MJMATHI-61' x='12428' y='0'%3e%3c/use%3e%3cuse xlink:href='%23MJMATHI-6C' x='12957' y='0'%3e%3c/use%3e%3cuse xlink:href='%23MJMAIN-3D' x='13533' y='0'%3e%3c/use%3e%3cg transform='translate(14312%2c0)'%3e%3cg transform='translate(397%2c0)'%3e%3crect stroke='none' width='5762' height='60' x='0' y='220'%3e%3c/rect%3e%3cg transform='translate(101%2c440)'%3e%3cuse transform='scale(0.707)' xlink:href='%23MJMATHI-52' x='0' y='0'%3e%3c/use%3e%3cuse transform='scale(0.707)' xlink:href='%23MJMATHI-65' x='759' y='0'%3e%3c/use%3e%3cuse transform='scale(0.707)' xlink:href='%23MJMATHI-74' x='1226' y='0'%3e%3c/use%3e%3cuse transform='scale(0.707)' xlink:href='%23MJMATHI-72' x='1587' y='0'%3e%3c/use%3e%3cuse transform='scale(0.707)' xlink:href='%23MJMATHI-69' x='2039' y='0'%3e%3c/use%3e%3cuse transform='scale(0.707)' xlink:href='%23MJMATHI-65' x='2384' y='0'%3e%3c/use%3e%3cuse transform='scale(0.707)' xlink:href='%23MJMATHI-76' x='2851' y='0'%3e%3c/use%3e%3cuse transform='scale(0.707)' xlink:href='%23MJMATHI-61' x='3336' y='0'%3e%3c/use%3e%3cuse transform='scale(0.707)' xlink:href='%23MJMATHI-6C' x='3866' y='0'%3e%3c/use%3e%3cuse transform='scale(0.707)' xlink:href='%23MJMATHI-49' x='4164' y='0'%3e%3c/use%3e%3cuse transform='scale(0.707)' xlink:href='%23MJMATHI-6E' x='4669' y='0'%3e%3c/use%3e%3cuse transform='scale(0.707)' xlink:href='%23MJMATHI-74' x='5269' y='0'%3e%3c/use%3e%3cuse transform='scale(0.707)' xlink:href='%23MJMATHI-65' x='5631' y='0'%3e%3c/use%3e%3cuse transform='scale(0.707)' xlink:href='%23MJMATHI-72' x='6097' y='0'%3e%3c/use%3e%3cuse transform='scale(0.707)' xlink:href='%23MJMATHI-76' x='6549' y='0'%3e%3c/use%3e%3cuse transform='scale(0.707)' xlink:href='%23MJMATHI-61' x='7034' y='0'%3e%3c/use%3e%3cuse transform='scale(0.707)' xlink:href='%23MJMATHI-6C' x='7564' y='0'%3e%3c/use%3e%3c/g%3e%3cg transform='translate(60%2c-425)'%3e%3cuse transform='scale(0.707)' xlink:href='%23MJMATHI-53' x='0' y='0'%3e%3c/use%3e%3cuse transform='scale(0.707)' xlink:href='%23MJMATHI-61' x='645' y='0'%3e%3c/use%3e%3cuse transform='scale(0.707)' xlink:href='%23MJMATHI-6D' x='1175' y='0'%3e%3c/use%3e%3cuse transform='scale(0.707)' xlink:href='%23MJMATHI-70' x='2053' y='0'%3e%3c/use%3e%3cuse transform='scale(0.707)' xlink:href='%23MJMATHI-6C' x='2557' y='0'%3e%3c/use%3e%3cuse transform='scale(0.707)' xlink:href='%23MJMATHI-69' x='2855' y='0'%3e%3c/use%3e%3cuse transform='scale(0.707)' xlink:href='%23MJMATHI-6E' x='3201' y='0'%3e%3c/use%3e%3cuse transform='scale(0.707)' xlink:href='%23MJMATHI-67' x='3801' y='0'%3e%3c/use%3e%3cuse transform='scale(0.707)' xlink:href='%23MJMATHI-49' x='4282' y='0'%3e%3c/use%3e%3cuse transform='scale(0.707)' xlink:href='%23MJMATHI-6E' x='4786' y='0'%3e%3c/use%3e%3cuse transform='scale(0.707)' xlink:href='%23MJMATHI-74' x='5387' y='0'%3e%3c/use%3e%3cuse transform='scale(0.707)' xlink:href='%23MJMATHI-65' x='5748' y='0'%3e%3c/use%3e%3cuse transform='scale(0.707)' xlink:href='%23MJMATHI-72' x='6214' y='0'%3e%3c/use%3e%3cuse transform='scale(0.707)' xlink:href='%23MJMATHI-76' x='6666' y='0'%3e%3c/use%3e%3cuse transform='scale(0.707)' xlink:href='%23MJMATHI-61' x='7151' y='0'%3e%3c/use%3e%3cuse transform='scale(0.707)' xlink:href='%23MJMATHI-6C' x='7681' y='0'%3e%3c/use%3e%3c/g%3e%3c/g%3e%3c/g%3e%3c/g%3e%3c/g%3e%3c/g%3e%3c/g%3e%3c/svg%3e)
For example:
'%3e%3cg transform='translate(167%2c0)'%3e%3cg transform='translate(-13%2c0)'%3e%3cg transform='translate(0%2c-47)'%3e%3cuse xlink:href='%23MJMATHI-42' x='0' y='0'%3e%3c/use%3e%3cuse xlink:href='%23MJMATHI-75' x='759' y='0'%3e%3c/use%3e%3cuse xlink:href='%23MJMATHI-66' x='1332' y='0'%3e%3c/use%3e%3cuse xlink:href='%23MJMATHI-66' x='1882' y='0'%3e%3c/use%3e%3cuse xlink:href='%23MJMATHI-65' x='2433' y='0'%3e%3c/use%3e%3cuse xlink:href='%23MJMATHI-72' x='2899' y='0'%3e%3c/use%3e%3cuse xlink:href='%23MJMATHI-53' x='3351' y='0'%3e%3c/use%3e%3cuse xlink:href='%23MJMATHI-69' x='3996' y='0'%3e%3c/use%3e%3cuse xlink:href='%23MJMATHI-7A' x='4342' y='0'%3e%3c/use%3e%3cuse xlink:href='%23MJMATHI-65' x='4810' y='0'%3e%3c/use%3e%3cuse xlink:href='%23MJMAIN-3D' x='5554' y='0'%3e%3c/use%3e%3cuse xlink:href='%23MJMAIN-32' x='6611' y='0'%3e%3c/use%3e%3cuse xlink:href='%23MJMAIN-D7' x='7333' y='0'%3e%3c/use%3e%3cuse xlink:href='%23MJMATHI-41' x='8334' y='0'%3e%3c/use%3e%3cuse xlink:href='%23MJMATHI-76' x='9085' y='0'%3e%3c/use%3e%3cuse xlink:href='%23MJMATHI-65' x='9570' y='0'%3e%3c/use%3e%3cuse xlink:href='%23MJMATHI-72' x='10037' y='0'%3e%3c/use%3e%3cuse xlink:href='%23MJMATHI-61' x='10488' y='0'%3e%3c/use%3e%3cuse xlink:href='%23MJMATHI-67' x='11018' y='0'%3e%3c/use%3e%3cuse xlink:href='%23MJMATHI-65' x='11498' y='0'%3e%3c/use%3e%3cuse xlink:href='%23MJMATHI-53' x='11965' y='0'%3e%3c/use%3e%3cuse xlink:href='%23MJMATHI-61' x='12610' y='0'%3e%3c/use%3e%3cuse xlink:href='%23MJMATHI-6D' x='13140' y='0'%3e%3c/use%3e%3cuse xlink:href='%23MJMATHI-70' x='14018' y='0'%3e%3c/use%3e%3cuse xlink:href='%23MJMATHI-6C' x='14522' y='0'%3e%3c/use%3e%3cuse xlink:href='%23MJMATHI-65' x='14820' y='0'%3e%3c/use%3e%3cuse xlink:href='%23MJMATHI-73' x='15287' y='0'%3e%3c/use%3e%3cuse xlink:href='%23MJMATHI-50' x='15756' y='0'%3e%3c/use%3e%3cuse xlink:href='%23MJMATHI-65' x='16508' y='0'%3e%3c/use%3e%3cuse xlink:href='%23MJMATHI-72' x='16974' y='0'%3e%3c/use%3e%3cuse xlink:href='%23MJMATHI-52' x='17426' y='0'%3e%3c/use%3e%3cuse xlink:href='%23MJMATHI-65' x='18185' y='0'%3e%3c/use%3e%3cuse xlink:href='%23MJMATHI-74' x='18652' y='0'%3e%3c/use%3e%3cuse xlink:href='%23MJMATHI-72' x='19013' y='0'%3e%3c/use%3e%3cuse xlink:href='%23MJMATHI-69' x='19465' y='0'%3e%3c/use%3e%3cuse xlink:href='%23MJMATHI-65' x='19810' y='0'%3e%3c/use%3e%3cuse xlink:href='%23MJMATHI-76' x='20277' y='0'%3e%3c/use%3e%3cuse xlink:href='%23MJMATHI-61' x='20762' y='0'%3e%3c/use%3e%3cuse xlink:href='%23MJMATHI-6C' x='21292' y='0'%3e%3c/use%3e%3c/g%3e%3c/g%3e%3c/g%3e%3c/g%3e%3c/svg%3e)
-
To ensure smooth data processing and prevent data loss, the firmware buffer should be large enough to accommodate at least twice the average number of samples collected during the retrieval period:
For example:
'%3e%3cg transform='translate(167%2c0)'%3e%3cg transform='translate(-13%2c0)'%3e%3cg transform='translate(0%2c-50)'%3e%3cuse xlink:href='%23MJMAIN-32' x='0' y='0'%3e%3c/use%3e%3cuse xlink:href='%23MJMAIN-D7' x='722' y='0'%3e%3c/use%3e%3cg transform='translate(1723%2c0)'%3e%3cuse xlink:href='%23MJMAIN-35'%3e%3c/use%3e%3cuse xlink:href='%23MJMAIN-30' x='500' y='0'%3e%3c/use%3e%3cuse xlink:href='%23MJMAIN-30' x='1001' y='0'%3e%3c/use%3e%3cuse xlink:href='%23MJMAIN-30' x='1501' y='0'%3e%3c/use%3e%3c/g%3e%3cuse xlink:href='%23MJMAIN-3D' x='4003' y='0'%3e%3c/use%3e%3cg transform='translate(5059%2c0)'%3e%3cuse xlink:href='%23MJMAIN-31'%3e%3c/use%3e%3cuse xlink:href='%23MJMAIN-30' x='500' y='0'%3e%3c/use%3e%3cuse xlink:href='%23MJMAIN-30' x='1001' y='0'%3e%3c/use%3e%3cuse xlink:href='%23MJMAIN-30' x='1501' y='0'%3e%3c/use%3e%3cuse xlink:href='%23MJMAIN-30' x='2002' y='0'%3e%3c/use%3e%3c/g%3e%3c/g%3e%3c/g%3e%3c/g%3e%3c/g%3e%3c/svg%3e)
Moreover, the number of retrieved samples should be enlarged if the retrieving process may spike occasionally. For example, if the process time between retrieval calls is up to 6 times of the average, then the number of samples should be multiplied by 6+1=7.
1.3.1.2. Sampling Period
The sampling period can be configured using doca_telemetry_diag_set_sample_period.
In some cases, depending on the number and type of data IDs configured, the actual sampling period may be higher. The actual sampling period can be queried using doca_telemetry_diag_get_sample_period after configuring the data IDs.
After starting the doca_telemetry_diag context with doca_telemetry_diag_start, the actual sampling period may differ from the desired sampling rate. To address this, you can dynamically adjust the sampling period using doca_telemetry_diag_reconfig_sample_period.
1.3.1.3. Synchronized Start
Diagnostics data is sampled by the device every given sampling period. When sampling this way, each data entry in a sample may be recorded at a slightly different time.
Synchronized start mode enables diagnostics counters to begin all data measurements at the same time (i.e., during the same clock cycle). This way, the sample period is guaranteed to be identical for all samples. Synchronized start diagnostic counters can be configured to be cleared at the beginning of each sampling period.
Not all data IDs can be sampled in synchronized start mode. See section “List of Supported Data IDs” for additional details.
The following diagrams illustrate how synchronized start affects the sampling timeline:
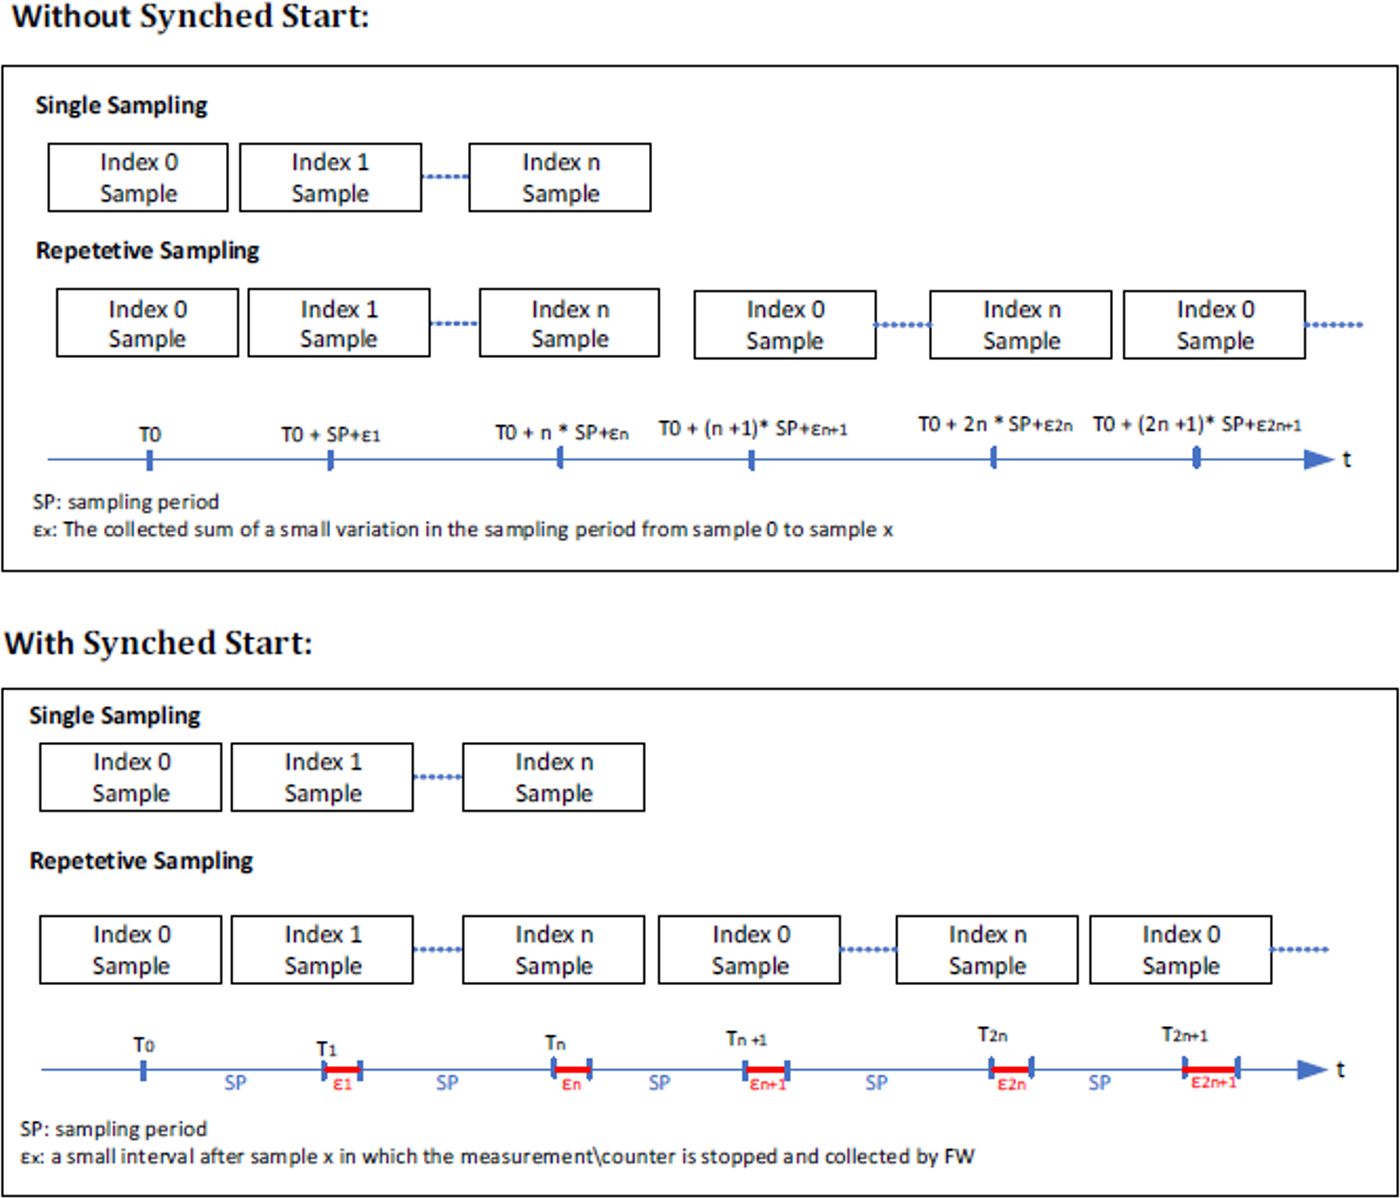
In synchronized start mode, counters are stopped during the collection time of each sample (illustrated in red in the diagram). If the application is required to normalize the counter to time, the actual sample period should be considered.
For example, if the global_icmc_hit (GIH) counter is sampled and the sample period is 100 µsec, then the global_icmc_hit per second, should be calculated as follows:

1.3.1.4. Data IDs
The on-device mechanism provides the following diagnostic data classes:
-
Counter – monotonically increasing and counting different events in the device.
-
If
doca_telemetry_diag_set_data_clearis set, the counters are cleared at the beginning of each sampling period (valid only if synchronized start mode is used and operational mode is set to single or repetitive sampling).
-
-
Statistic – other collected diagnostic data about the performance of the device. Statistic diagnostic data is cleared on each sample.
Each diagnostic data is represented by a unique identifier, the data ID. Appendix "List of Supported Data IDs" lists the currently supported data IDs.
After applying the configuration, the list of data IDs to be sampled should be applied by calling doca_telemetry_diag_apply_counters_list_by_id.
-
Configuration failures – Not all combinations of data IDs can be configured simultaneously. If the
doca_telemetry_diag_apply_counters_list_by_idoperation fails, it will return the index of the faulty data ID and the reason for the failure. You can retry the operation after omitting the faulty ID. -
Synchronized start support – Not all data IDs support synchronized start mode. If you configure synchronized start and the apply operation fails with
DOCA_ERROR_BAD_CONFIG, the specified data ID does not support this mode.
1.3.1.5. Output Formats
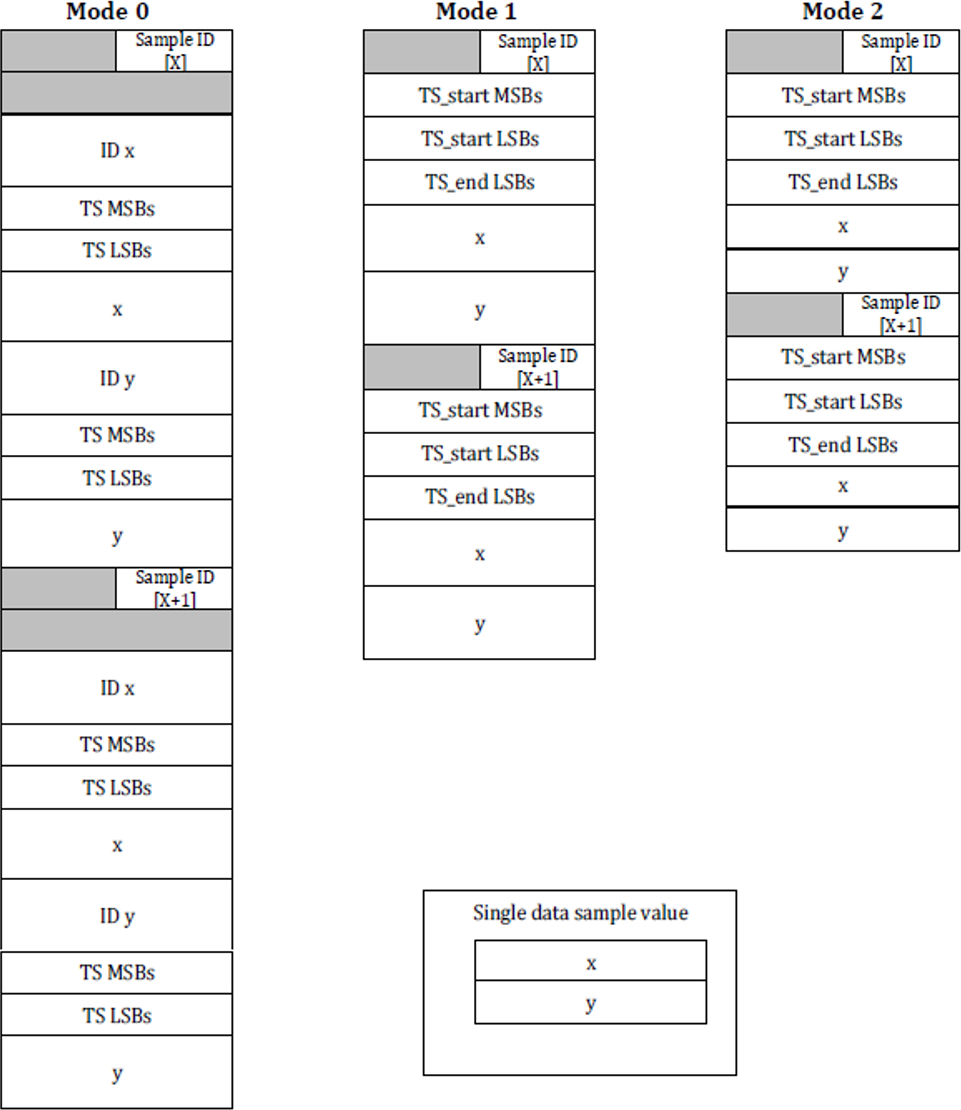
The doca_telemetry_diag context supports the following layout modes for sampled data:
|
Layout Mode |
Data ID Presence |
Data Size |
Timestamp Granularity |
|---|---|---|---|
|
Mode 0 |
Included in output |
64 bits |
Per data entry |
|
Mode 1 |
Omitted from output |
64 bits |
Per sample (start and end) |
|
Mode 2 |
Omitted from output |
32 bits |
Per sample (start and end) |
The order of the data IDs in the output strictly matches the order in which they were applied using doca_telemetry_diag_apply_counters_list_by_id.
The sample layout of these modes is illustrated in the following diagrams:
1.3.2. Device Support
DOCA Telemetry Diagnostics requires a device to operate. For picking a device, refer to "DOCA Core Device Discovery".
As device capabilities may change (see DOCA Core Device Support), it is recommended to select your device using the following method:
-
doca_telemetry_diag_cap_is_supported
Some devices can allow different capabilities as follows:
-
The maximum number of data IDs
-
The maximum number of samples that can be held by the firmware
-
Support for data clear
-
Support for synchronized start
-
Support for different sample modes
-
Support for different timestamp sources
1.4. Execution Phase
Once the doca_telemetry_diag context is started, samples can be retrieved by calling the doca_telemetry_diag_query_counters function.
The library only retrieves new samples without duplications and returns fewer samples than requested if there are no more new samples.
There is a slight difference in behavior between the different sampling modes:
-
In case of "On demand" sampling mode, each time the
doca_telemetry_diag_query_countersis called, a new sample is captured and retrieved. -
For "Single" and "Repetitive" sampling modes, multiple samples can be retrieved in a single call. The application defines the maximum number of samples it wishes to retrieve and supplies a buffer large enough to contain these samples.
-
In case of "Single" sampling mode, once sampling is terminated, the user may call
doca_telemetry_diag_restartto restart the sampling process, overwriting the previous results. -
During the execution phase, you can dynamically adjust the sampling period using
doca_telemetry_diag_reconfig_sample_periodto change the sampling rate. Note that this function has no effect in "On demand" sampling mode. For other sampling modes, it's recommended to verify the actual sampling period usingdoca_telemetry_diag_get_sample_periodafter reconfiguration to ensure it matches the expected value.
For "Single" and "Repetitive" sampling modes:
-
The sample size can be obtained using
doca_telemetry_diag_get_sample_size -
The user should limit the number of requested samples according to the
log_max_num_samplesproperty
1.5. State Machine
The following section describes the different states the doca_telemetry_diag context goes through, how to move between states and what is allowed in each state.
1.5.1. Idle
The context is Idle and has ownership of a diagnostics data domain.
In this state it is expected for the application to:
-
Destroy the context (releases the ownership).
-
Apply a configuration, moving the context to "Configured" state.
Allowed operations:
-
Configuring the context according to section Configurations.
It is possible to reach this state as follows:
|
Previous State |
Transition Action |
|---|---|
|
None |
Create the context |
|
Configured |
Call stop |
|
Ready |
Call stop |
|
Running |
Call stop |
1.5.2. Configured
In this state it is expected for application to:
-
Apply the list of data IDs configuration using
doca_telemetry_diag_apply_counters_list_by_id, moving the context to "Ready" state.
Allowed operations:
-
Checking if a data ID is supported using
doca_telemetry_diag_check_data_id -
Calling stop, moving it to "Idle" state
It is possible to reach this state as follows:
|
Previous State |
Transition Action |
|---|---|
|
Idle |
Successfully apply the configuration, calling |
1.5.3. Ready
All the necessary configuration was applied and the context is ready to start sampling.
In this state it is expected that application:
-
Start the context, moving it to "Running" state.
Allowed operations:
-
Calling stop, moving it to "Idle" state.
It is possible to reach this state as follows:
|
Previous State |
Transition Action |
|---|---|
|
Configured |
Successfully apply the list of counters, calling |
1.5.4. Running
In this state samples are generated and can be retrieved.
In this state it is expected that application:
-
Query the counters.
Allowed operations:
-
For "Single" sample mode, restarting the context if needed.
-
Calling stop, moving it to "Idle" state
It is possible to reach this state as follows:
|
Previous State |
Transition Action |
|---|---|
|
Ready |
Successfully start the context |
2. Prerequisites
The Windows system must meet the following baseline requirements:
2.1. WinOF-2 Package
The WinOF-2 package (containing the doca_telemetry_diag distribution) is installed or extracted
2.2. Environment
DOCA Telemetry Diag applications can run on the host machine (ConnectX-7 or BlueField-3 and above) for both x86_64 and ARM64 platform.
2.3. Acceptable Windows PCI Address Format
-
Bus:Device.Function (XX:XX.X)
-
This format is identical to the Linux format
-
-
Segment:Bus:Device.Function (XXXX:XX:XX.X)
-
The “segment“ is equivalent to the “domain“ in Linux
-
Thus this format is identical to the Linux format
-
-
SegmentBus:Device.Function (XXXX:XX.X)
-
The value-of-SegmentBus = value-of-Segment * 256 + value-of-Bus
-
This is only for Windows
-
-
For example, on a ARM64 Windows server, we can get the following available Mellanox devices PCI address:
> mlx5cmd -stat
the pci segment is part of the bus dword
NIC 1: physical_location=Bus 3, Device 0, Function 0
NIC 2: physical_location=Bus 515, Device 0, Function 0
NIC 3: physical_location=Bus 4099, Device 0, Function 0
NIC 4: physical_location=Bus 4611, Device 0, Function 0
-
Then, users need to manually change decimal value to hex value:
|
Decimal Value |
Segment:Bus Format |
SegmentBus Format |
|---|---|---|
|
515 = 2 * 256 + 3 |
0002:03 |
0203 |
|
4099 = 16 * 256 + 3 |
0010:03 |
1003 |
|
4611 = 18 * 256 + 3 |
0012:03 |
1203 |
-
Thus, the acceptable address for the above 4 NICs are
|
NIC |
XX:XX.X |
XXXX:XX:XX.X |
XXXX:XX.X |
|---|---|---|---|
|
1 |
03:00.0 |
0000:03:00.0 |
0003:00.0 |
|
2 |
none |
0002:03:00.0 |
0203:00.0 |
|
3 |
none |
0010:03:00.0 |
1003:00.0 |
|
4 |
none |
0012:03:00.0 |
1203:00.0 |
3. DOCA Telemetry Diagnostics Sample
This section describes a telemetry diagnostics sample based on the doca_telemetry_diag library.
The sample illustrates the usage of DOCA telemetry diagnostics APIs to initialize and configure the doca_telemetry_diag context, as well as querying and parsing diagnostic counters.
3.1. Building the Sample
After the WinOF-2 package is installed or extracted, the customer can find the doca_telemetry_diagsample code directory, and all the necessary DOCA header files.
Windows customers Only need to install WinOF-2 package, but do NOT need to install WinOF-2 DevX SDK.
3.1.1. Sample steps to build customer own json-c library
Open a Windows command terminal:
> git clone https://github.com/Microsoft/vcpkg.git
> cd vcpkg
> bootstrap-vcpkg.sh
> bootstrap-vcpkg.bat
> vcpkg.exe integrate install
> vcpkg.exe install json-c
There are many different ways to install json-c library for Windows, the above sample is just a demo based on the “Windows Server 2022 Datacenter” on x86_64 platform, it may be not suitable for other Windows platform.
3.1.2. Build Sample Command
> cd $CUSTOEMR_DOCA_TELMETRY_DIAG_SAMPLE_DIRECTORY
> meson setup build -Djson_c_root=$THE_ABOVE_JSON_C_DIRECTORY
> ninja -C build
The proper json_c_root must be provided.
3.2. Running the Sample
3.2.1. Sample Usage
Usage: doca_telemetry_diag [DOCA Flags] [Program Flags]

DOCA Flags:
  -h, --help                        Print a help synopsis
  -v, --version                     Print program version information
  -l, --log-level                   Set the (numeric) log level for the program <10=DISABLE, 20=CRITICAL, 30=ERROR, 40=WARNING, 50=INFO, 60=DEBUG, 70=TRACE>
  --sdk-log-level                   Set the SDK (numeric) log level for the program <10=DISABLE, 20=CRITICAL, 30=ERROR, 40=WARNING, 50=INFO, 60=DEBUG, 70=TRACE>
  -j, --json <path>                 Parse command line flags from an input json file

Program Flags:
  -p, --pci-addr                    DOCA device PCI device address
  -di, --data-ids                   Path to data ids JSON file
  -o, --output                      Output CSV file - default: "/tmp/out.csv"
  -rt, --sample-run-time            Total sample run time, in seconds
  -sp, --sample-period              Sample period, in nanoseconds
  -ns, --log-num-samples            Log max number of samples
  -sr, --max-samples-per-read       Max num samples per read
  -sm, --sample-mode                sample mode (0 - single, 1 - repetitive, 2 - on demand)
  -of, --output-format              output format (0 - output_format_0, 1 - output_format_1, 2 - output_format_2)
  -sym, --sync-mode                 sync mode (0 - sync_mode_no_sync, 1 - sync_mode_sync_start)
  -tss, --timestamp-source          timestamp source (0 - timestamp_source_frc, 1 - timestamp_source_rtc)
  -f, --force-ownership             Force ownership when creating context
  -e, --example-json-path           Generate an example json file with the default data_ids to the given path and exit immediately. This file can be used as input later on. All other flags are ignored
  -rs, --reconfig-sample-period     Reconfig sample period, in nanoseconds. It means after the first sampling run with the sample_period, if the reconfig_sample_period is non-0, before the current diag instance is stopped and destroyed, the second sampling run will be done based on the reconfig_sample_period.
3.2.2. Sample Logic
-
Locating a DOCA device.
-
Initializing and configuring the
doca_telemetry_diaginstance. -
Applying a list of data IDs to sample (either from a source JSON file or the default data IDs).
-
Starting the
doca_telemetry_diaginstance. -
Allocating a buffer according to the sample size and amount of desired samples.
-
Querying the actual sampling period, after start.
-
Retrieving samples and writing the retrieved data to a
*.csvfile (either once or periodically). -
If
reconfig_sample_periodis non-zero, retrieving samples and writing the sample file again based on the reconfigured sampling period. -
Stopping the data IDs sampling.
-
Releasing all resources and destroying the context.
If the error message cannot acquire ownership is shown: you can use the command option --force-ownership to take the ownership (this may; reclaim an isolated context if a process failed to release it previously, or forcefully take control from an existing process. Use this option with caution)
The sample can use data IDs given by the user using a JSON file. An example of the JSON file format can be created by using the -e flag on the sample, to export an example JSON file containing the default data IDs to a given path.
3.2.3. Sample Running Commands with Different PCI Address
> doca_telemetry_diag.exe -p 03:00.0
[2026-04-30 15:43:04:801018][7640][DOCA][INF][CORE][doca_log.cpp:1281][_common_write_version_to_backend] DOCA version 3.5.0011
[2026-04-30 15:43:04:802139][7640][DOCA][INF][TELEMETRY_DIAG][telemetry_diag_main.c:1012][main] Starting the sample
[2026-04-30 15:43:05:821181][7640][DOCA][INF][TELEMETRY_DIAG][telemetry_diag_main.c:1069][main] Sample finished successfully

> doca_telemetry_diag.exe -p 1203:00.0
[2026-04-30 15:43:04:801018][7640][DOCA][INF][CORE][doca_log.cpp:1281][_common_write_version_to_backend] DOCA version 3.5.0011
[2026-04-30 15:43:04:802139][7640][DOCA][INF][TELEMETRY_DIAG][telemetry_diag_main.c:1012][main] Starting the sample
[2026-04-30 15:43:05:821181][7640][DOCA][INF][TELEMETRY_DIAG][telemetry_diag_main.c:1069][main] Sample finished successfully
4. Appendix – List of Supported Data IDs
The following table lists the data IDs currently supported by DOCA:
|
Name |
Description |
Data Class |
Data ID |
|---|---|---|---|
|
|
The number of received bytes on the physical port.[1] |
Counter |
0x10200001000000XX
|
|
|
The number of received bytes on the physical port and priority.[1] |
Counter |
0x1020000200000YXX
|
|
|
The number of received packets on the physical port.[1] |
Counter |
0x10200003000000XX
|
|
|
The number of received packets on the physical port and priority.[1] |
Counter |
0x1020000400000YXX
|
|
|
The number of received packets dropped due to lack of buffers on a physical port. |
Counter |
0x10200005000000XX
|
|
|
The number of link-layer pause packets received on a physical port and priority. |
Counter |
0x1020000600000YXX
|
|
|
The number of packets discarded due to no available data or descriptor buffers in the RX buffer, per host. |
Counter |
0x10400001000000XX
|
|
|
The number of packets that pass from the RX Transport to the Scatter engine, per host. |
Counter |
0x10800001000000XX
|
|
|
The number of dropped packets due to a lack of WQE for the associated QPs/RQs (excluding hairpin QPs/RQs). |
Counter |
0x10800002000000XX
|
|
|
The number of dropped packets due to a lack of WQE for the associated hairpin QPs/RQs. |
Counter |
0x10800003000000XX
|
|
|
The number of RoCEv2 packets received by the notification point which were marked for experiencing the congestion (i.e., ECN bits |
Counter |
0x10800004000000XX
|
|
|
The number of CNP received packets handled by the Reaction Point, per port. |
Counter |
0x10800005000000XX
|
|
|
The number of CNP packets sent by the Notification Point, per port. |
Counter |
0x11000001000000XX
|
|
|
The number of QP de-scheduled due to congestion control rate limitation. |
Counter |
0x1100000200000000 |
|
|
The number of transmitted bytes on the physical port (excluding loopback traffic). |
Counter |
0x11400001000000XX
|
|
|
The number of transmitted bytes on the physical port and priority (excluding loopback traffic). |
Counter |
0x1140000200000YXX
|
|
|
The number of transmitted packets on the physical port (excluding loopback traffic). |
Counter |
0x11400003000000XX
|
|
|
The number of transmitted packets on the physical port and priority (excluding loopback traffic). |
Counter |
0x1140000400000YXX
|
|
|
The number of link–layer pause packets transmitted on a physical port and priority. |
Counter |
0x1140000500000YXX
|
|
|
The number of bytes received from the PCIe toward the device, per PCIe link. |
Counter |
0x1160000100ZZYYXX
|
|
|
The number of bytes transmitted from the device toward the PCIe, per PCIe link. |
Counter |
0x1160000200ZZYYXX
|
|
|
The number of data bytes received from the PCIe (excluding headers) toward the device, per PCIe link. |
Counter |
0x1160000300ZZYYXX
|
|
|
The number of data bytes transmitted from the device toward the PCI (excluding headers), per PCIe link. |
Counter |
0x1160000400ZZYYXX
|
|
|
The time period (in nanoseconds) in which the device had outbound posted write requests but stalled due to insufficient data credits per PCIe link. |
Counter |
0x1160000500ZZYYXX
|
|
|
The time period (in nanoseconds) in which the device had outbound posted write requests but stalled due to insufficient header credits per PCIe link. |
Counter |
0x1160000600ZZYYXX
|
|
|
The time period (in nanoseconds) in which the device had outbound non-posted read requests but stalled due to insufficient data credits per PCIe link. |
Counter |
0x1160000700ZZYYXX
|
|
|
The time period (in nanoseconds) in which the device had outbound non-posted read requests but stalled due to insufficient header credits per PCIe link. |
Counter |
0x1160000800ZZYYXX
|
|
|
The time period (in nanoseconds) in which the device had outbound non-posted read requests but stalled due to no NIC completion buffers per PCIe link. |
Counter |
0x1160000900ZZYYXX
|
|
|
The time period (in nanoseconds) in which the device had outbound non-posted read requests but stalled due to PCIe ordering semantics per PCIe link and PCIe tclass. |
Counter |
0x1160000aZZZZYYXX
|
|
|
The total latency (in nanoseconds) for all PCIe read from the device per PCIe link.[2] |
Statistic |
0x1160000b00ZZYYXX
|
|
|
The total number of packets used for the |
Statistic |
0x1160000c00ZZYYXX
|
|
|
The maximum latency (in nanoseconds) for a single PCIe read from the device per PCIe link. |
Statistic |
0x1160000d00ZZYYXX
|
|
|
The minimum latency (in nanoseconds) for a single PCIe read from the device per PCIe link. |
Statistic |
0x1160000e00ZZYYXX
|
|
|
The number of PCIe reads with latency in the range of the PCIe Latency Histogram bin per PCIe link. The sampled value will be the same as the MPLH corresponding bin entry. "Bin" is currently 0→9 (10 bins in total). |
|
0x1160000fZZZZYYXX
|
|
|
Number of responder (RX) CQEs. |
Counter |
0x10c0000100000000 |
|
|
Number of RX CQEs per function. |
Counter |
0x10c000020000XXXX
|
|
|
Number of requestor (TX) CQEs. |
Counter |
0x10c0000400000000 |
|
|
Number of TX CQEs per function. |
Counter |
0x10c000050000XXXX
|
|
|
Number of accesses to ICMC. |
Counter |
0x1180000100000000 |
|
|
Number of ICMC hits. |
Counter |
0x1180000200000000 |
|
|
Number of ICMC misses. |
Counter |
0x1180000300000000 |
[1] This counter includes loopback traffic and does not include packets discarded due to FCS, frame size, and similar errors.
[2] Dividing this counter by pcie_link_latency_total_read_packets yields the average PCIe read latency of those reads.
Last updated: