

AI Factory Dashboard
Overview
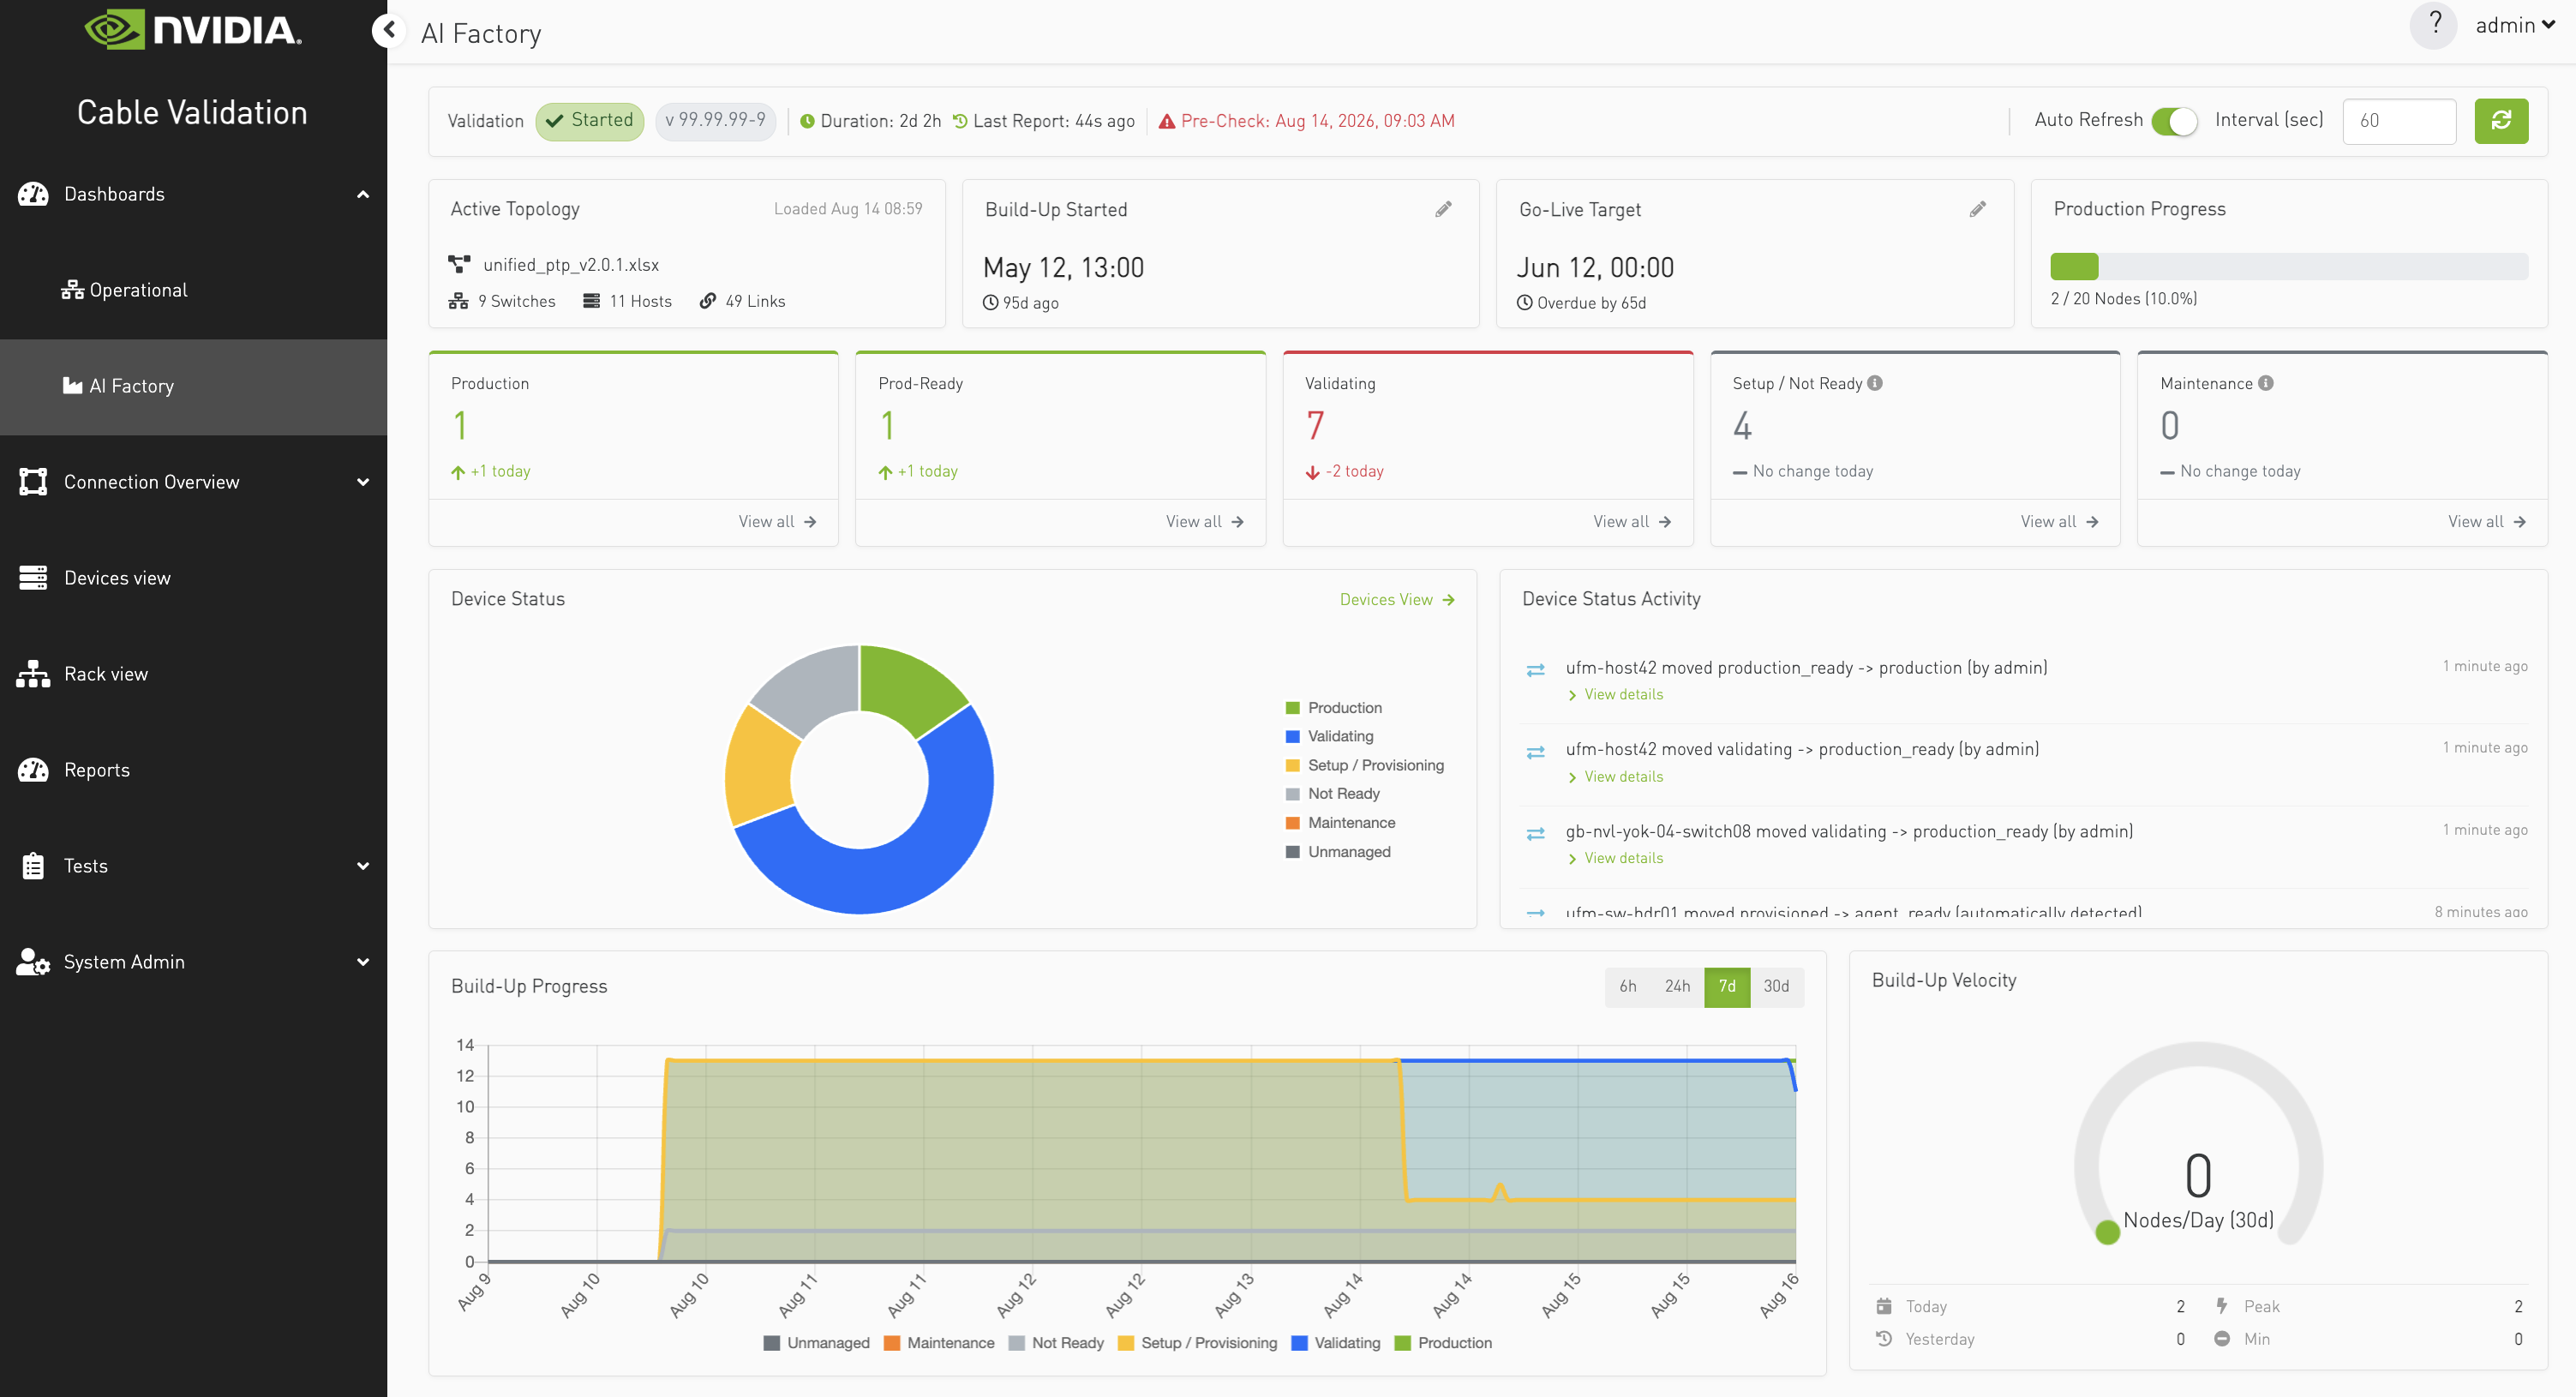
The AI Factory Dashboard helps administrators monitor an AI-fabric build-up from topology load through production readiness. Use it to track the build-up schedule, see how many nodes have reached each lifecycle stage, identify devices that are not progressing, and understand the rate at which the fleet is moving into production.
The AI Factory Dashboard is available to administrators under Dashboards → AI Factory.
Opening the dashboard
-
In the left navigation, expand Dashboards.
-
Select AI Factory.
-
Use the Scope selector in the upper-right corner to choose the workspace, deployment, or view you want to monitor.
The selected scope is applied to summary-based data such as topology context, KPI counts, device status, and device-status activity. Build-up progress and velocity are loaded from the configured build-up dataset.
Recommended workflow
For a quick build-up review, read the dashboard from top to bottom:
-
Confirm the validation state, CVT version, latest report, and Pre-Check freshness.
-
Verify the active topology and selected scope.
-
Check the Build-Up Started and Go-Live Target dates.
-
Review Production Progress and the status KPI cards to see where nodes are in the lifecycle.
-
Use Device Status Activity to identify recent changes or devices moving backward.
-
Review Build-Up Progress to understand the fleet's movement over time.
-
Check Build-Up Velocity to compare today's production rate with recent performance.
-
Select View all, Devices View, or View details when individual nodes require investigation.
Validation toolbar
The toolbar at the top of the dashboard shows the current validation context and controls data refresh.
|
Item |
Description and Usage |
|---|---|
|
Validation |
Shows the current validation state, such as Started, Starting, Stopped, Stopping, or Not Started. |
|
Version |
Shows the installed CVT version. |
|
Duration |
When available, shows how long validation has been running. |
|
Last Report |
When available, shows how much time has passed since the latest agent-reporting cycle completed. Use it to confirm that the displayed status is current. |
|
Pre-Check |
Shows when Pre-Check was last run. Never or a warning icon indicates that results are missing or older than 30 minutes. Run Pre-Check again before relying on readiness information. |
|
Scope |
Selects the workspace, deployment, or view represented by summary-based dashboard sections. |
|
Auto Refresh |
Refreshes the dashboard automatically. Auto refresh starts enabled with a 60-second interval. You can toggle it, change the interval (minimum 10 seconds), or refresh manually. |
Build-up Summary
Active Topology
The Active Topology card identifies the topology represented by the dashboard. It shows:
-
The loaded topology file name and load time
-
The active workspace and deployment when a specific scope is selected
-
The number of switches, hosts, and links when topology statistics are available
Hover over the information icon beside the scope name to see additional scope details, including the workspace, deployment, and device count.
If no topology is loaded, the card displays No topology loaded. Load a topology before using the dashboard to evaluate build-up progress.
Build-Up Started
The Build-Up Started card records when the build-up campaign began. The card displays the start date and time together with the elapsed time. If no start time is set, it displays a dash and Not started.
CVT normally records the build-up start when the first topology is loaded. To correct or override it:
-
Select the pencil icon.
-
Choose the required local date and time.
-
Select the check icon to save, or the X icon to cancel.
The start time cannot be more than one year in the past.
Go-Live Target
The Go-Live Target card shows the planned date and time for reaching production. It also displays:
-
The remaining time when the target is in the future
-
Overdue by and the elapsed duration when the target has passed
-
Not set when no target exists
To change the target, select the pencil icon, choose a date and time, and save. The target cannot be earlier than the build-up start and cannot be more than one year after it.
Production Progress
The Production Progress card shows the number and percentage of nodes that are either Production or Prod-Ready.
The calculation is:
-
Production progress = Production nodes + Prod-Ready nodes
-
Total nodes = Switches + Hosts in the active topology
For example, 89 / 148 Nodes (60.1%) means that 89 of the 148 topology nodes have reached the production group.

Status KPI cards
The KPI row shows the current device count in five build-up categories.
|
KPI |
What it means |
|---|---|
|
Production |
Nodes currently in the Production state. |
|
Prod-Ready |
Nodes that have completed validation and are ready to enter production. |
|
Validating |
Nodes currently undergoing validation. |
|
Setup / Not Ready |
All nodes not currently counted as Production, Prod-Ready, Validating, or Maintenance. Hover over the information icon to see this definition. |
|
Maintenance |
Nodes in Maintenance or Drain / Troubleshooting. |
Each card includes a View all link to the Devices View.
The arrow and number on a card show how its count changed during the displayed period, normally today:
-
An increase in Production, Prod-Ready, or Validating generally indicates forward progress.
-
A decrease in Setup / Not Ready generally indicates that nodes are moving forward in the lifecycle.
-
An increase in Maintenance indicates that more nodes have moved off the production path and may require attention.
-
No change indicates that the count remained stable during the period.
Use the trend together with the current value. For example, a high Production count with no change may be healthy, while a large Setup / Not Ready count with no change can indicate stalled progress.
Device Status
The Device Status doughnut chart shows how nodes are distributed across six lifecycle groups:
|
Group |
Included states |
|---|---|
|
Production |
Production and production-ready nodes |
|
Validating |
Nodes currently validating |
|
Setup / Provisioning |
Not provisioned, provisioned, agent-ready, and validation-ready nodes |
|
Not Ready |
Not installed, installed without power, unsupported, undefined, and validation-only nodes |
|
Maintenance |
Maintenance and drain/troubleshooting nodes |
|
Unmanaged |
Nodes outside the managed lifecycle |
Use the chart to locate the largest non-production group. Select Devices View to inspect individual nodes. If no device data is available, the card displays No Devices and prompts you to load a topology.
Recent transitions are shown in the adjacent Device Status Activity card rather than inside this chart.
Device Status Activity
The Device Status Activity card shows up to 30 recent device-transition events for the selected scope. Use it to identify nodes that moved between lifecycle states, including transitions into Production, Maintenance, or a not-ready state.
Each event includes a message and relative time. Select View details when available to expand information about affected nodes or the status change. If there are no recent transitions, the feed displays No recent activity.
Build-Up Progress
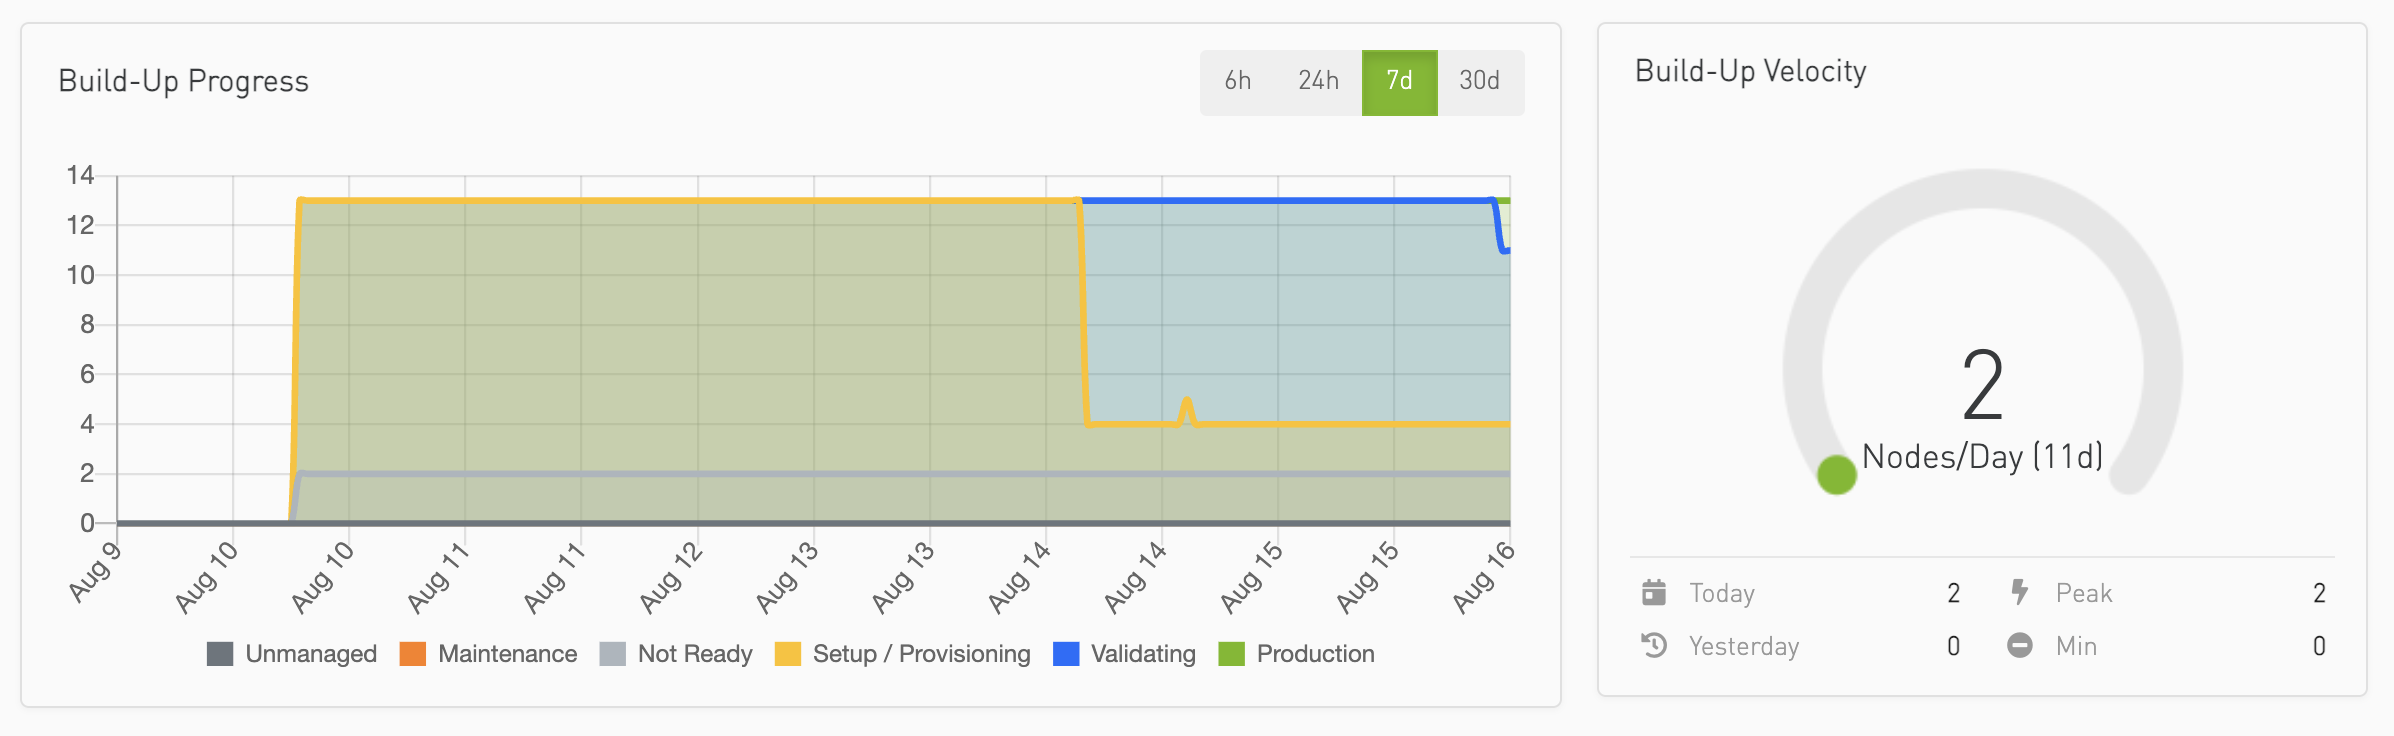
The Build-Up Progress chart shows how device counts changed over time across these stacked series:
-
Unmanaged
-
Maintenance
-
Not Ready
-
Setup / Provisioning
-
Validating
-
Production
The default history range is 7d. Select 6h, 24h, 7d, or 30d to change the displayed period. Hover over the chart to see the count for every lifecycle group at a specific time.
Use this chart to answer questions such as:
-
Is the Production area growing consistently?
-
Are nodes moving from Setup / Provisioning into Validating?
-
Is the Not Ready or Maintenance population increasing?
-
Did progress stop during a particular period?
If no historical samples are available for the selected period, the chart displays No build-up data available.
Build-Up Velocity
The Build-Up Velocity gauge shows the average rate at which nodes reach the Production group, measured in nodes per day. When available, the gauge label also shows the number of days included in the calculation.
The supporting statistics are:
|
Statistic |
Meaning |
|---|---|
|
Today |
Nodes that reached the Production group today |
|
Yesterday |
Nodes that reached the Production group yesterday |
|
Peak |
Highest daily production increase during the measured window |
|
Min |
Lowest daily production increase during the measured window |
The gauge color provides a quick comparison:
-
Green — today's rate is positive and at least as high as yesterday's
-
Amber — today's rate is positive but below yesterday's
-
Red — no nodes have reached Production today
Use the color as a current-rate indicator, not as a complete health assessment. Consider the build-up start time, remaining non-production nodes, and the progress chart before deciding whether the campaign is on track.
Understanding Common Dashboard States
|
State |
What you will see |
Recommended action |
|---|---|---|
|
No topology loaded |
No topology or device data; Production Progress shows no nodes. |
Load the intended topology before evaluating build-up progress. |
|
Build-up not started |
Build-Up Started shows a dash and Not started. |
Verify the topology, then set or correct the start time if needed. |
|
Go-live target not set |
Go-Live Target shows a dash and Not set. |
Set a target so remaining or overdue time can be monitored. |
|
Go-live target overdue |
The card displays Overdue by with a duration. |
Review stalled nodes, recent transitions, progress history, and velocity. |
|
Large Setup / Not Ready count |
Many nodes have not reached Validating, Prod-Ready, or Production. |
Open Devices View and investigate node readiness and provisioning. |
|
Maintenance count increasing |
The Maintenance KPI shows an upward, unfavorable trend. |
Review Device Status Activity and inspect affected nodes. |
|
No build-up history |
Build-Up Progress displays No build-up data available. |
Confirm that status data has been collected and try another time range. |
|
No recent activity |
Device Status Activity is empty. |
Confirm the selected scope and refresh; there may also have been no recent transitions. |
|
Velocity is red |
Today's production increase is zero. |
Check whether work has paused or whether nodes are stalled in another lifecycle group. |
Related Pages
-
Return to Dashboards to choose another dashboard.
-
See the Operational Dashboard for cable-validation health, issue trends, agent reporting, and recent operational activity.
Last updated: