

Operational Dashboard
Overview
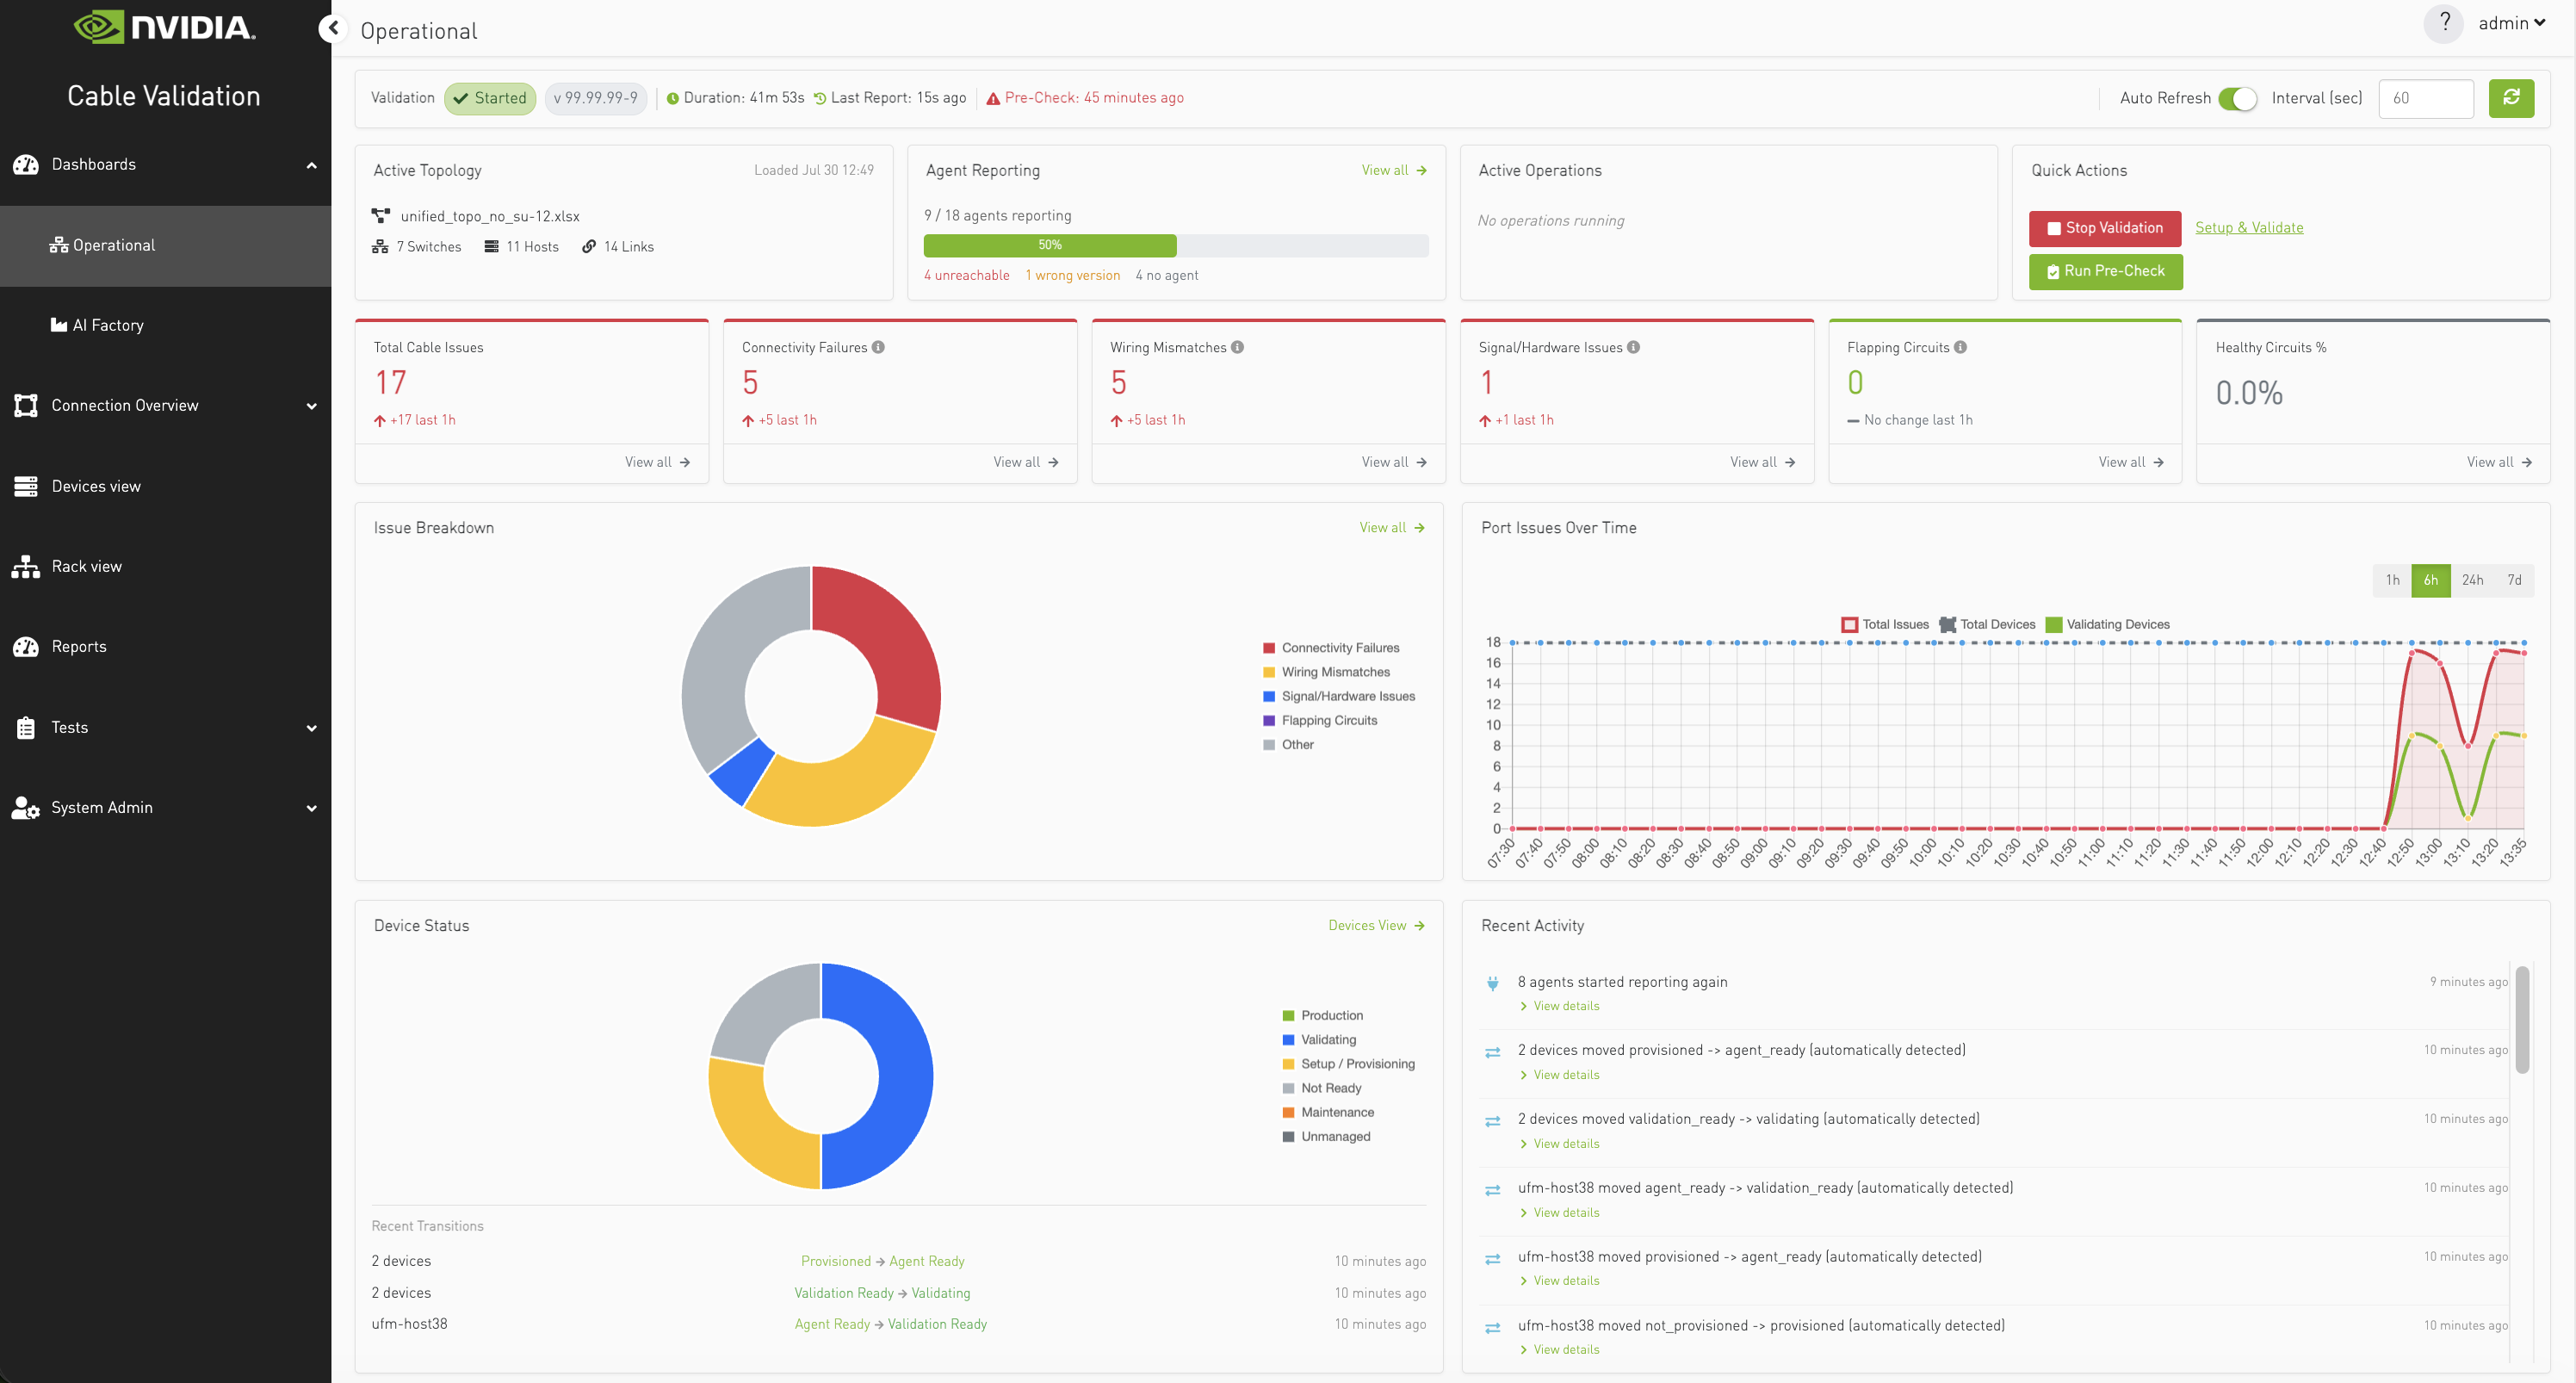
The Operational Dashboard provides a real-time view of cable-validation activity and fabric health. Use it to confirm that the correct topology is selected, check validation and agent-reporting status, identify cable issues, review device states, and open the relevant detailed views when investigation is needed.
The dashboard is available to all users. Some operational controls and details are visible only to administrators.
Opening the dashboard
-
In the left navigation, expand Dashboards.
-
Select Operational.
Recommended workflow
For a quick operational check, read the dashboard from top to bottom:
-
Confirm the validation state, CVT version, report freshness, and pre-check freshness.
-
Verify the active topology.
-
Check Agent Reporting for missing, late, stale, unreachable, or incompatible agents.
-
Review the KPI cards for issue counts and circuit health.
-
Use the charts to understand the issue distribution and whether conditions are changing over time.
-
Review Device Status and Recent Activity for changes that may require attention.
-
Select View all, Devices View, or View details to continue the investigation in a detailed view.
Validation toolbar
The toolbar at the top of the dashboard shows the current system context and controls how data is refreshed.

|
Item |
Description and usage |
|---|---|
|
Validation |
Shows the current validation state, such as Started, Starting, Stopped, Stopping, or Not Started. |
|
Version |
Shows the installed CVT version. |
|
Duration |
When available, shows how long validation has been running. |
|
Last Report |
When available, shows how much time has passed since the latest agent-reporting cycle completed. Use this value to confirm that the dashboard data is current. |
|
Pre-Check |
Shows when Pre-Check was last run. Never or a warning icon indicates that results are missing or older than 30 minutes; consider running Pre-Check again before relying on readiness data. |
|
Auto Refresh |
Refreshes dashboard data automatically. Auto refresh starts enabled with a 60-second interval. You can toggle it, change the interval (minimum 60 seconds), or refresh manually. |
Operational summary

Active Topology
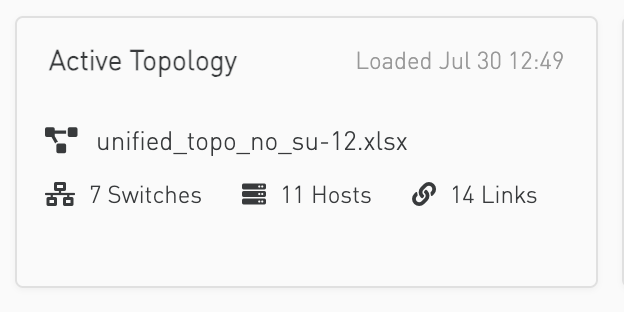
The Active Topology card identifies the topology represented by the dashboard. It shows:
-
The loaded topology file name and load time
-
The number of switches, hosts, and links when topology statistics are available
If no topology is loaded, the card displays No topology loaded. Go to Setup & Validate to load a topology before starting validation.
Agent Reporting
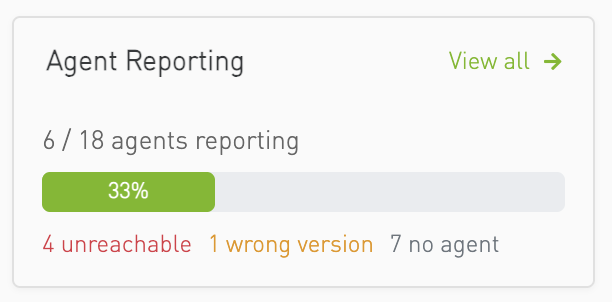
The Agent Reporting card shows how many devices are currently reporting validation data compared with the total number of devices. The progress bar provides a quick indication of reporting coverage.
The card can also identify:
-
Unreachable — agents that cannot be reached
-
Stale — agents whose reports are no longer current
-
Late — agents whose latest report is later than expected but not yet stale
-
Wrong version — agents running an incompatible or unexpected version
-
No agent — devices without a reporting agent
Hover over the unreachable, stale, or no agent counts to see how many circuits are affected.
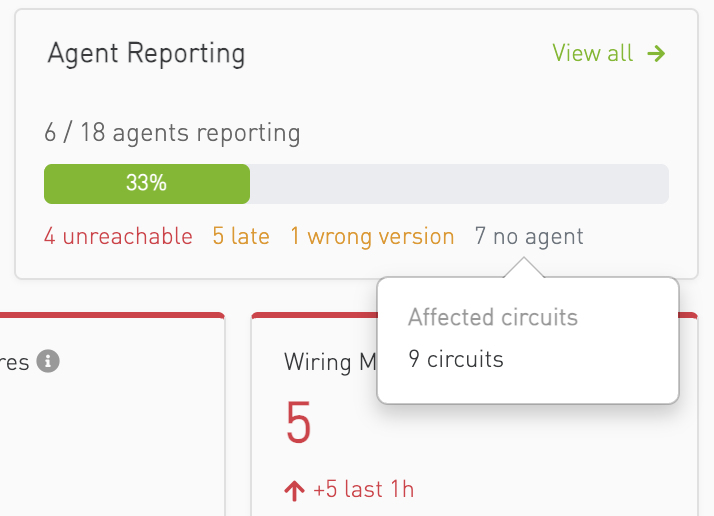
Administrators can select View all to open the detailed agent status reports.
When validation is not running or no agents are reporting, the card displays No reporting agents.
Active Operations
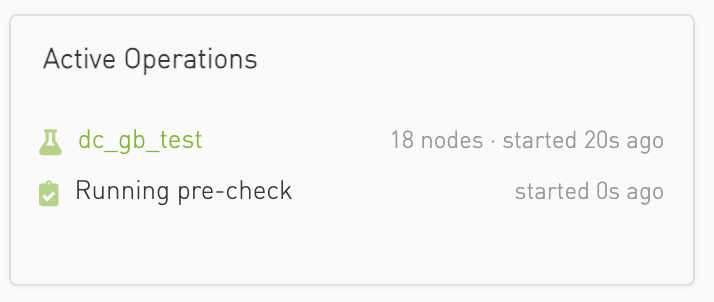
For administrators, Active Operations lists work currently in progress, including validation start or stop operations, topology loading, Pre-Check, agent deployment or removal, and running tests.
The card shows up to two operations directly. If more operations are active, hover over +N more to view the remaining items. A running test name can be selected to open its details.
Quick Actions
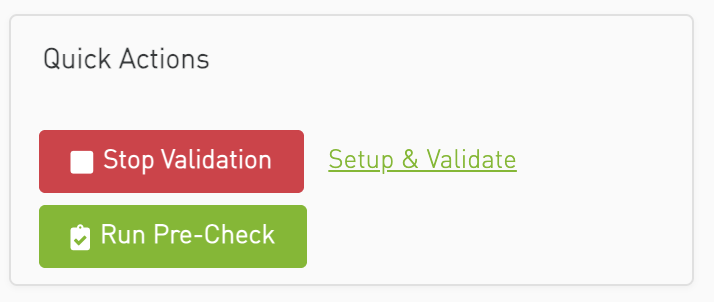
The Quick Actions card is available to administrators:
|
Action |
When to use it |
|---|---|
|
Start Validation |
Starts validation after a topology has been loaded. A progress window shows the operation status. |
|
Stop Validation |
Stops the currently running validation. A progress window shows the operation status. |
|
Run Pre-Check |
Runs readiness checks for the loaded topology. Use it when the toolbar shows that Pre-Check has never run or its results may be stale. |
|
Setup & Validate |
Opens the setup workflow to load or change the topology, manage agents, and prepare validation. |
KPI cards

The KPI row summarizes the most important cable-health measurements.
|
KPI |
What it means |
|---|---|
|
Total Cable Issues |
Total issue count represented by the dashboard issue groups. Extra-cable findings are not included in these KPI totals. |
|
Connectivity Failures |
Links that are down with no signal or have missing/unplugged media. |
|
Wiring Mismatches |
Connections to the wrong neighbor or port, or connections whose neighbor cannot be identified. |
|
Signal/Hardware Issues |
Signal, temperature, optical power, module part-number, negotiation, or receive-disable problems. |
|
Flapping Circuits |
Links that are flapping or error-disabled because of flapping. |
|
Healthy Circuits % |
Percentage of total circuits currently reported as healthy. The target is 100%. |
For the issue-count cards, the arrow and value show how the count changed during the displayed period:
-
An increase is shown as worsening.
-
A decrease is shown as improving.
-
No change indicates a stable count.
Hover over the information icon on a grouped KPI to see the included issue types.
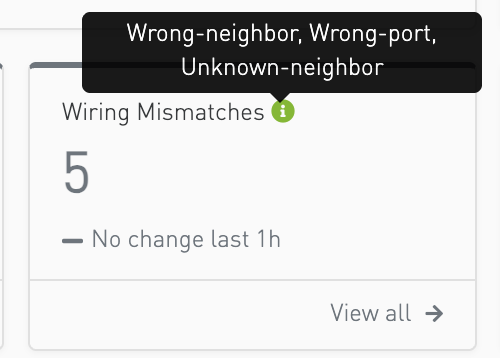
Select View all to open the related Cable Issues, Flapping Circuits, or Circuits view.
A stale badge beside Healthy Circuits % means that one or both endpoints of some circuits have stale data. Hover over the badge to see the affected count. When this warning is present, the percentage may not reflect the current fabric state.
If validation is not running, KPI values are displayed as a dash because current validation results are unavailable.
Issue charts
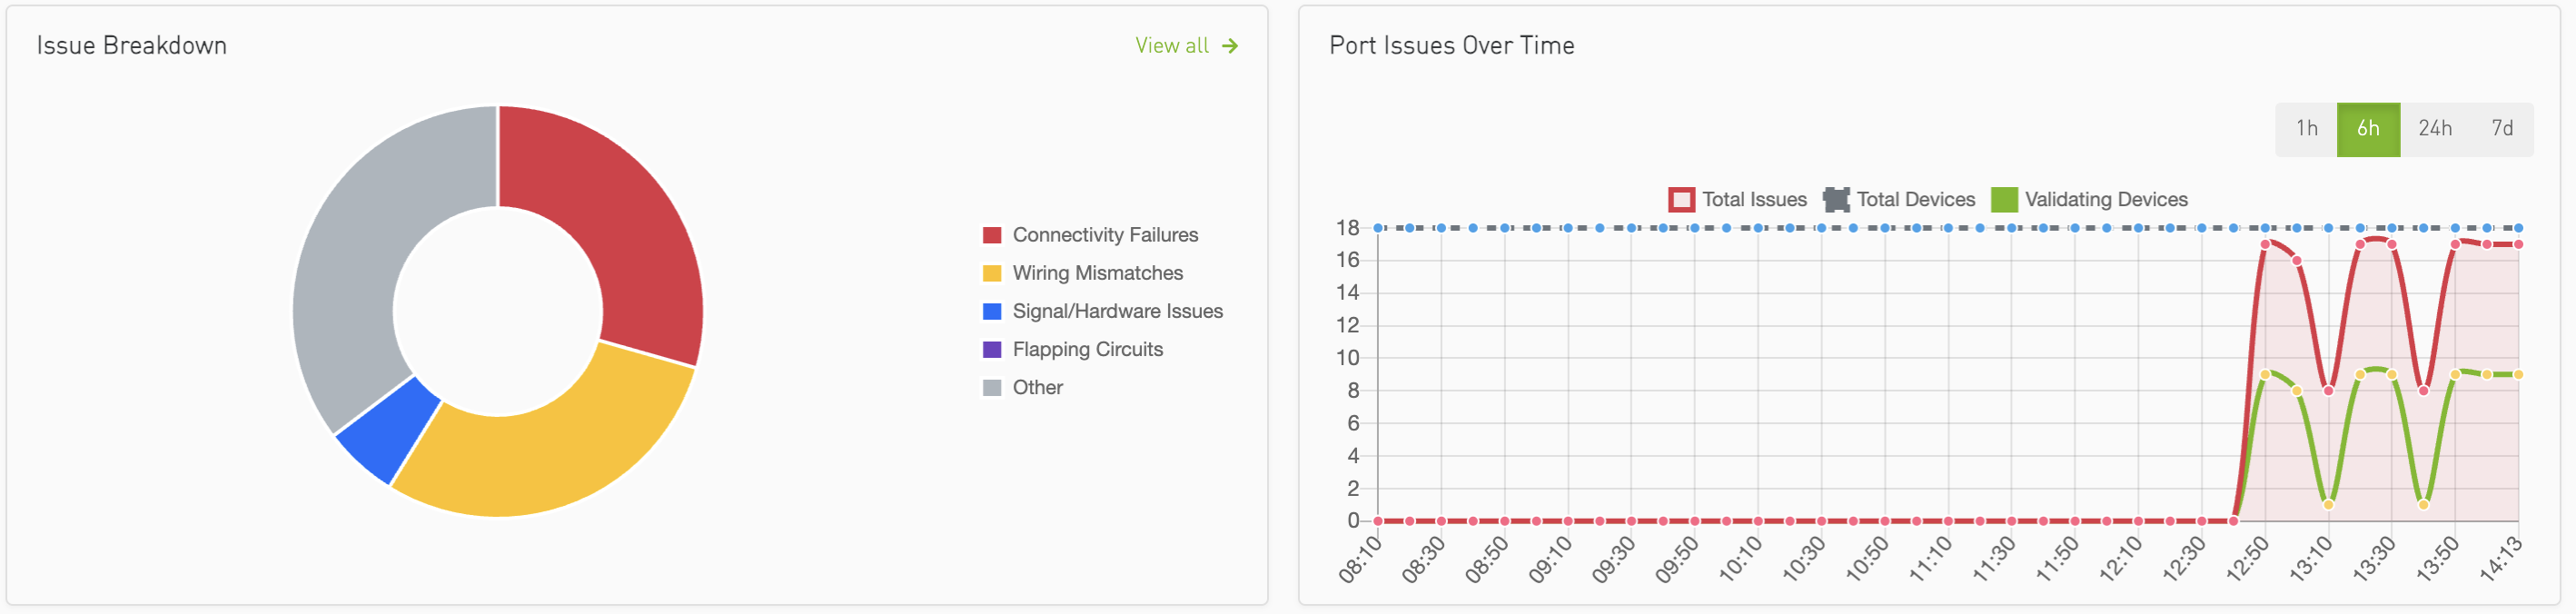
Issue Breakdown
The Issue Breakdown doughnut chart groups current issues into:
-
Connectivity Failures
-
Wiring Mismatches
-
Signal/Hardware Issues
-
Flapping Circuits
-
Other configuration or administrative states
Use this chart to identify which type of issue contributes most to the current problem set. Select View all to open the Cable Issues view. If validation is running and no grouped issues are detected, the card displays No issues detected.
Port Issues Over Time
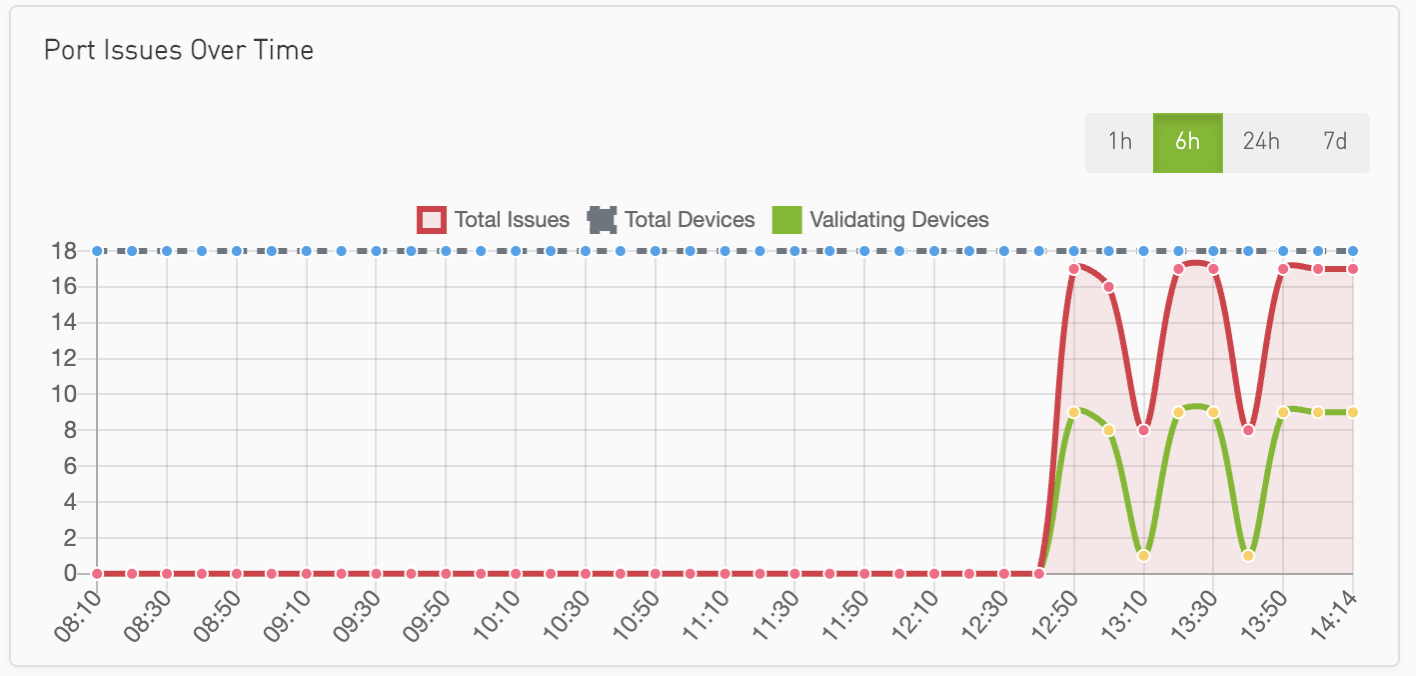
The Port Issues Over Time chart helps determine whether conditions are improving or worsening. It contains three series:
-
Total Issues
-
Total Devices
-
Validating Devices
The default history range is 6h. Select 1h, 6h, 24h, or 7d above the chart to change the displayed period. Hover over a data point to see its exact values.
If validation is not running, the chart displays Validation is not running. If no samples are available for the selected period, it displays No history data available.
Device Status
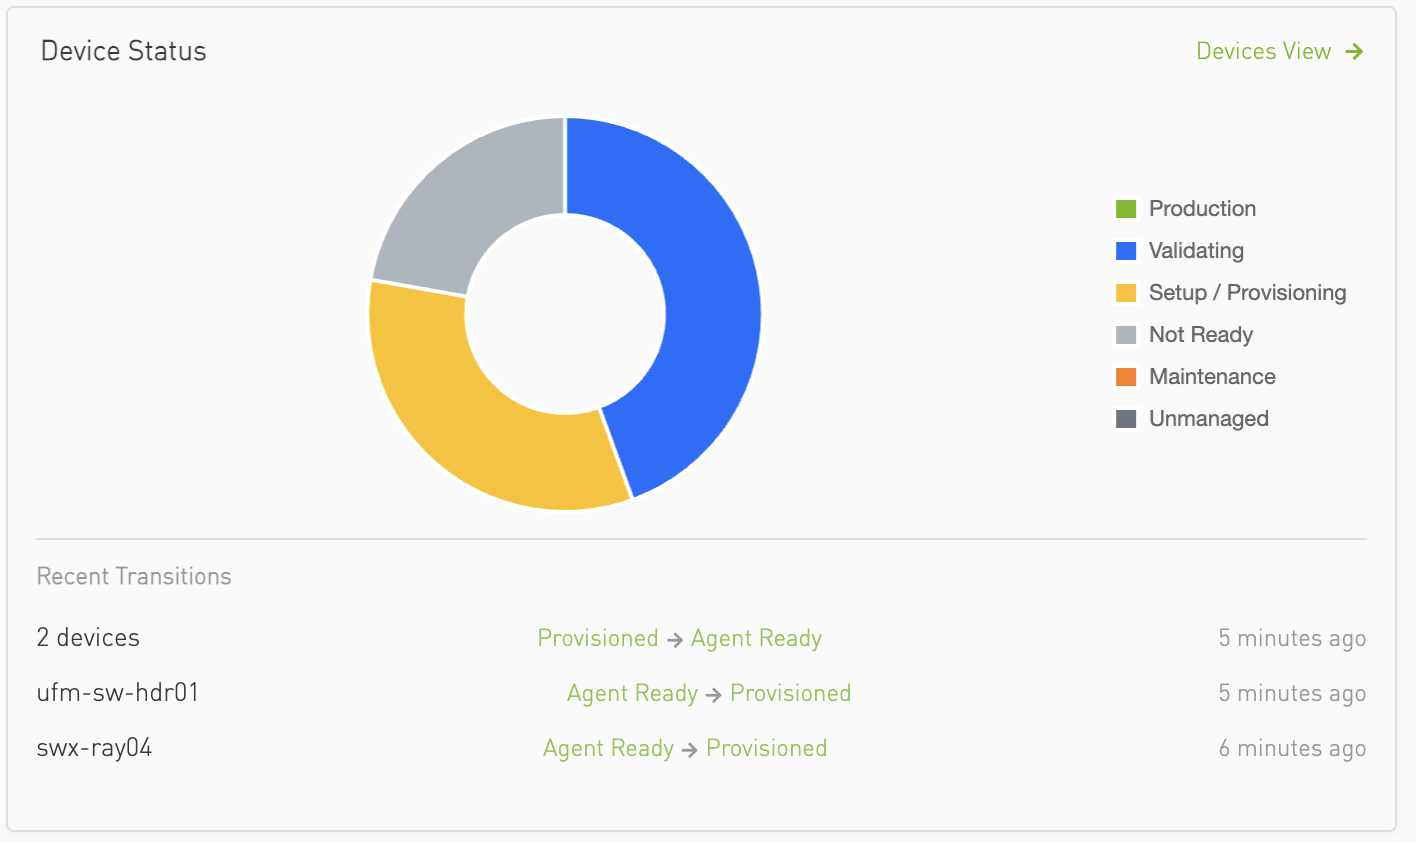
The Device Status card shows how devices are distributed across operational lifecycle groups:
|
Group |
Included states |
|---|---|
|
Production |
Production and production-ready devices |
|
Validating |
Devices currently validating |
|
Setup / Provisioning |
Not provisioned, provisioned, agent-ready, and validation-ready devices |
|
Not Ready |
Not installed, installed without power, unsupported, undefined, and validation-only devices |
|
Maintenance |
Maintenance and drain/troubleshooting devices |
|
Unmanaged |
Devices outside the managed lifecycle |
When recent device-state changes exist, the card shows up to three Recent Transitions, including the device name, previous state, new state, and time of the change.
Select Devices View to inspect individual devices. If no device data is available, the card displays No Devices and prompts you to load a topology.
Recent Activity
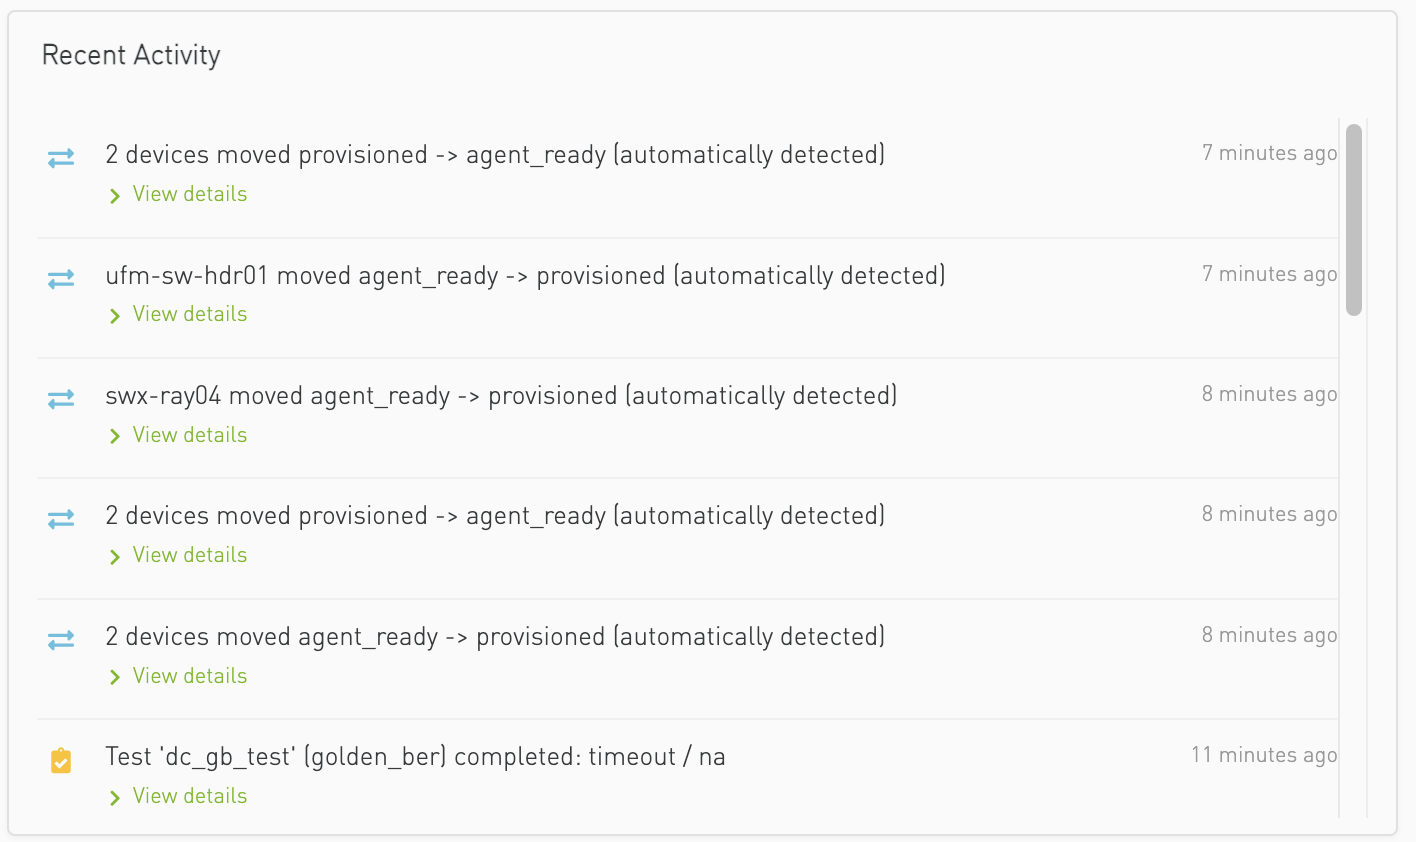
The Recent Activity card shows the latest events, such as:
-
Issues detected or resolved
-
Device-state transitions
-
Agents going online or offline
-
Validation starting or stopping
-
Topology loads
-
Tests starting or completing
-
Agent deployments or removals
-
Pre-Check starting or completing
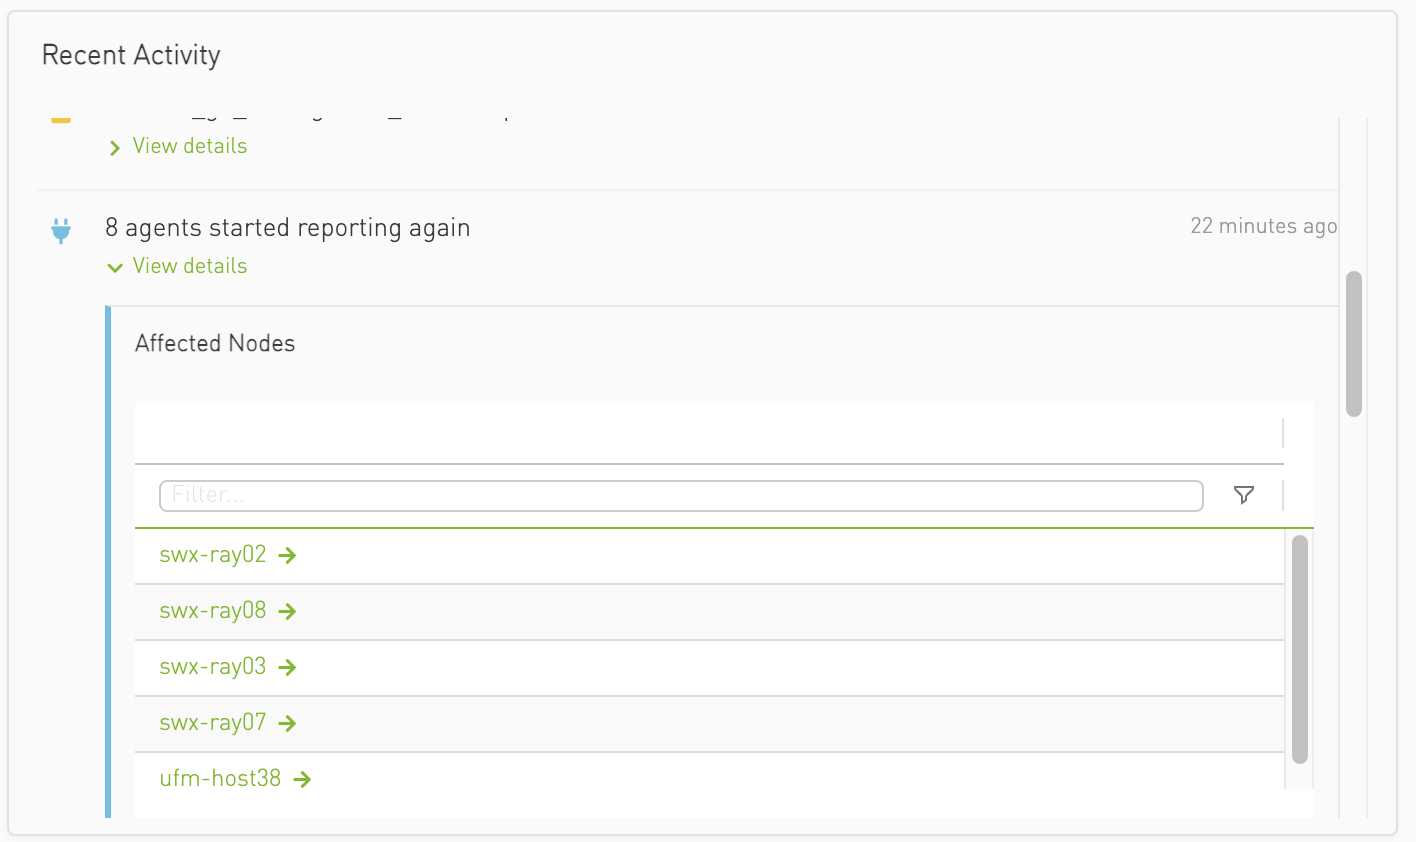
Each event includes a severity indicator, message, and relative time. When View details is available, select it to expand the affected nodes, issues, or other event information. The dashboard displays up to 20 recent events.
Understanding common dashboard states
|
State |
What you will see |
Recommended action |
|---|---|---|
|
No topology loaded |
No topology or device data; validation cannot be started from the dashboard. |
Open Setup & Validate and load a topology. |
|
Validation not running |
KPI values show dashes and issue charts report that validation is not running. |
If appropriate and you are an administrator, select Start Validation. |
|
Pre-Check missing or stale |
Never or a warning icon appears beside Pre-Check. |
Run Pre-Check before relying on readiness information. |
|
Agent reporting problems |
Unreachable, stale, late, wrong-version, or no-agent counts appear. |
Review affected circuits and open the agent status reports if you have administrator access. |
|
Healthy Circuits % has a stale badge |
The health percentage is based partly on stale endpoint data. |
Investigate stale agents before treating the percentage as current. |
|
No recent activity |
The activity feed is empty for the selected scope. |
Confirm the scope and refresh the dashboard; an empty feed can also mean no recent events occurred. |
Related page
Return to Dashboards to choose a different dashboard.
Last updated: