This section describes the DPL Debugger Tools, used to debug pipeline packets that DPL programs are processing in NVIDIA® BlueField®.
The debugger works only with DPL programs that compiled in one of the available debug modes.
Introduction
The DPL Debugger is a GUI application that can run a debug session or open a pre-recorded (through nspect debug) debug session file.
Debug session shows the flow of network packets throughout a DPL program's pipeline and lets the developer trace the details of each packet's course. See the documentation on the extern function nv_send_debug_pkt.
Running debugger with no additional arguments will open the GUI application.
Opening Pre-recorded Debug Session File
The pre-recorded debug session file is a tar.gz archive and is the output of a recorded debug session created with the nspect debug command.
Option 1: Specify the file to open when running the debugger from the command line.
debugger hello_packet.tar.gz
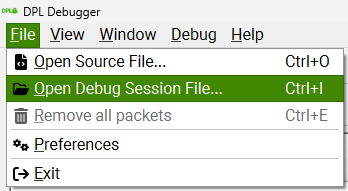
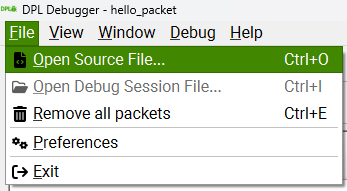
Option 2: Click File → Open Debug Session File and select your file.
Starting Debug Session
Running a debug session from the debugger is possible and has the advantage of processing and inspecting the packets at runtime.
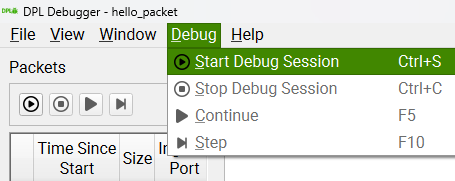
You can click on the Start Debug Session button, click Ctrl+S, or click Debug → Start Debug Session
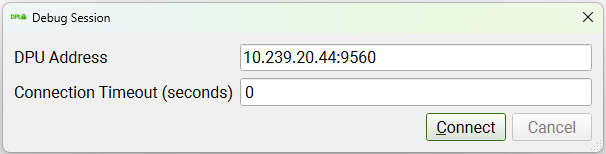
Set the DPU address and port (the default port is 9560), and the connection timeout if required (0 = no timeout), and click Connect.
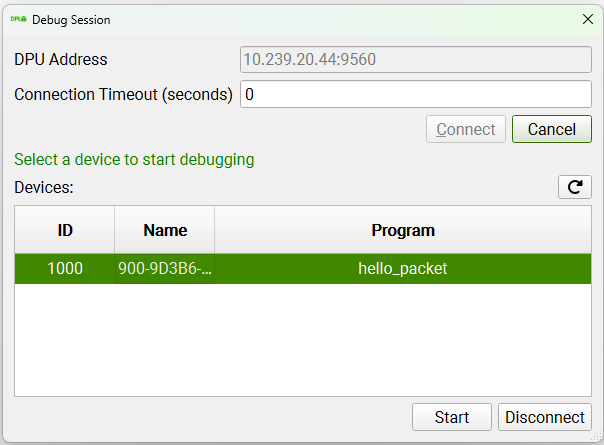
Select the desired device to debug and click Start
Enabling Debug Points
First, remember that to enable debug points, you must compile your program in one of the available debug modes (see more details here). After a debug session is started from the debugger GUI application, all the debug points in the program are DISABLED by default and don't affect the pipeline of the packet. When a packet hits an enabled debug point, it is sent to the debugger, displayed, and can be injected back to the same point in the pipeline on user demand.
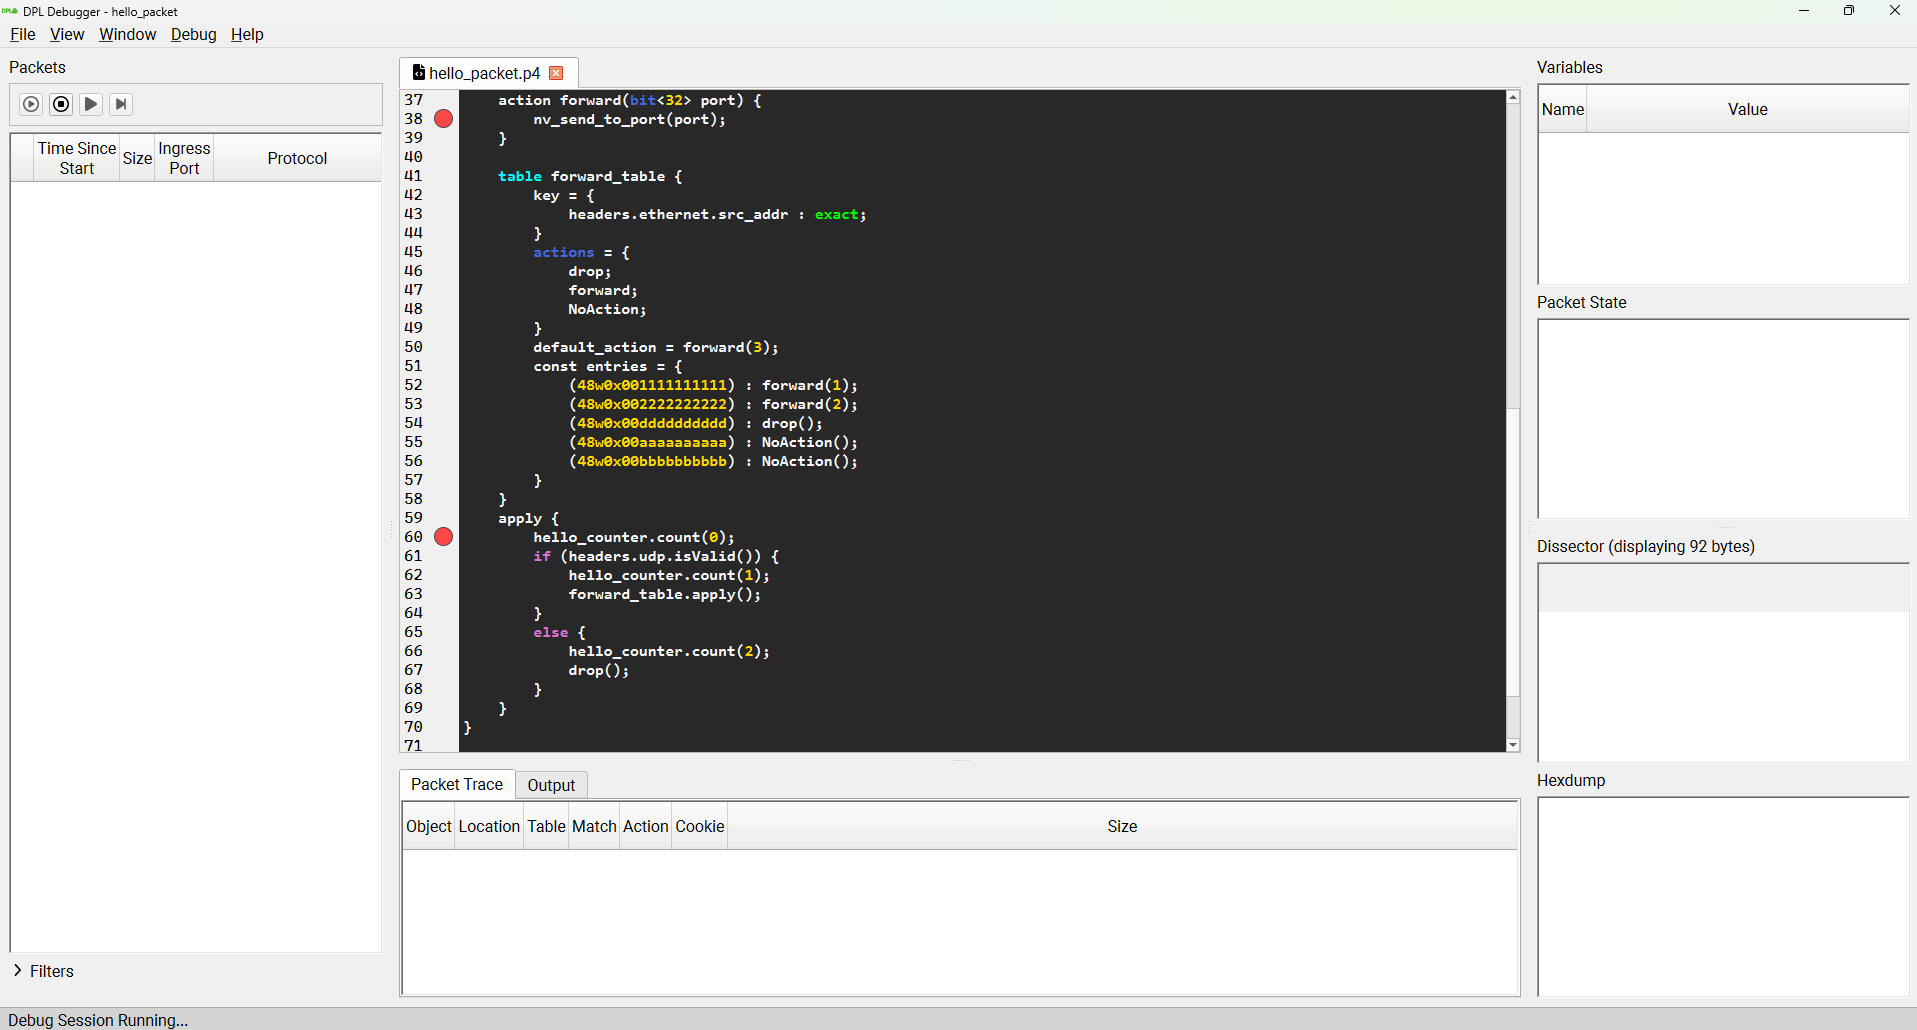
Enabling and disabling debug points is done the same as in traditional debugger GUI applications - open the source file of the program and click on the left margin next to the requested line.
The available debug points to enable depend on which debug mode you compiled the program with.
Similar to traditional debugger GUI applications, if the line doesn't have a debug point associated with it, the next available debug point will be enabled instead.
Debugging the Program Pipeline
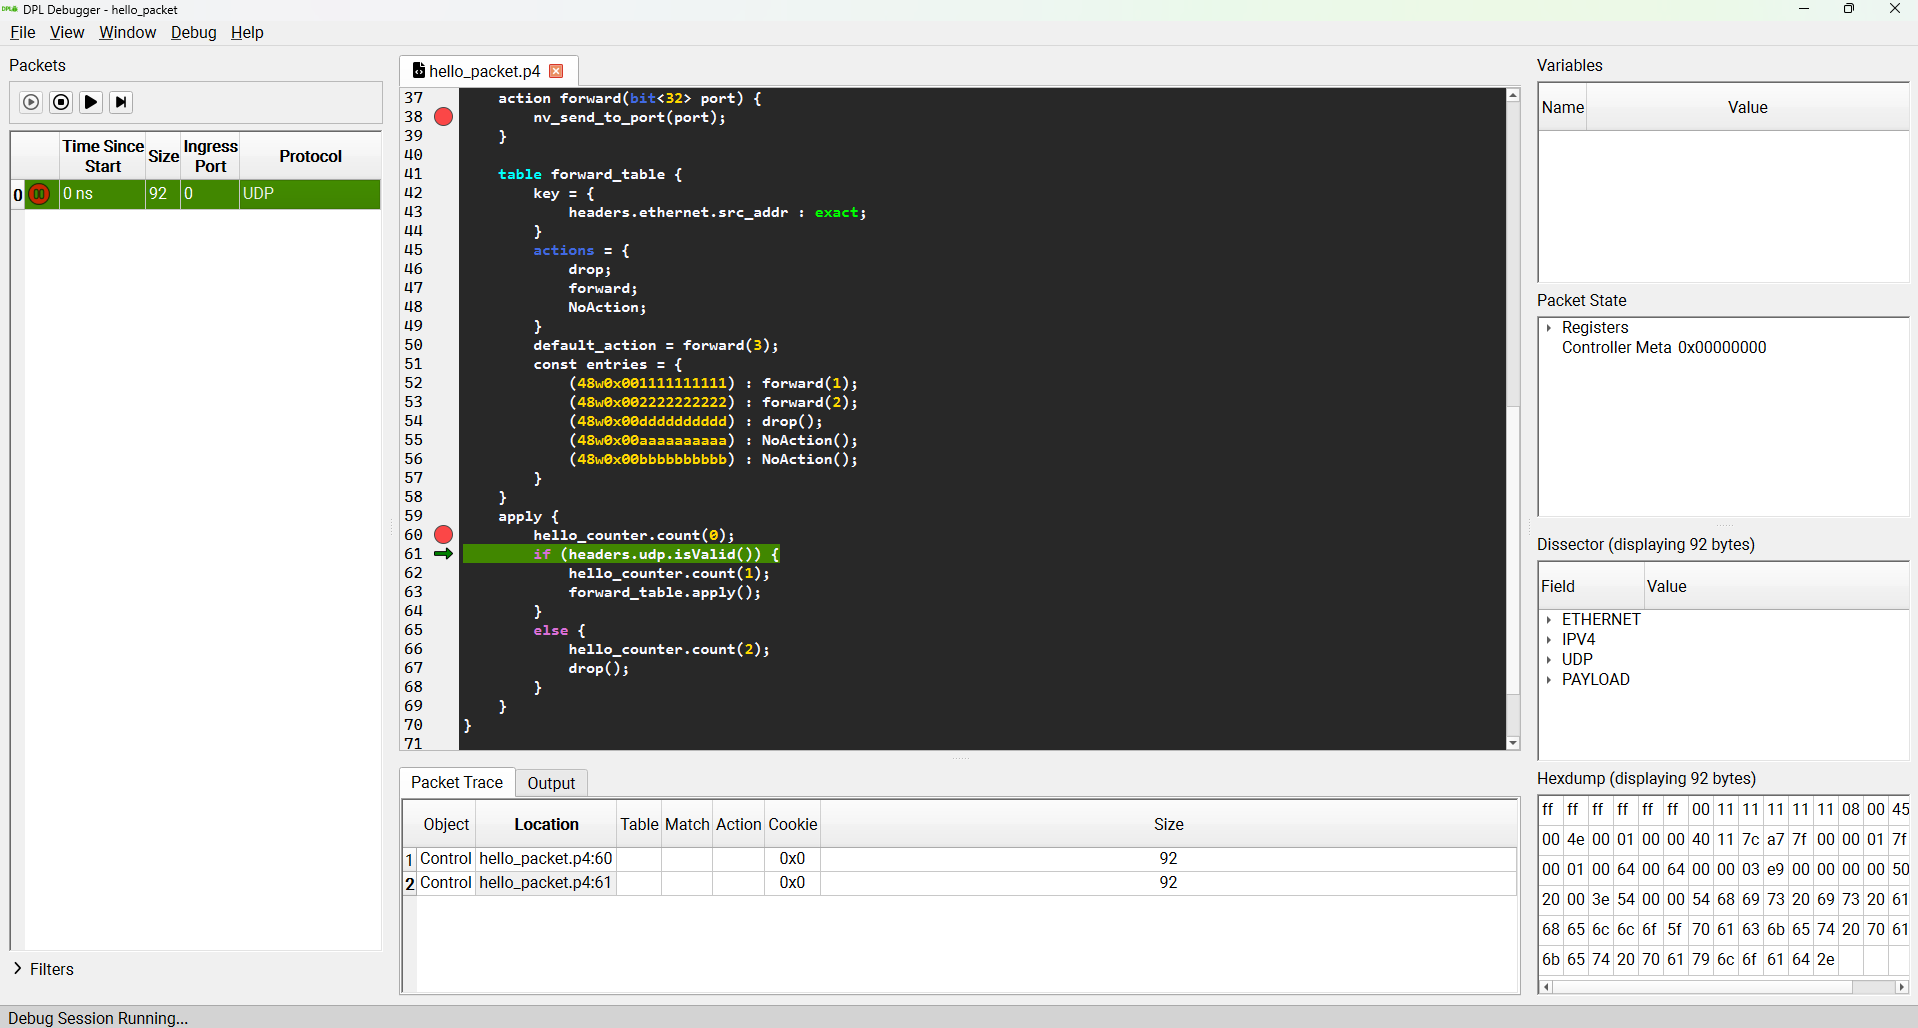
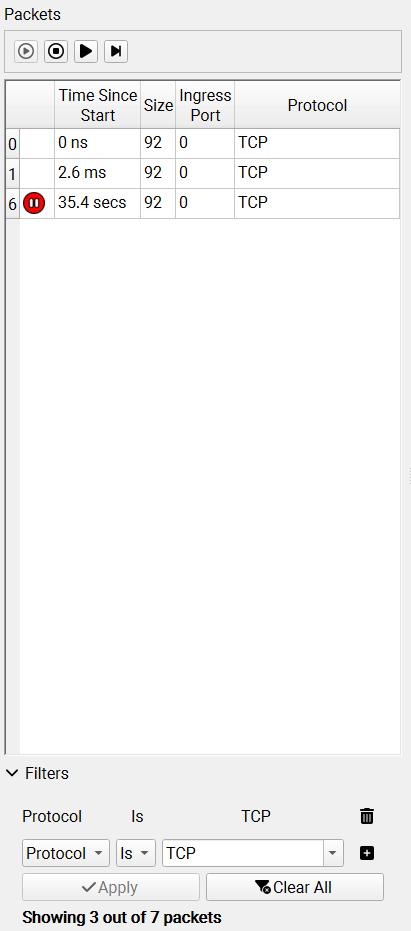
When a packet hits an enabled debug point, it is sent to the debugger and displayed. A red icon is shown to indicate that the packet is paused by the debugger. Clicking the packet reveals the packet data and state. A green arrow is shown to indicate the current debug-point the packet is paused on.
Note: The packet in the Packets list correlates directly to the first row in the Packet Trace list, any change that the packet will undergo (for example its size or protocol) after reinjection will only be reflected in the next row of the Packet Trace list.
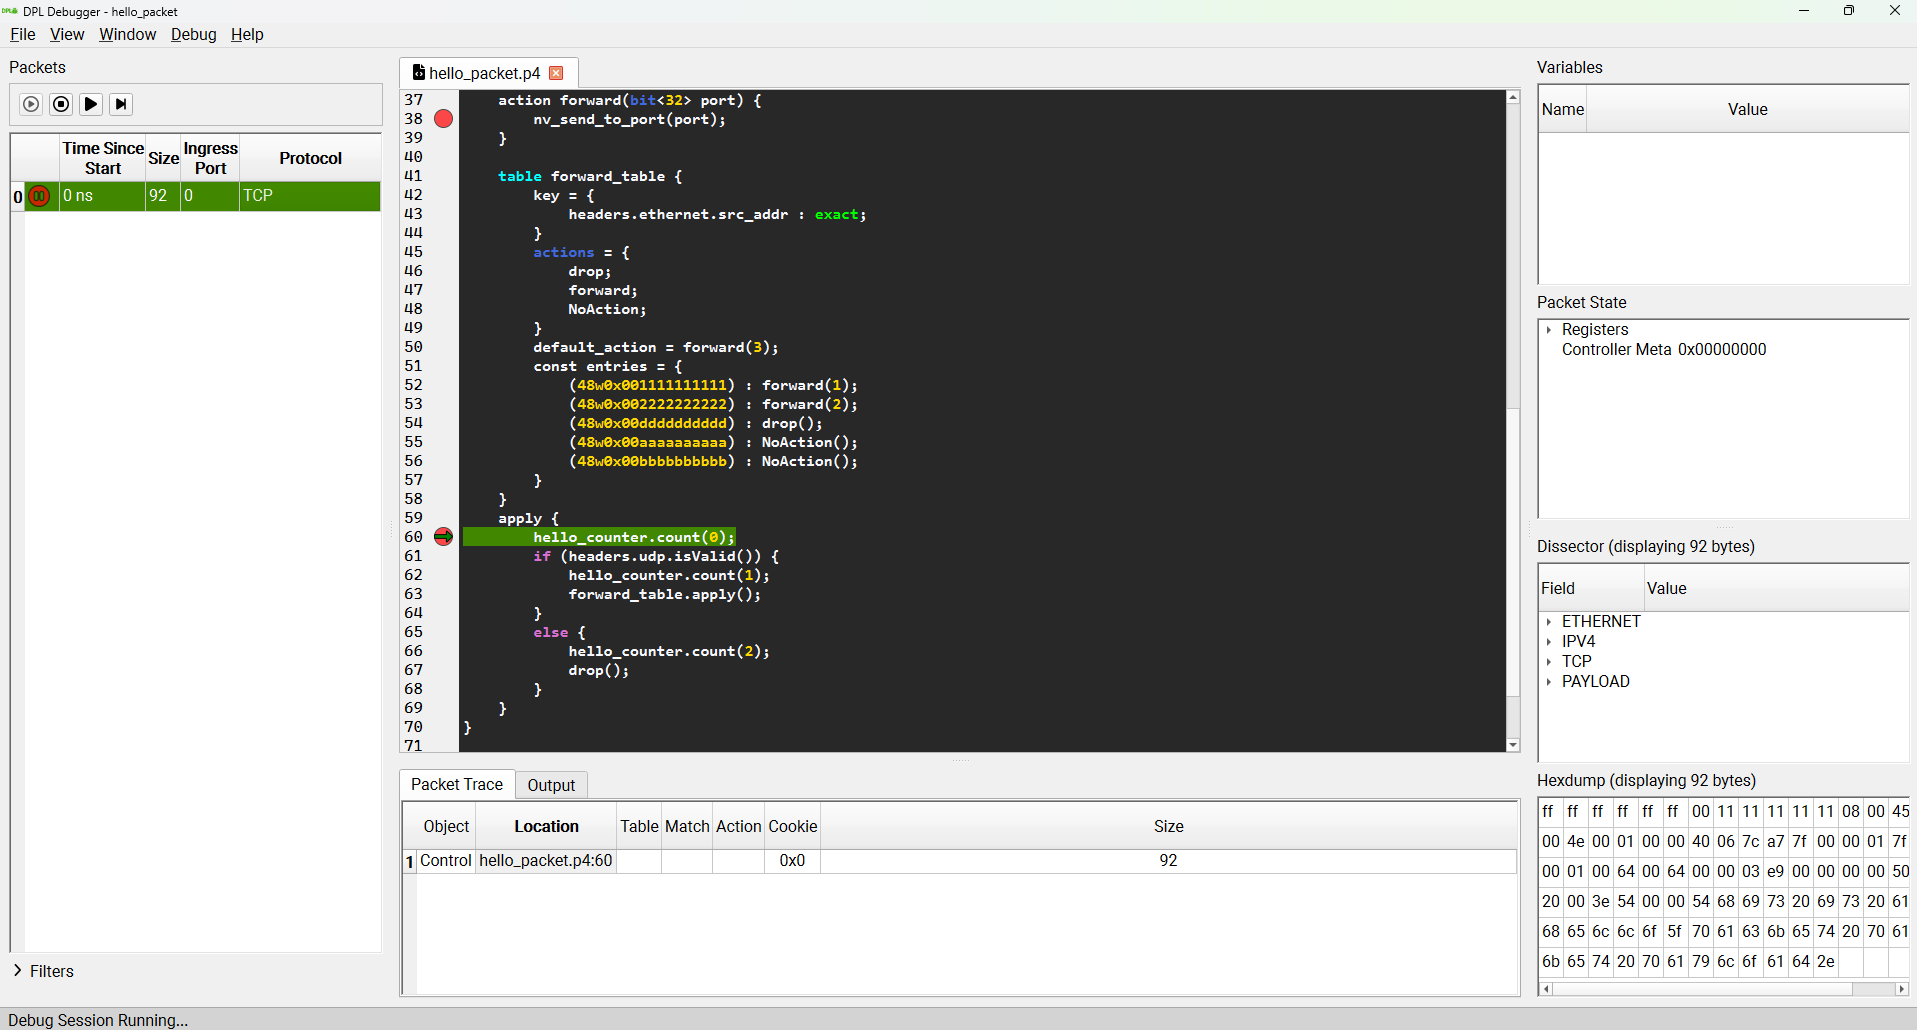
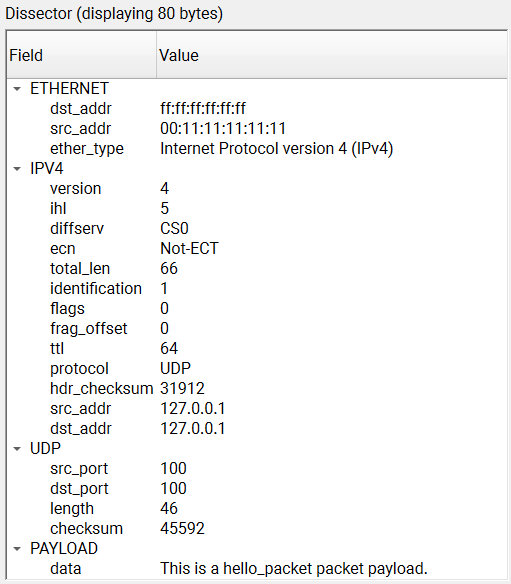
Once the packet is paused, it is possible to edit its content through either the Dissector or the Hexdump.
For example, we can edit the packet's protocol from TCP to UDP using the dissector.
We now inject the packet back to the same point at the pipeline, by clicking either Debug → Continue or Debug → Step.
Both debug operations apply for all currently paused packets.
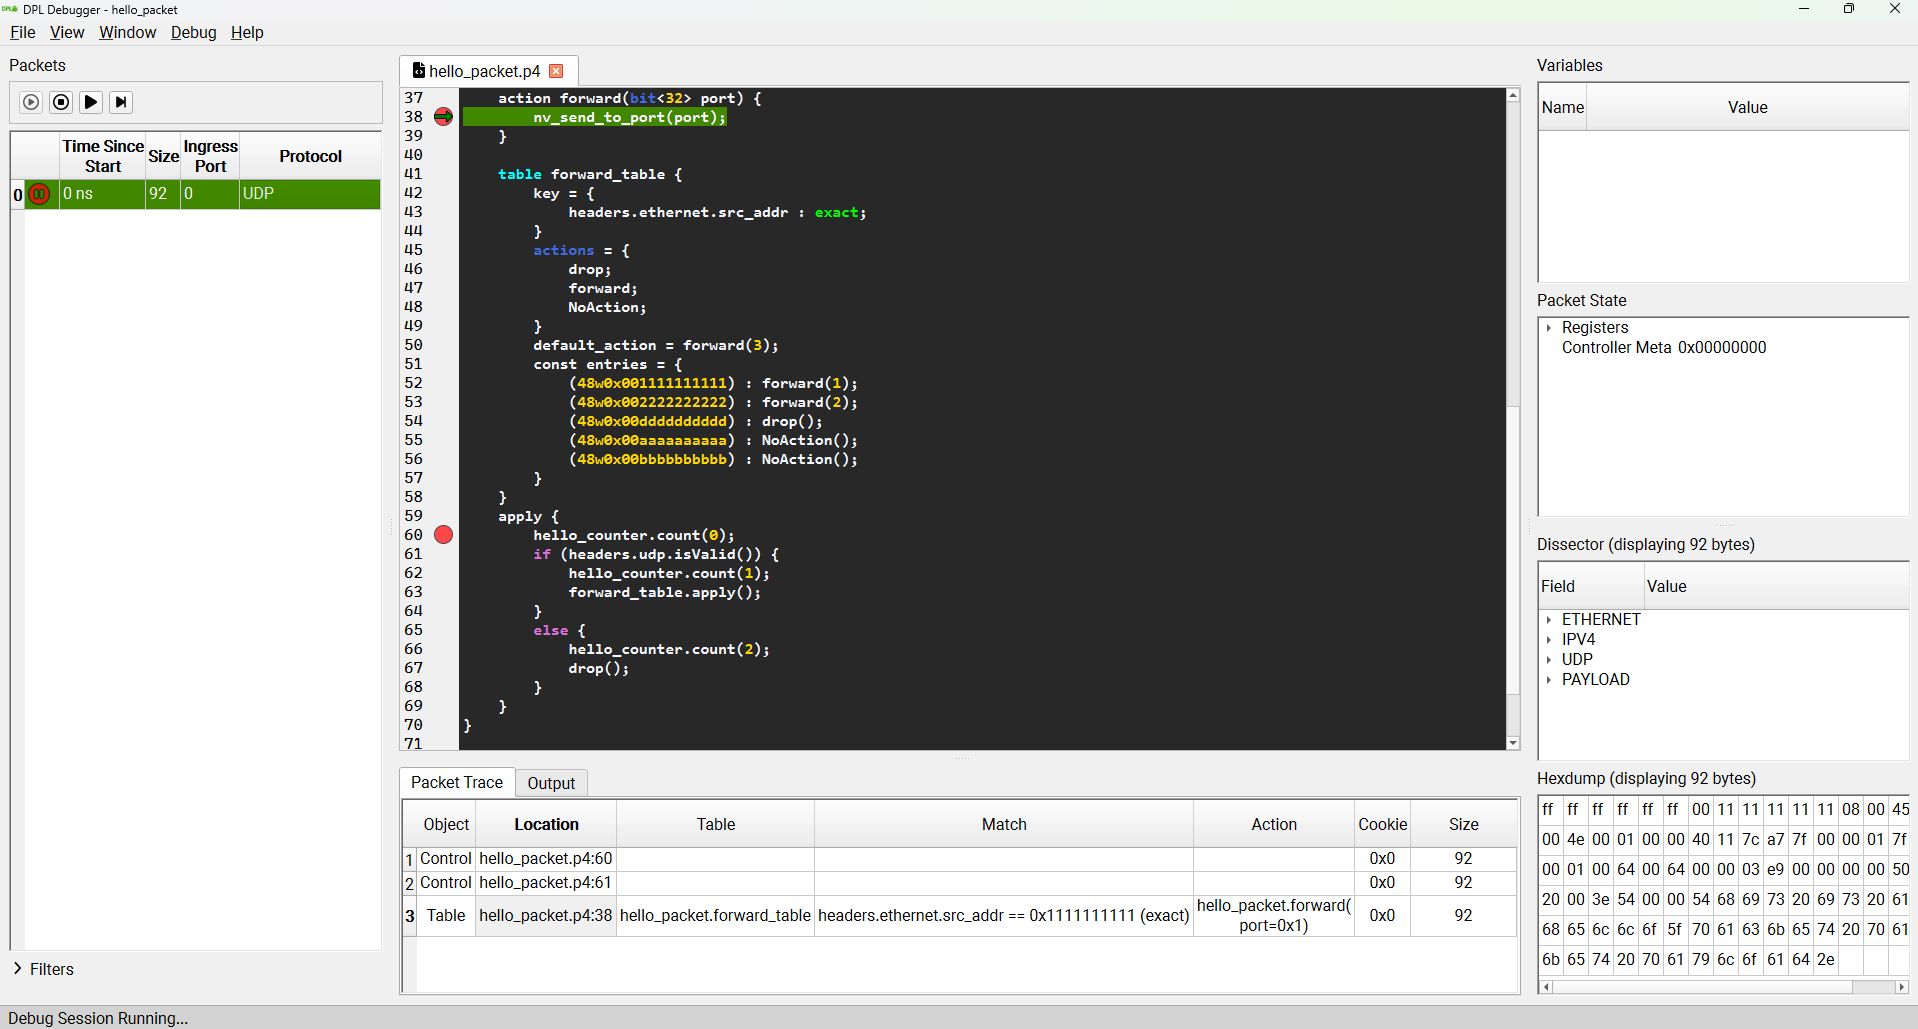
By clicking Step, the packet pauses in the next line, even though there is no breakpoint enabled. In addition, a new row in the "Packet Trace" widget is displayed, which represents a single debug point hit.
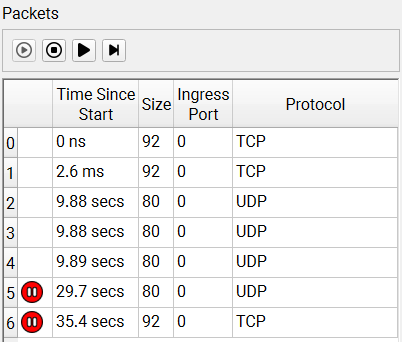
We click Continue, and the packet pauses only at the next enabled breakpoint. Moreover, we observe that the packet's path diverged as a result of our edit - we changed its protocol from TCP to UDP, and therefore the condition of the if statement was satisfied.
Continuing the packet once again causes the "Pause" icon to disappear, as there are no more breakpoints in the rest of the packet's pipeline.
Widgets
Packet List
Displays the packets that were sent to the debugger. Selecting a packet in the list reveals the packet trace of the packet.
The list can be cleared by clicking File → Remove all packets.
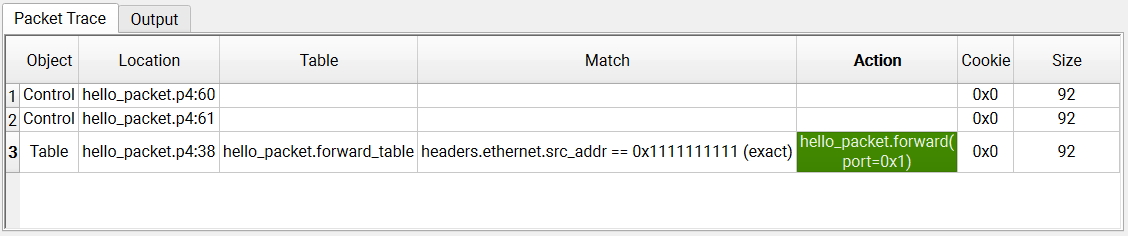
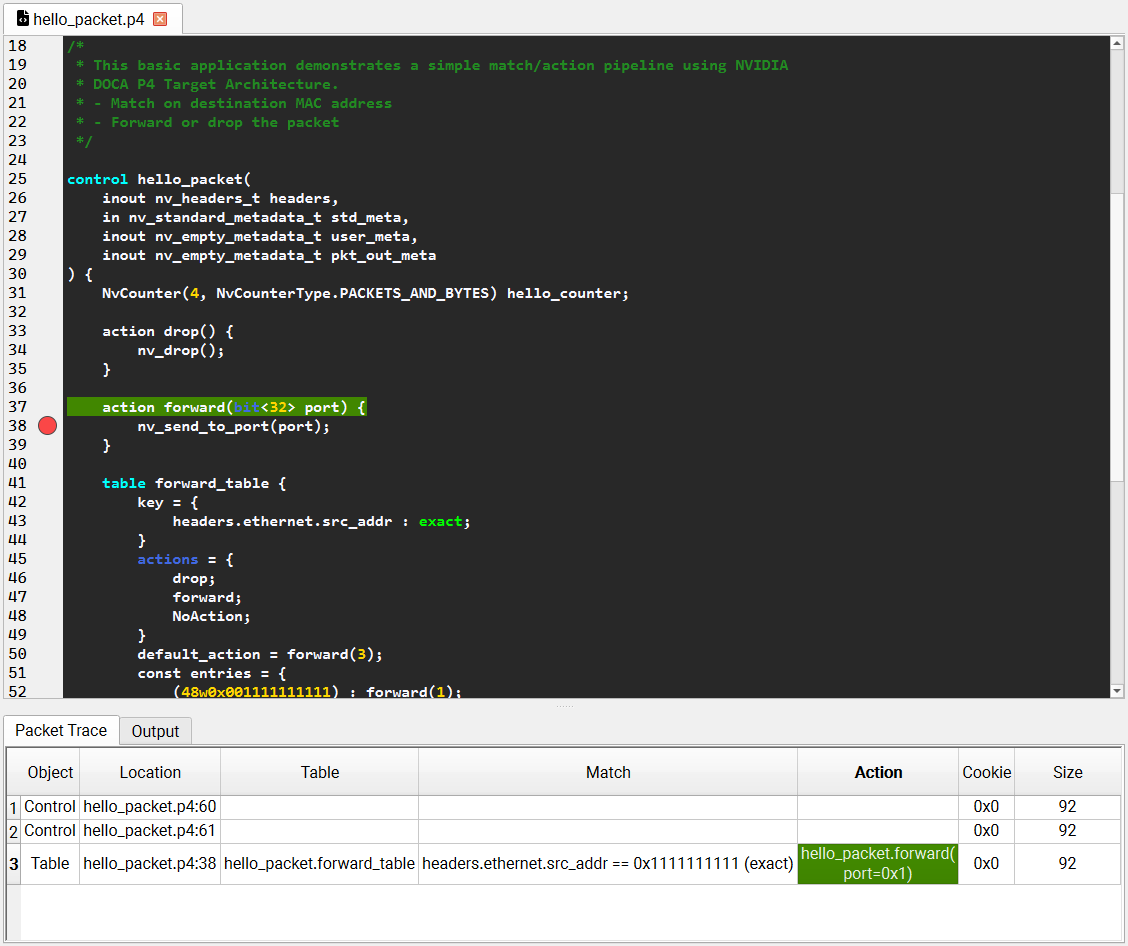
Packet Trace
Each row represents a single debug point hit. Selecting a debug point reveals the packet data, state, and pipeline at the time the packet hit the debug point.
Filter
Packets can be filtered by:
-
Table name
-
Action
-
Match Field
-
Match Type
-
Match Value
-
Ingress port
-
Packet Size
-
Protocol
Toggle the Filters view, click the '+' button to add a filter, and the Apply button to apply the filters.
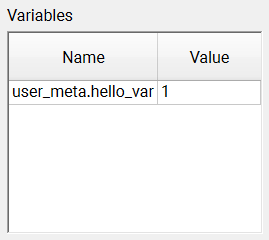
Variables
Shows the variables defined in the program, and their respective values at the time the selected debug-point was hit.
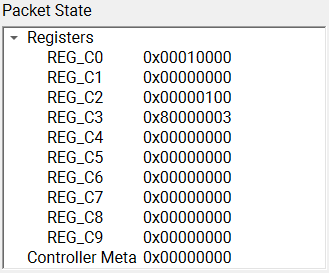
Packet State
Shows low level variables such as registers and controller meta.
Packet Dissector
Shows the parsed packet. Any paused packet can be edited by double-clicking any of the view's values (or using F2). Note that the editable values are always shown in decimal format, and are translated to the expected format upon saving.
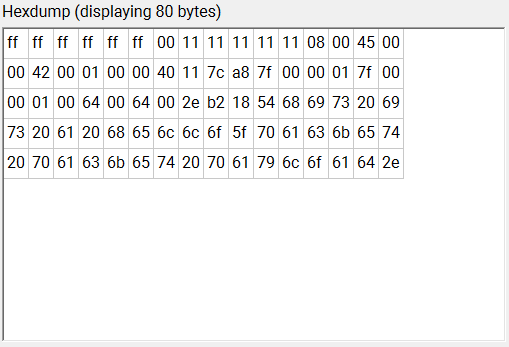
Hex Dump
Shows a raw hex dump of the packet. Any paused packet can be edited by double-clicking the hexdump values (or using F2).
Source Code
Source files can be opened by clicking File → Open Source File. Additionally, sources are displayed when clicking objects that have a correlation to a source location (e.g., debug points, tables, actions, etc...).
The debugger seeks the DPL source file using the search paths defined in the Settings, or by browsing manually for the file.
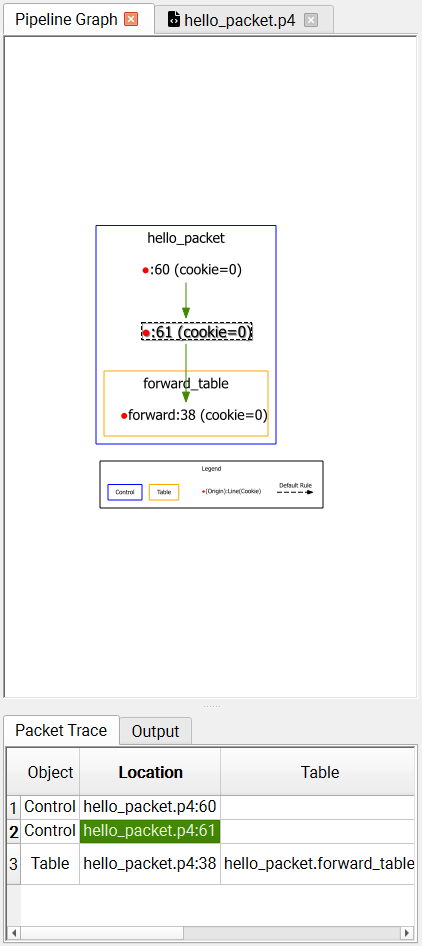
Pipeline
The pipeline graph can be opened by clicking View→ Pipeline Graph. It shows the pipeline of the currently selected packet. Clicking on a row in the packet trace highlights (with a dashed outline) the respective debug point in the pipeline.
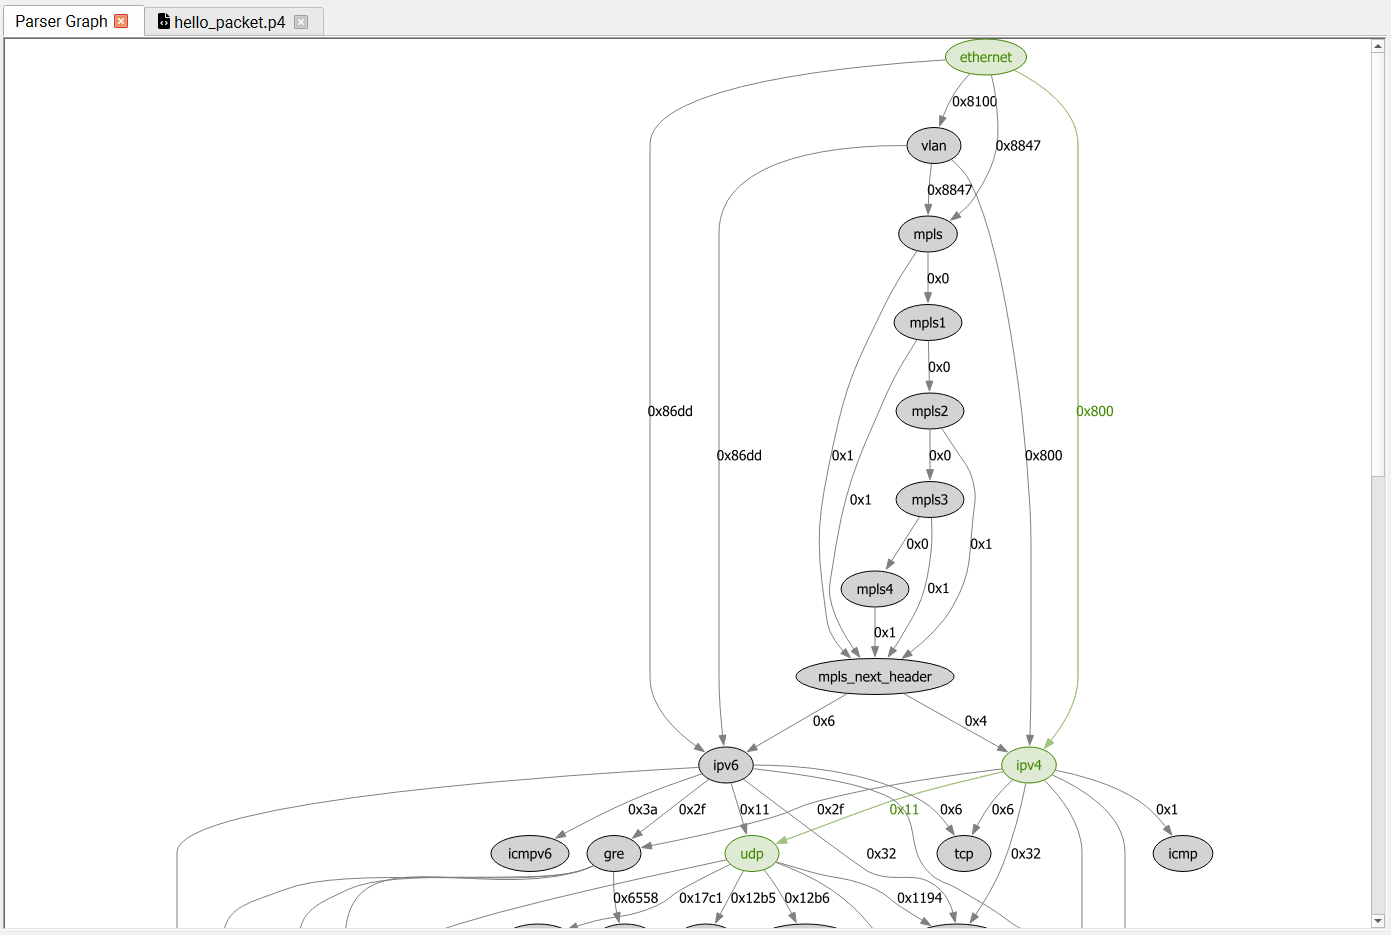
Parser
The parser graph can be opened by clicking View→ Parser Graph. It shows the complete parser graph of the program, and outlines how the currently selected packet is parsed. The graph consists of both flex nodes which the DPL programmer instigated and static (fixed) nodes which are inherent part of the hardware.
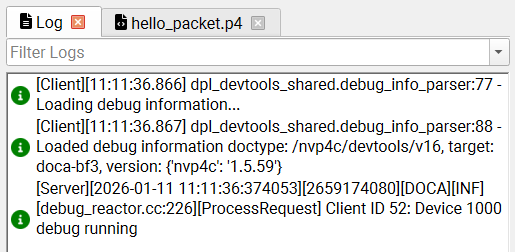
Log
The Log view can be opened by clicking View→ Log. It shows the internal logs of the DPL Runtime daemon. The logs can be filtered by severity levels.
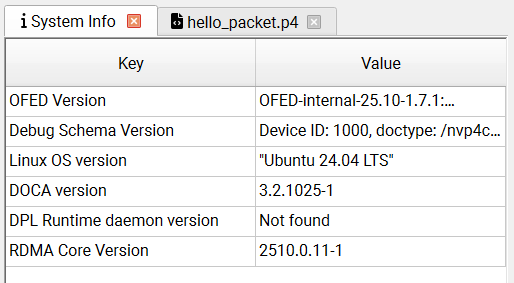
System Info
The System Info view can be opened by clicking View→ System Info.
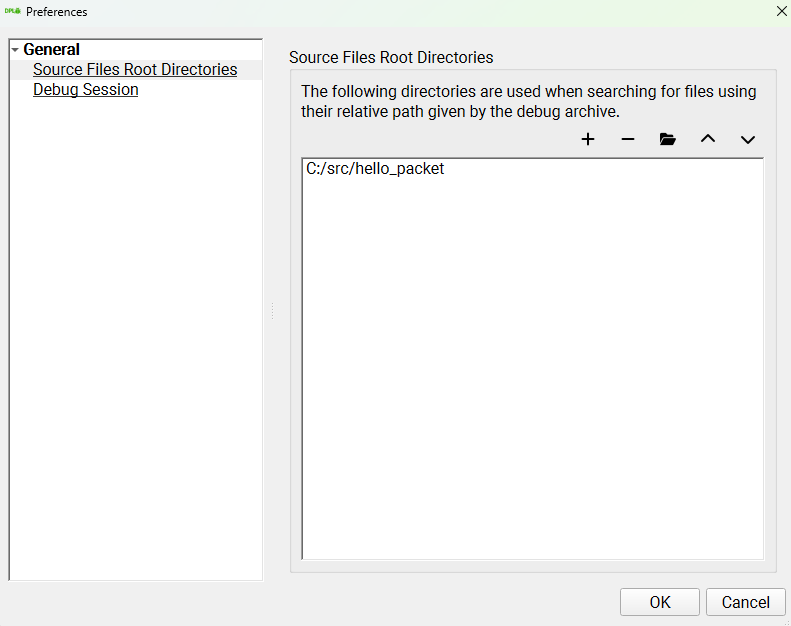
Setting Source Directories
When an object with a correlation to a source location is clicked, the debugger searches in the source directories for the source file and display it.
Click File → Preferences menu and set the location of the DPL program sources.
Last updated: