This page describes the DPL Nspect tool, which is used to inspect DPL programs loaded onto the NVIDIA® BlueField® DPU.
Introduction
The DOCA Dependency Compatibility Policy is designed to provide customers with high velocity and flexibility during updates, enabling them to update specific layers of their system without requiring a full stack overhaul.
The primary objectives of this policy are to support decoupled updates for teams managing separate firmware and software stacks, allow for targeted upgrades on specific devices, minimize maintenance downtime by updating only necessary components, and guarantee investment protection by ensuring application continuity across platform releases.
This policy applies to all NVIDIA network device products and their associated software and firmware stacks.
DPL Nspect Execution
To view basic usage information, run the nspect without arguments. For a detailed usage guide, use the -h or --help flags. You can also view command-specific help by running nspect [command] -h.
Prerequisites and Configuration
-
Server Connection: DPL Nspect requires a connection to a host (local or remote) where the
dpl_nspect serveris running as part of the DPL Runtime Service. -
Address Configuration: The host address and port can be configured in two ways:
-
Directly using the
-a/--addressargument. -
By setting the
DPL_NSPECT_SERVER_ADDRESSenvironment variable (e.g.,DPL_NSPECT_SERVER_ADDRESS=127.0.0.1:9560).Hostnames are resolved at runtime (e.g.,
localhostresolves to127.0.0.1).
-
-
Data Directory: Configuration and logs are stored in the Data directory.
Command Usage
usage: dpl_nspect [-h] [-v] [-ll] [-nh] -a ADDRESS [-t TIMEOUT] [--cacert PATH_TO_CA_CERT] [--cert PATH_TO_CERT] [--private-key PATH_TO_KEY]
                  {system-info,devices,tables,query,graph,config,counters,meters,hw-steering,debug,perf} ...

options:
  -h, --help            show this help message and exit
  -v, --version         show program's version number and exit
  -ll, --low-level      Display low level internal information. (default: False)
  -nh, --no-hints       Disable hints for further information.
                        You may set the DPL_NSPECT_DISABLE_HINTS environment variable instead of using this flag:
                        "export DPL_NSPECT_DISABLE_HINTS=1" (default: False)
  -a ADDRESS, --address ADDRESS
                        The dpl_nspect server socket address of the form IPv4/IPv6* [address][:port]
                        IPv6*: To use with a port the address must be enclosed in literal square brackets.
                        Example: ipv6:[2607:f8b0:400e:c00::ef]:443 or ipv6:[::]:1234
                        The address/port can be assigned to and read from the environment variable: DPL_NSPECT_SERVER_ADDRESS. (default: None)
  -t TIMEOUT, --timeout TIMEOUT
                        [Optional] gRPC channel connectivity timeout. (default: 0)

commands:
  For further info run dpl_nspect <command> -h

  {system-info,devices,tables,query,graph,config,counters,meters,hw-steering,debug,perf}
    system-info         Display system information, e.g. HW Model, OS, OFED.
    devices             List the configured virtual devices.
    tables              List tables of programs loaded on the DPU.
    query               List table entries, keys and actions.
    graph               Display a graph of the Pipeline, using DOT language.
                        This graph can be graphically rendered using DOT renderers, such as online DOT graphics visualizer websites
    config              Get/Set the device configuration.
    counters            Display counters details and values.
    meters              Display meters details and values.
    tcpstates           Display TCP states details and values.
    hw-steering         Display HW Steering rules dump.
    debug               Start a debug recording session.
    perf                Display live performance monitor statistics.

Authentication:
  Mutually inclusive arguments for secure connection using SSL authentication

  --cacert PATH_TO_CA_CERT
                        CA certificate path for secure connections (default: None)
  --cert PATH_TO_CERT   Client certificate path for mutual authentication (default: None)
  --private-key PATH_TO_KEY
                        Client private key path for mutual authentication (default: None)

Data directory: /root/.local/share/dpl_devtools
DPL Nspect Commands and Flags
The following sections describe specific commands and their outputs.
The DPL program hello_packet.p4 (referenced at the end of this section) was used to generate the examples below.
Most commands support the --json argument to output data in JSON format, facilitating integration with automated scripts.
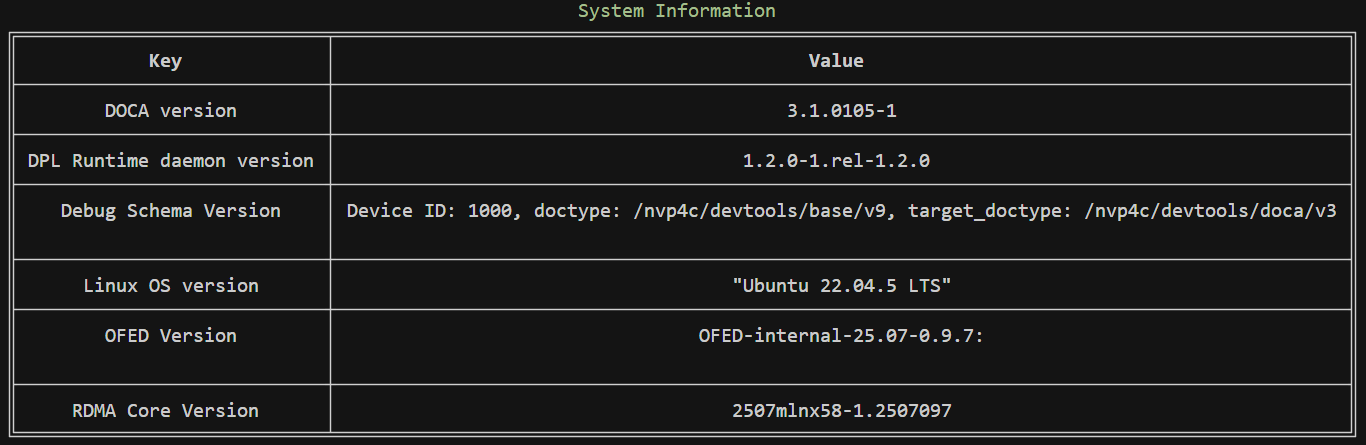
system-info
nspect system-info
Displays system information.
Example output:
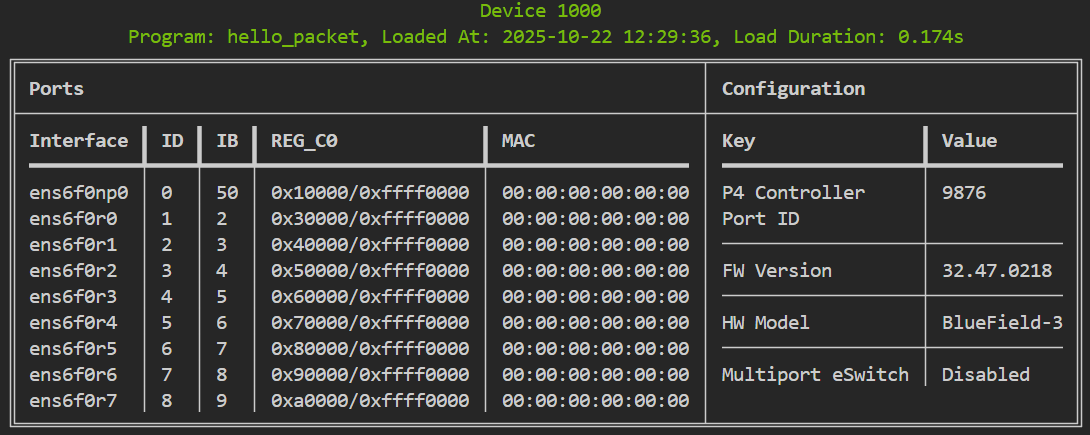
devices
nspect devices
Lists all configured DPL devices, displaying a table for each device.
-
Title: Contains program details only if a program is loaded.
-
Interface: The interface name as defined in the DP device configuration file.
-
ID: The port ID as defined in the DPL device configuration file.
-
IB: The physical InfiniBand port ID used for the DPL port ID.
Example output:
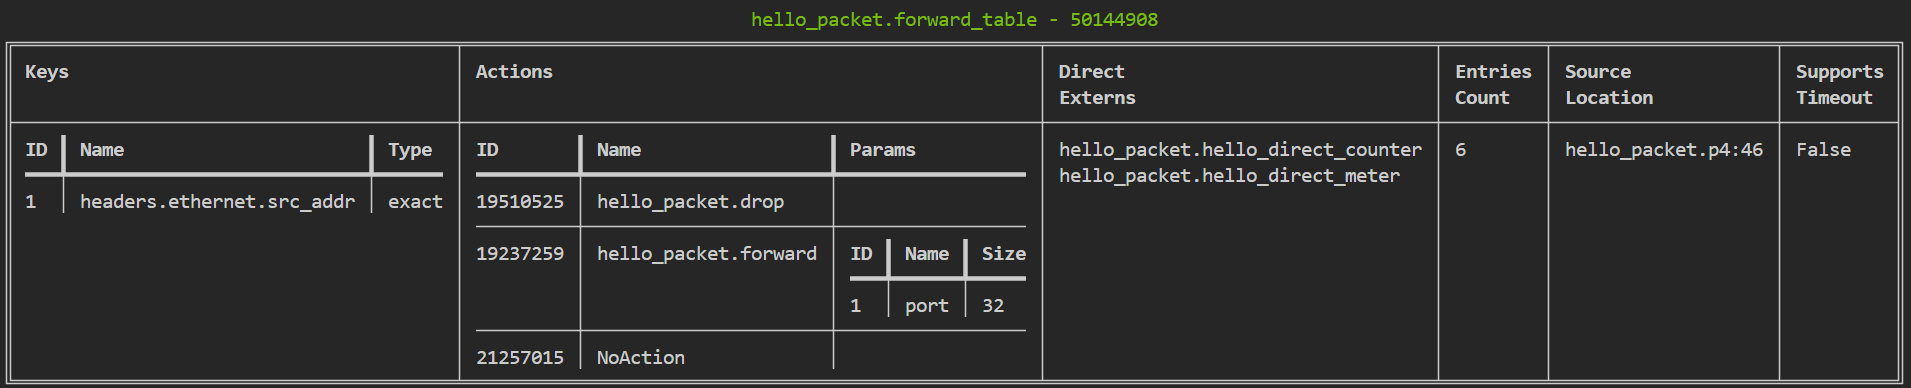
tables
nspect tables [--json]
Lists all tables defined in the DPL program.
-
ID: The P4 runtime ID of the object as defined in the
p4info.txtfile. -
Direct Externs: Lists the names of all direct extern instances defined for the table (e.g., direct counter, direct meter).
Output example:
The --json flag provides the output in JSON format. For example:
[
  {
    "title": {
      "Table ID": 40048916,
      "Table Name": "tbl_drop"
    },
    "rows": [
      {
        "Keys": {
          "title": {},
          "rows": []
        },
        "Actions": {
          "title": {},
          "rows": [
            {
              "ID": "19510525",
              "Name": "hello_packet.drop",
              "Params": ""
            }
          ]
        },
        "Direct Externs": [],
        "Entries Count": "1",
        "Source Location": "None",
        "Supports Timeout": "False"
      }
    ]
  },
  {
    "title": {
      "Table ID": 50144908,
      "Table Name": "hello_packet.forward_table"
    },
    "rows": [
      {
        "Keys": {
          "title": {},
          "rows": [
            {
              "ID": "1",
              "Name": "headers.ethernet.src_addr",
              "Type": "exact"
            }
          ]
        },
        "Actions": {
          "title": {},
          "rows": [
            {
              "ID": "19510525",
              "Name": "hello_packet.drop",
              "Params": ""
            },
            {
              "ID": "19237259",
              "Name": "hello_packet.forward",
              "Params": {
                "title": {},
                "rows": [
                  {
                    "ID": "1",
                    "Name": "port",
                    "Size": "32"
                  }
                ]
              }
            },
            {
              "ID": "21257015",
              "Name": "NoAction",
              "Params": ""
            }
          ]
        },
        "Direct Externs": [
          "hello_packet.hello_direct_counter",
          "hello_packet.hello_direct_meter"
        ],
        "Entries Count": "6",
        "Source Location": "hello_packet.p4:46",
        "Supports Timeout": "False"
      }
    ]
  }
]
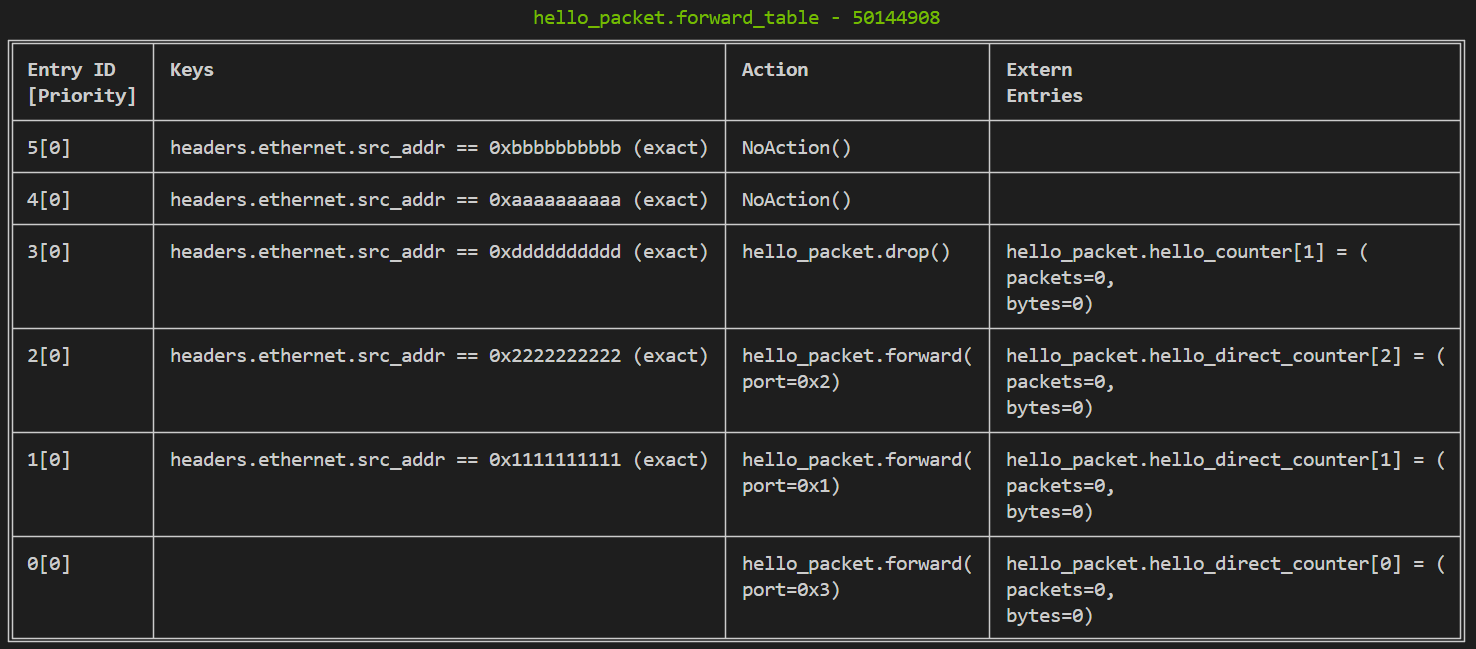
query
nspect query
Lists all entries currently contained in each table.
-
Entry ID: The runtime ID assigned to the entry at creation time (not a P4 context ID).
-
Keys: If no key is displayed, it indicates a default entry.
-
Extern entries: Displays data for extern entries associated with the table entry (result of an explicit extern call within the Action).
Example output:
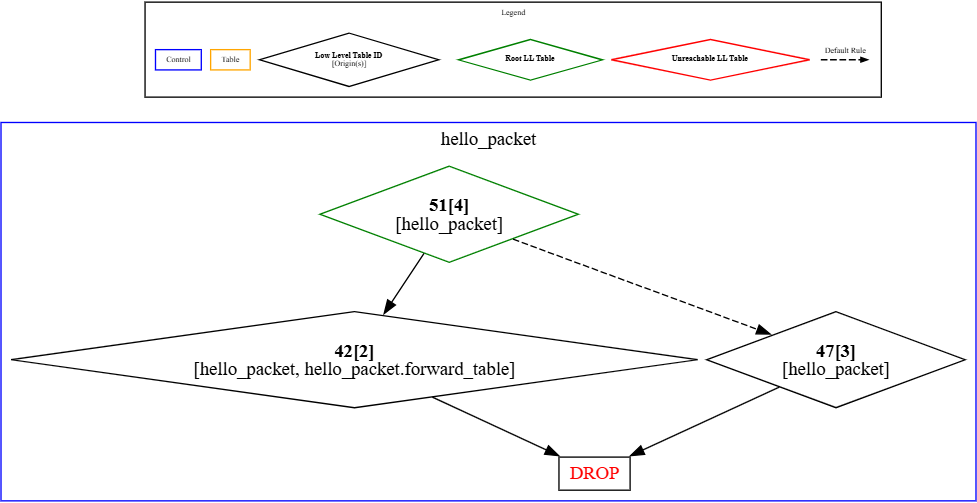
graph
nspect --low-level graph
Generates a DOT graph representing all potential packet paths within the pipeline.
Example output:
digraph hello_packet_pipeline {
    graph [compound=true nodesep=0.1]
    node [height=0 width=0]
    // Legend
    subgraph cluster_legend {
        graph [fontsize="6pt" label=Legend]
        control [label=Control color=blue fontsize="6pt" id=control shape=rectangle]
        table [label=Table color=orange fontsize="6pt" id=table shape=rectangle]
        ll_table [label=<<B>Low Level Table ID</B><BR/>[Origin(s)]> fontsize="6pt" id=ll_table shape=diamond]
        legend_invis [height=0 id=legend_invis shape=point style=invis width=0]
        ll_root_table [label=<<B>Root LL Table</B>> color=green fontsize="6pt" id=ll_root_table shape=diamond]
        ll_unreachable_table [label=<<B>Unreachable LL Table</B>> color=red fontsize="6pt" id=ll_unreachable_table shape=diamond]
        default_rule_invis_tail [fontsize="6pt" height=0 id=default_rule_invis_tail shape=point style=invis width=0]
        default_rule_invis_head [fontsize="6pt" height=0 id=default_rule_invis_head shape=point style=invis width=0]
        default_rule_invis_tail -> default_rule_invis_head [label="Default Rule" arrowsize="0.5px" fontsize="6pt" id="default_rule_invis_tail-default_rule_invis_head" style=dashed]
        subgraph rank_0 {
            rank=same
            control [id=control]
            default_rule_invis_head [id=default_rule_invis_head]
            default_rule_invis_tail [id=default_rule_invis_tail]
            ll_root_table [id=ll_root_table]
            ll_table [id=ll_table]
            ll_unreachable_table [id=ll_unreachable_table]
            table [id=table]
        }
    }
    // Pipeline Stage: main
    subgraph cluster_hello_packet {
        graph [color=blue label=hello_packet shape=rectangle]
        legend_invis [height=0 id=legend_invis shape=point style=invis width=0]
        "51[4]" [label=<<B>51[4]</B><BR/>[hello_packet]> color=green id="51[4]" shape=diamond]
        "42[2]" [label=<<B>42[2]</B><BR/>[hello_packet, hello_packet.forward_table]> id="42[2]" shape=diamond]
        DROP [fontcolor=red id=DROP shape=box]
        "47[3]" [label=<<B>47[3]</B><BR/>[hello_packet]> id="47[3]" shape=diamond]
        legend_invis -> "51[4]" [id="legend_invis-51[4]" style=invis]
        "51[4]" -> "42[2]" [id="51[4]-42[2]"]
        "42[2]" -> DROP [id="42[2]-DROP"]
        "51[4]" -> "47[3]" [id="51[4]-47[3]" style=dashed]
        "47[3]" -> DROP [id="47[3]-DROP"]
        subgraph rank_0 {
            rank=same
            "51[4]" [id="51[4]"]
        }
        subgraph rank_1 {
            rank=same
            "42[2]" [id="42[2]"]
            "47[3]" [id="47[3]"]
        }
        subgraph rank_2 {
            rank=same
            DROP [id=DROP]
        }
    }
}
nspect --low-level graph --url
The --url flag generates an HTTP URL link to render the graph using GraphvizOnline.
Legend:
-
Low Level Table (LL Table): Refers to the internal HWS Table object created from loading the DPL program.
-
Root LL Table: The starting point of the generated pipeline.
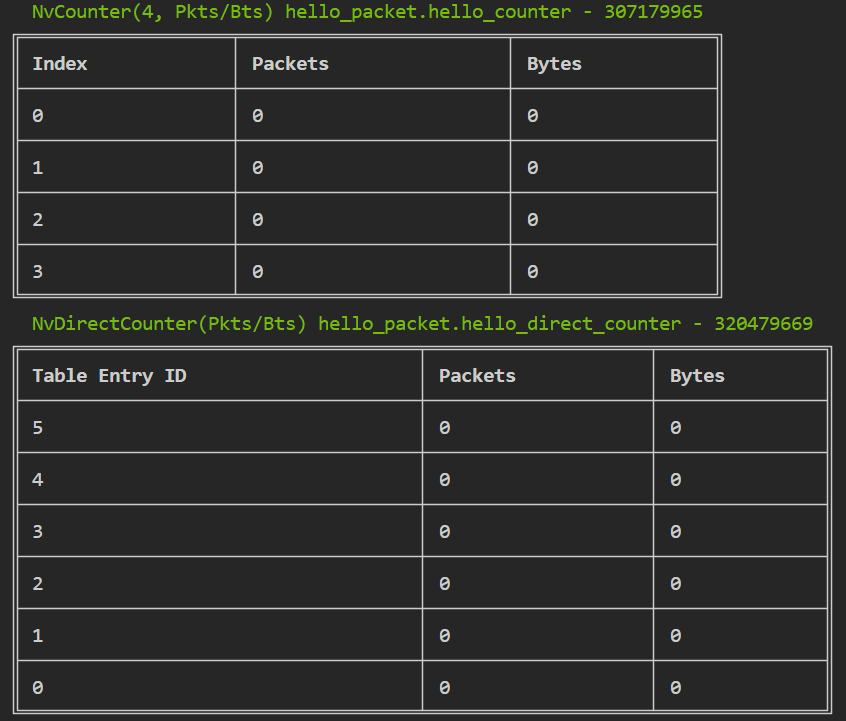
counters
nspect counters
Lists all counters in the DPL program (one table per counter instance).
-
Indirect Counters: First column shows Index.
-
Direct Counters: First column shows Table Entry ID (corresponds to the ID seen in the
querycommand).
Example output:
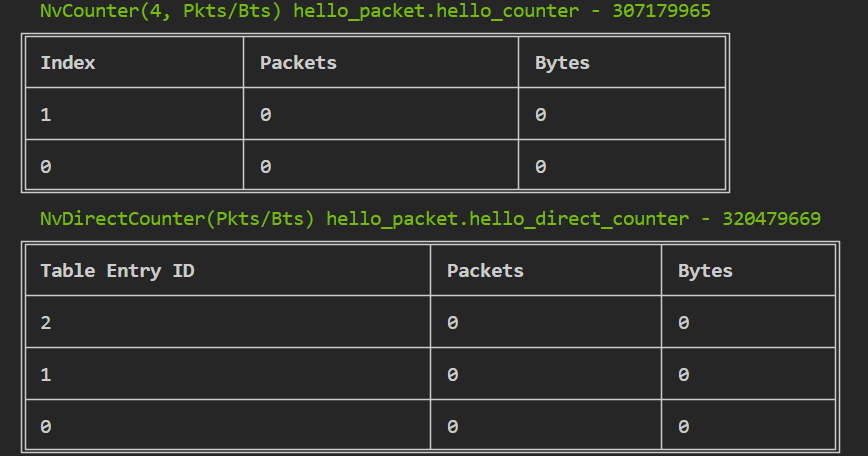
The --in-use flag returns only the used extern instance entries (entries explicitly called within an action).
nspect counters --in-use
Example output:
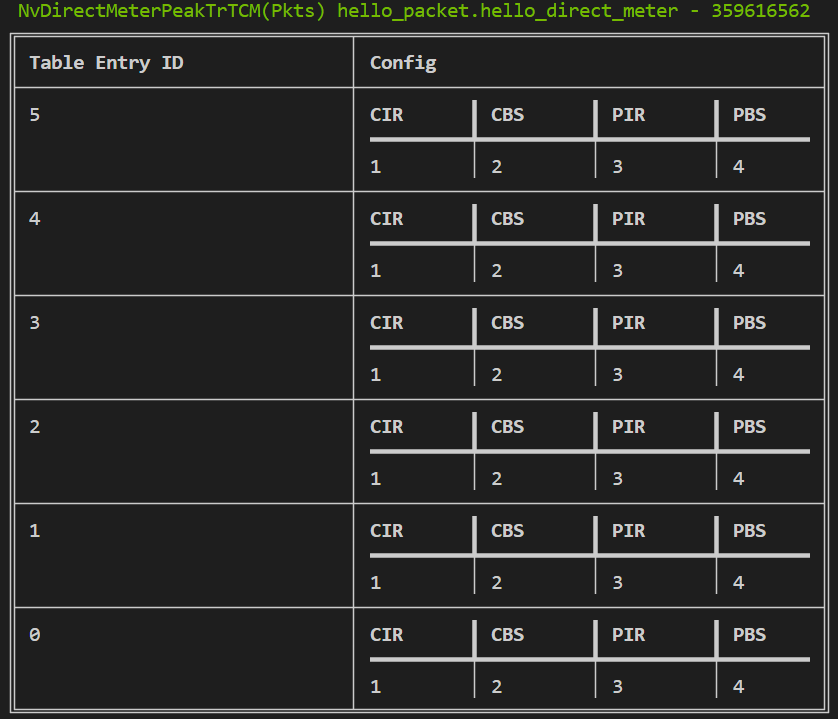
meters
nspect meters
Lists all meters in the DPL program (one table per meter instance).
-
Indirect Meters: First column shows Index.
-
Direct Meters: First column shows Table Entry ID (corresponds to the ID seen in the
querycommand).
Example output:
debug
Starts a debug session. Packets sent during this session are traced and recorded to an output archive, which can be inspected using the DPL Debugger.
nspect debug -o hello_packet.tar.gz

perf
nspect perf
Displays real-time performance statistics.
Example output:
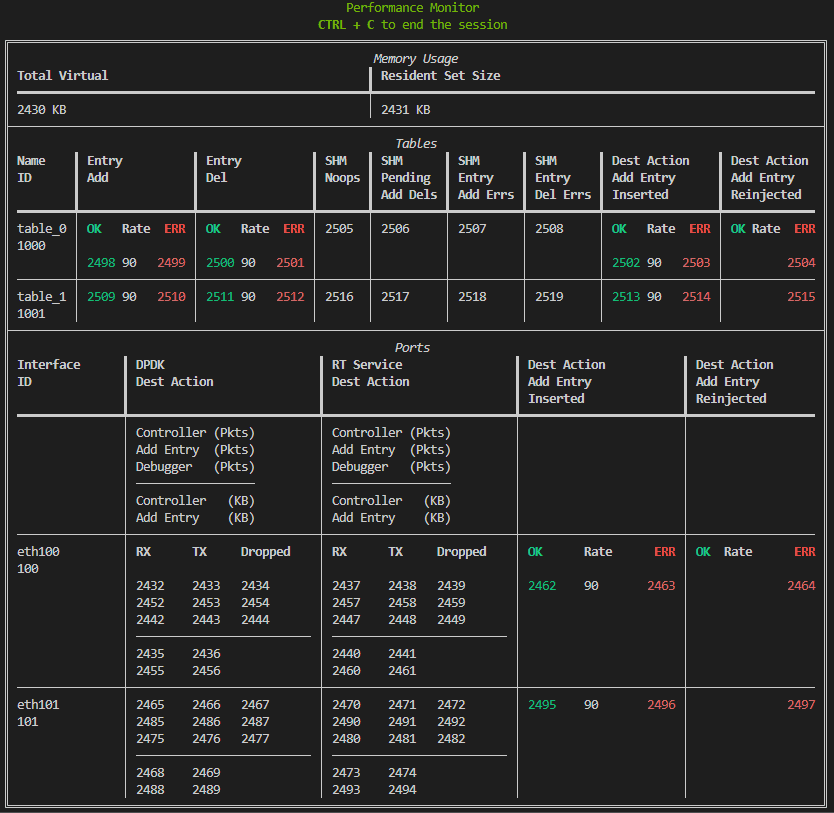
The following sections breakdown the statistics provided in the example output.
Memory Usage Statistics
Displays the real-time memory consumption of the DPL Runtime Service.
|
Metric |
Description |
|---|---|
|
Total Virtual Memory |
The total amount of virtual memory used by the service. |
|
Resident Set Size |
The amount of physical memory (RAM) currently being used (in KB). |
Table Entry Operations Statistics
Tracks operations for each DPL table (one row per table).
|
Category |
Column |
Description |
Notes |
|---|---|---|---|
|
Entry Add/Del |
OK |
Total number of successful additions or deletions |
Tracks all table entry operations. |
|
ERR |
Total number of failed additions or deletions |
|
|
|
Rate |
The difference in successful operations between the current and previous sample |
|
|
|
SHM |
Noops |
Count of entries where a delete was requested before the addition was fully processed |
Verbose mode only. Tracks entries. Only for SHM-enabled tables |
|
Pending Add Dels |
Count of delete operations received for entries that are still pending hardware confirmation |
Verbose mode only. Tracks operations |
|
|
Entry Add/Del Errs |
Total number of failed SHM entry additions or deletions |
Verbose mode only. Tracks operations |
|
|
Dest Action Add Entry |
Inserted |
Successful table entry additions triggered specifically by the Add Entry action |
Verbose mode only. Tracks table entries |
|
Reinjected |
Total number of failed reinjection attempts (ERR column). |
Verbose mode only. Tracks packets. The OK/Rate columns are always empty |
Port Statistics Statistics
Tracks packet flow through destination actions (one row per Port Interface ID).
|
Layer |
Row/Action |
Description |
Notes |
|---|---|---|---|
|
DPDK Dest Action |
N/A |
Packet flow statistics at the hardware (DPDK) layer |
|
|
RT Service Dest Action |
N/A |
Packet flow statistics at the application (RT Service) layer |
|
|
Action Types |
Controller |
Flow statistics for packets destined for the Controller |
|
|
Add Entry |
Flow statistics for packets destined for the Add Entry action |
Same metrics as the Tables section, but tracked per port |
|
|
Debugger |
Flow statistics for packets destined for the Debugger |
Only displays Packet Counts (no KB) |
|
|
Flow Direction |
RX / TX |
Packets received or transmitted in this layer/action |
Displays both Packet Counts and KB |
|
Dropped |
Packets dropped in this layer/action |
Only displays Packet Counts (no KB) |
hello_packet.p4
/*
 * SPDX-FileCopyrightText: Copyright (c) 2025 NVIDIA CORPORATION & AFFILIATES. All rights reserved.
 * SPDX-License-Identifier: LicenseRef-NvidiaProprietary
 *
 * NVIDIA CORPORATION, its affiliates and licensors retain all intellectual
 * property and proprietary rights in and to this material, related
 * documentation and any modifications thereto. Any use, reproduction,
 * disclosure or distribution of this material and related documentation
 * without an express license agreement from NVIDIA CORPORATION or
 * its affiliates is strictly prohibited.
 */

#include <doca_model.p4>
#include <doca_headers.p4>
#include <doca_externs.p4>
#include <doca_parser.p4>

/*
 * This basic application demonstrates a simple match/action pipeline using NVIDIA
 * DOCA P4 Target Architecture.
 * - Match on destination MAC address
 * - Forward or drop the packet
 */

control hello_packet(
    inout nv_headers_t headers,
    in nv_standard_metadata_t std_meta,
    inout nv_empty_metadata_t user_meta,
    inout nv_empty_metadata_t pkt_out_meta
) {
    NvCounter(4, NvCounterType.PACKETS_AND_BYTES) hello_counter;
    NvDirectCounter(NvCounterType.PACKETS_AND_BYTES) hello_direct_counter;
    NvDirectMeterPeakTrTCM(NvMeterUnits.PACKETS, 1, 2, 3, 4) hello_direct_meter;

    action drop() {
        hello_counter.count(1);
        nv_send_debug_pkt();
        nv_drop();
    }

    action forward(bit<32> port) {
        hello_direct_counter.count();
        nv_send_to_port(port);
    }

    table forward_table {
        key = {
            headers.ethernet.src_addr : exact;
        }
        actions = {
            drop;
            forward;
            NoAction;
        }
        default_action = forward(3);
        direct_meter = hello_direct_meter;
        direct_counter = hello_direct_counter;
        const entries = {
            (48w0x001111111111) : forward(1);
            (48w0x002222222222) : forward(2);
            (48w0x00dddddddddd) : drop();
            (48w0x00aaaaaaaaaa) : NoAction();
            (48w0x00bbbbbbbbbb) : NoAction();
        }
    }
    apply {
        hello_counter.count(0);
        if (headers.ipv4.isValid()) {
            forward_table.apply();
        }
        drop();
    }
}

NvDocaPipeline(
    nv_fixed_parser(),
    hello_packet()
) main;
Last updated: