

This guide provides an overview and configuration instructions for DOCA Telemetry Exporter API.
Introduction
The quality status of DOCA libraries is listed here.
DOCA Telemetry Exporter API offers a fast and convenient way to transfer user-defined data to DOCA Telemetry Service (DTS). In addition, the API provides several built-in outputs for user convenience, including saving data directly to storage, NetFlow, Fluent Bit forwarding, and Prometheus endpoint.
The following figure shows an overview of the telemetry exporter API. The telemetry exporter client side, based on the telemetry exporter API, collects user-defined telemetry and sends it to DTS which runs as a container on BlueField or host. DTS does further data routing, including export with filtering. DTS can process several user-defined telemetry exporter clients and can collect pre-defined counters by itself. Additionally, telemetry exporter API has built-in data outputs that can be used from telemetry exporter client applications.
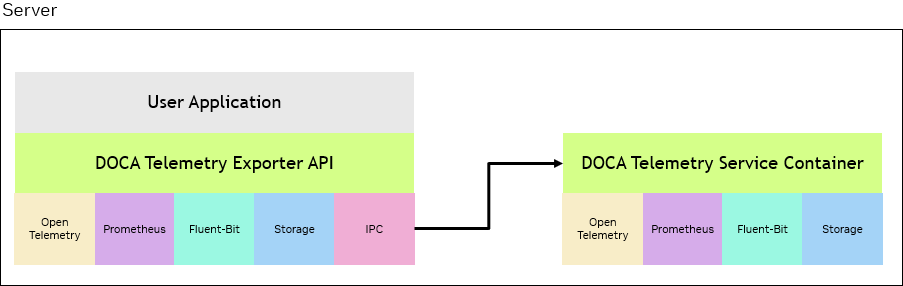
The following scenarios are available:
-
Send data via IPC transport to DTS. For IPC, refer to Inter-process Communication.
-
Write data as binary files to storage (for debugging data format).
-
Export data directly from DOCA Telemetry Exporter API application using the following options:
-
Fluent Bit exports data through forwarding
-
NetFlow exports data from NetFlow API. Available from both API and DTS. See details in Data Outputs.
-
Prometheus
-
Server mode – Creates Prometheus endpoint and keeps the most recent data to be scraped by Prometheus.
-
Remote write mode – Pushes Prometheus time-series metrics to a remote Prometheus DB supporting remote-write import.
-
-
Open Telemetry export
-
Users can either enable or disable any of the data outputs mentioned above. See Data Outputs to see how to enable each output.
The library stores data in an internal buffer and flushes it to DTS/exporters in the following scenarios:
-
Once the buffer is full. Buffer size is configurable with different attributes.
-
When
doca_telemetry_exporter_source_flush(void *doca_source)function is invoked. -
When the telemetry exporter client terminates. If the buffer has data, it is processed before the library's context cleanup.
Architecture
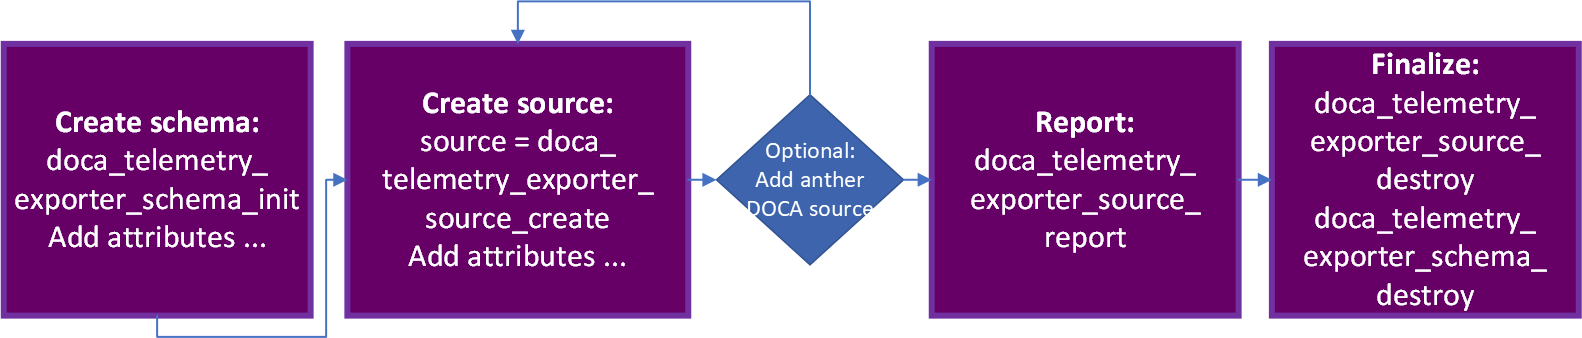
DOCA Telemetry Exporter API is fundamentally built around four major parts:
-
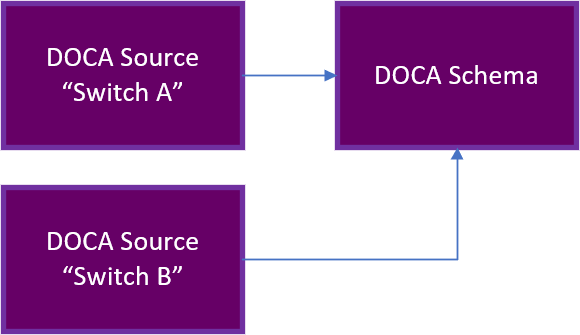
DOCA schema – defines a reusable structure (see doca_telemetry_exporter_type) of telemetry data which can be used by multiple sources
-
Source – the unique identifier of the telemetry exporter source that periodically reports telemetry data.
-
Report – exports the information to the DTS
-
Finalize – releases all the resources
Prerequisites and Compatibility
DOCA 3.6 requires CollectX 1.27.3 or later, which provides libclx_api.so.2.
Applications built against DOCA 3.5 or earlier link libclx_api.so.1 and must be rebuilt against DOCA 3.6 to run on a host with CollectX 1.27 or later; otherwise they fail to start with "libclx_api.so.1: cannot open shared object file".
DOCA Telemetry Exporter API Walkthrough
The NVIDIA DOCA Telemetry Exporter API's definitions can be found in the doca_telemetry_exporter.h file.
The following is a basic walkthrough of the needed steps for using the DOCA Telemetry Exporter API.
-
Create
doca_schema.-
Initialize an empty schema with default attributes:
struct doca_telemetry_exporter_schema *doca_schema; doca_telemetry_exporter_schema_init("example_doca_schema_name", &doca_schema); -
Set the following attributes if needed:
-
doca_telemetry_exporter_schema_set_buf_*(…) -
doca_telemetry_exporter_schema_set_file_write_*(…) -
doca_telemetry_exporter_schema_set_ipc_*(…)
-
-
Configure exporters if needed before
doca_telemetry_exporter_schema_start.-
doca_telemetry_exporter_schema_set_exporter_option(…) -
doca_telemetry_exporter_schema_set_exporter_enabled(…)
-
-
Add user event types:
Event type (
struct doca_telemetry_exporter_type) is the user-defined data structure that describes event fields. The user is allowed to add multiple fields to the event type. Each field has its own attributes that can be set (see example). Each event type is allocated an index (doca_telemetry_exporter_type_index_t) which can be used to refer to the event type in future API calls.struct doca_telemetry_exporter_type *doca_type; struct doca_telemetry_exporter_field *field1; doca_telemetry_exporter_type_create(&doca_type); doca_telemetry_exporter_field_create(&field1); doca_telemetry_exporter_field_set_name(field1, "sport"); doca_telemetry_exporter_field_set_description(field1, "Source port") doca_telemetry_exporter_field_set_type_name(field1, DOCA_TELEMETRY_EXPORTER_FIELD_TYPE_UINT16); doca_telemetry_exporter_field_set_array_len(field1, 1); /* The user loses ownership on field1 after a successful invocation of the function */ doca_telemetry_exporter_type_add_field(type, field1); /* Add more fields if needed */ /* The user loses ownership on doca_type after a successful invocation of the function */ doca_telemetry_exporter_schema_add_type(doca_schema, "example_event", doca_type, &type_index); -
Apply attributes and types to start using the schema:
doca_telemetry_exporter_schema_start(doca_schema)
-
-
Create
doca_source:-
Initialize:
struct doca_telemetry_exporter_source *doca_source; doca_telemetry_exporter_source_create(doca_schema, &doca_source); -
Set source ID and tag:
doca_telemetry_exporter_source_set_id(doca_source, "example id"); doca_telemetry_exporter_source_set_tag(doca_source, "example tag"); -
Apply attributes to start using the source:
doca_telemetry_exporter_source_start(doca_source)
-
-
You may optionally add more
doca_sourcesif needed. -
Collect the data per source and use:
doca_telemetry_exporter_source_report(source, type_index, &my_app_test_ev1, num_events) -
Finalize:
-
For every source:
doca_telemetry_exporter_source_destroy(source) -
Destroy:
doca_telemetry_exporter_schema_destroy(doca_schema)
-
Example implementation may be found in the telemetry_export DOCA sample (telemetry_export_sample.c).
DOCA Telemetry Exporter Sample Loop Walkthrough
Most telemetry exporter applications collect data in a periodic loop:
-
sample
-
report/flush
-
sleep
It is recommended to pace that loop with doca_telemetry_exporter_sleep() instead of the application's own sleep.
In that case, the library owns the cadence.
doca_telemetry_exporter_sleep() is a deadline-based sleep: it sleeps until the previous wake-up time plus the given period, so the loop keeps a stable rate regardless of how long sampling and reporting took. After every wake-up it also processes pending IPC commands from DTS, which allows DTS to control the sampling rate at runtime (see DOCA Telemetry Exporter Dual-Rate Sampling (HFT/LFT)).
Choose the sample period period_us of the application (e.g., 1000000 for one second).
-
In the loop, report the data, flush once, and call doca_telemetry_exporter_sleep():
while (running) {
    /* sample ... */
    doca_telemetry_exporter_source_report(doca_source, type_index, &my_app_test_ev1, num_events);
    doca_telemetry_exporter_source_flush(doca_source);
    doca_telemetry_exporter_sleep(doca_source, period_us);
}
Example implementation may be found in the telemetry_export_metrics_hft_lft DOCA sample (telemetry_export_metrics_hft_lft_sample.c). See DOCA Telemetry Exporter Sleep for the function reference.
DOCA Telemetry Exporter NetFlow API Walkthrough
The DOCA telemetry exporter API also supports NetFlow using DOCA Telemetry Exporter NetFlow API. This API is designed to allow customers to easily support the NetFlow protocol at the endpoint side. Once an endpoint produces NetFlow data using the API, the corresponding exporter can be used to send the data to a NetFlow collector.
The NVIDIA DOCA Telemetry Exporter Netflow API's definitions can be found in the doca_telemetry_exporter_netflow.h file.
The following are the steps to use the NetFlow API:
-
Initiate the API with an appropriate source ID:
doca_telemetry_exporter_netflow_init(source_id) -
Set the relevant attributes:
-
doca_telemetry_exporter_netflow_set_buf_*(…) -
doca_telemetry_exporter_netflow_set_file_write_*(…) -
doca_telemetry_exporter_netflow_set_ipc_*(…) -
doca_telemetry_exporter_netflow_source_set_*()
-
-
Start the API to use the configured attribute:
doca_telemetry_exporter_netflow_start(); -
Form a desired NetFlow template and the corresponding NetFlow records.
-
Collect the NetFlow data.
doca_telemetry_exporter_netflow_send(…) -
(Optional) Flush the NetFlow data to send data immediately instead of waiting for the buffer to fill:
doca_telemetry_exporter_netflow_flush() -
Clean up the API:
doca_telemetry_exporter_netflow_destroy()
Example implementation may be found in the telemetry_export_netflow DOCA sample (telemetry_export_netflow_sample.c).
DOCA Telemetry Exporter Metrics API Walkthrough
The DOCA Telemetry Exporter provides a Metrics API for the programmatic collection and export of performance metrics from applications. This API enables applications to report counters, gauges, and histograms with multi-dimensional labels, supporting export to multiple backends including file storage, IPC, and Prometheus.
Supported Metric Types
-
Counter: Monotonically increasing values (e.g., total requests, bytes sent, operations completed).
-
Gauge: Current values that can increase or decrease (e.g., memory usage, queue depth, bandwidth).
-
Histogram: Distribution of values across configurable buckets (e.g., latency percentiles, message sizes).
Initialization
The Metrics API requires a DOCA Telemetry Exporter source to be initialized before metrics can be reported.
Prerequisites:
-
Initialize the DOCA schema (
doca_telemetry_exporter_schema_init). -
Configure and start the schema (
doca_telemetry_exporter_schema_start). -
Create the source (
doca_telemetry_exporter_source_create). -
Start the source (
doca_telemetry_exporter_source_start).
At least one export backend (file, IPC, or Prometheus) must be enabled on the schema before creating the metrics context.
Example initialization:
struct doca_telemetry_exporter_schema *schema = NULL;
struct doca_telemetry_exporter_source *source = NULL;
doca_error_t result;

// 1. Initialize schema and source
result = doca_telemetry_exporter_schema_init("my_app", &schema);
if (result != DOCA_SUCCESS) { /* Handle error */ }

doca_telemetry_exporter_schema_start(schema);
doca_telemetry_exporter_source_create(schema, &source);
doca_telemetry_exporter_source_set_id(source, "my_source");
doca_telemetry_exporter_source_set_tag(source, "");
doca_telemetry_exporter_source_start(source);

// 2. Create metrics context
result = doca_telemetry_exporter_metrics_create_context(source);
if (result != DOCA_SUCCESS) {
    // Handle error
}

// 3. Configure metrics (Optional)
// Set periodic flush to every 1 second (1000 ms)
doca_telemetry_exporter_metrics_set_flush_interval_ms(source, 1000);
// Add a constant label applied to all metrics from this source
doca_telemetry_exporter_metrics_add_constant_label(source, "application", "my_app");
Working with Labels
Label sets define the dimensional structure of metrics. A label set specifies the names of the labels (e.g., "interface", "direction"), while the metrics themselves provide the specific values (e.g., "eth0", "tx").
Creating Label Set
// Define label names
const char *label_names[] = {"interface", "direction"};
doca_telemetry_exporter_label_set_id_t label_set_id;

// Register the label set
result = doca_telemetry_exporter_metrics_add_label_names(
    source,
    label_names,
    2,  // Number of labels
    &label_set_id
);
Using Label Values
// Define values matching the label names
const char *eth0_tx_labels[] = {"eth0", "tx"};
const char *eth1_rx_labels[] = {"eth1", "rx"};

uint64_t timestamp;
doca_telemetry_exporter_get_timestamp(×tamp);

// Report metrics using different label combinations
doca_telemetry_exporter_metrics_add_counter(source, timestamp,
    "bytes_total", 1024000, label_set_id, eth0_tx_labels);

doca_telemetry_exporter_metrics_add_counter(source, timestamp,
    "bytes_total", 2048000, label_set_id, eth1_rx_labels);
Constant Labels
Constant labels are applied globally to all metrics reported from a specific source.
doca_telemetry_exporter_metrics_add_constant_label(source, "hostname", "server01");
doca_telemetry_exporter_metrics_add_constant_label(source, "version", "1.0");
Counters
Counters represent cumulative totals. They are strictly monotonically increasing.
API functions:
-
doca_telemetry_exporter_metrics_add_counter(): Set counter to an absolute value. -
doca_telemetry_exporter_metrics_add_counter_increment(): Increment counter by a specified amount.
Example:
uint64_t timestamp;
doca_telemetry_exporter_get_timestamp(×tamp);
const char *label_values[] = {"requests"};

// Set absolute counter value
doca_telemetry_exporter_metrics_add_counter(source, timestamp,
    "operations_total", 42, label_set_id, label_values);

// Increment counter
doca_telemetry_exporter_metrics_add_counter_increment(source, timestamp,
    "operations_total", 1, label_set_id, label_values);
Gauges
Gauges represent instantaneous values that can go up or down, such as memory usage or bandwidth.
API functions:
-
doca_telemetry_exporter_metrics_add_gauge(): Report a gauge with adoubleprecision value. -
doca_telemetry_exporter_metrics_add_gauge_uint64(): Report a gauge with auint64_tvalue.
Example:
uint64_t timestamp;
doca_telemetry_exporter_get_timestamp(×tamp);
const char *label_values[] = {"bandwidth"};

// Double precision gauge
double bandwidth_gbps = 10.5;
doca_telemetry_exporter_metrics_add_gauge(source, timestamp,
    "bandwidth_gbps", bandwidth_gbps, label_set_id, label_values);

// Integer gauge
uint64_t memory_bytes = 1073741824;
doca_telemetry_exporter_metrics_add_gauge_uint64(source, timestamp,
    "memory_usage_bytes", memory_bytes, label_set_id, label_values);
Histograms
Histograms track the distribution of values (observations) across configurable buckets.
Creating and Observing a Histogram
double latency_buckets[] = {1.0, 5.0, 10.0, 25.0, 50.0, 100.0, 500.0, 1000.0};
const char *label_values[] = {"tcp"};
doca_telemetry_exporter_histogram_id_t histogram_id;

// Create the histogram definition
result = doca_telemetry_exporter_metrics_add_histogram(
    source, timestamp, "latency_ms",
    latency_buckets, 8,  // 8 bucket boundaries
    label_set_id, label_values,
    &histogram_id
);

// Record observations
doca_telemetry_exporter_metrics_histogram_observe(source, histogram_id, 15.3);
doca_telemetry_exporter_metrics_histogram_observe(source, histogram_id, 8.7);
doca_telemetry_exporter_metrics_histogram_observe(source, histogram_id, 42.1);
Base Histogram (Templates)
For metrics that require multiple label combinations, use a base histogram as a template.
doca_telemetry_exporter_base_histogram_id_t base_histogram_id;

// Create base histogram template
result = doca_telemetry_exporter_metrics_add_base_histogram(
    source, "latency_ms",
    latency_buckets, 8,
    label_set_id,
    1000,  // flush_interval_ms
    &base_histogram_id
);

// Observe with specific label values (creates instance automatically)
const char *tcp_labels[] = {"tcp"};
doca_telemetry_exporter_histogram_id_t tcp_histogram_id;

doca_telemetry_exporter_metrics_base_histogram_observe(
    source, base_histogram_id, tcp_labels, 15.3, &tcp_histogram_id
);
Best Practices
Flushing Metrics
Metrics are buffered internally. Configure periodic automatic flushing for frequent exports, and always flush before program exit.
// Configure automatic flush (e.g., every 1 second)
doca_telemetry_exporter_metrics_set_flush_interval_ms(source, 1000);

// Flush manually before destruction
doca_telemetry_exporter_metrics_flush(source);
Label Cardinality
Keep the total number of unique label combinations reasonable to avoid high memory usage and backend strain.
-
Good: Low cardinality labels (e.g., interface names, status codes).
-
Bad: High cardinality labels (e.g., random flow IDs, unique request IDs).
-
Recommendation: Keep total unique label combinations under 10,000.
Metric Naming Conventions
For Prometheus compatibility, adhere to the following naming standards:
-
Format:
snake_case(e.g.,network_bandwidth_gbps). -
Units: Suffix with the unit (e.g.,
_bytes,_seconds). -
Counters: End with
_total(e.g.,requests_total). -
Gauges: Reflect current state (e.g.,
memory_usage_bytes).
Error Handling
Always check return values (doca_error_t) for all metrics functions.
if (result != DOCA_SUCCESS) {
    DOCA_LOG_ERR("Failed to add counter: %s", doca_error_get_descr(result));
}
Cleanup
Properly destroy resources in reverse order of creation.
doca_telemetry_exporter_metrics_flush(source);
doca_telemetry_exporter_metrics_destroy_context(source);
doca_telemetry_exporter_source_destroy(source);
doca_telemetry_exporter_schema_destroy(schema);
DOCA Telemetry Exporter OTLP Logs API Walkthrough
The DOCA Telemetry Exporter provides an OTLP Logs API for the programmatic collection and export of structured log events from applications.
This API enables applications to report log records with resources, scopes, severity levels, and typed attributes, supporting export to OTLP-compatible backends such as OpenTelemetry Collector, Jaeger, and cloud observability platforms.
Supported Concepts
|
Concept |
Description |
|---|---|
|
Resource |
Represents the entity generating logs (e.g., service, device, node). Resources carry attributes such as |
|
Scope |
Represents an instrumentation library or functional component. A scope defines the event schema, including attribute keys, attribute types, event name, and default severity. |
|
Event |
A log record emitted using a resource and scope. Events provide attribute values that must match the scope schema and may override the default severity. |
|
Attributes |
Key-value pairs attached to resources or events. Supported types are |
Initialization
The OTLP Logs API requires a DOCA Telemetry Exporter schema and source to be initialized before log events can be reported.
Prerequisites
-
Initialize the DOCA schema (
doca_telemetry_exporter_schema_init). -
Enable opaque events (
doca_telemetry_exporter_schema_set_opaque_events_enabled)Required for OTLP logs.
-
Configure and start the schema (
doca_telemetry_exporter_schema_start). -
Create the source (
doca_telemetry_exporter_source_create). -
Start the source (
doca_telemetry_exporter_source_start). -
Create the OTLP logs context (
doca_telemetry_exporter_otlp_logs_create_context).
Example Initialization
struct doca_telemetry_exporter_schema *schema = NULL;
struct doca_telemetry_exporter_source *source = NULL;
doca_error_t result;

// Initialize schema
result = doca_telemetry_exporter_schema_init("my_app", &schema);
if (result != DOCA_SUCCESS) { /* Handle error */ }

// Configure schema
doca_telemetry_exporter_schema_set_buf_data_root(schema, "/tmp/doca_telemetry_buffer");
doca_telemetry_exporter_schema_set_opaque_events_enabled(schema); // Required

// Start schema and source
doca_telemetry_exporter_schema_start(schema);
doca_telemetry_exporter_source_create(schema, &source);
doca_telemetry_exporter_source_set_id(source, "my_source");
doca_telemetry_exporter_source_set_tag(source, "");
doca_telemetry_exporter_source_start(source);

// Create OTLP logs context
result = doca_telemetry_exporter_otlp_logs_create_context(source);
if (result != DOCA_SUCCESS) { /* Handle error */ }
Working with Resources
Resources describe the entity producing log events.
Creating a Resource
doca_telemetry_exporter_otlp_logs_resource_id_t resource_id;
result = doca_telemetry_exporter_otlp_logs_add_resource(source, &resource_id);
Adding Resource Attributes
doca_telemetry_exporter_otlp_logs_add_resource_attribute_string(
    source, resource_id, "service.name", "doca_network_service");

doca_telemetry_exporter_otlp_logs_add_resource_attribute_string(
    source, resource_id, "host.name", "server01");

doca_telemetry_exporter_otlp_logs_add_resource_attribute_string(
    source, resource_id, "device.name", "mlx5_0");

doca_telemetry_exporter_otlp_logs_add_resource_attribute_int(
    source, resource_id, "device.port", 1);

doca_telemetry_exporter_otlp_logs_add_resource_attribute_bool(
    source, resource_id, "is_primary", true);
Working with Scopes
Scopes define the event schema and default severity.
Creating a Scope
const char *attr_keys[] = {"message", "error_code", "severity"};
doca_telemetry_exporter_otlp_attribute_type_t attr_types[] = {
    DOCA_TELEMETRY_EXPORTER_OTLP_ATTRIBUTE_TYPE_STRING,
    DOCA_TELEMETRY_EXPORTER_OTLP_ATTRIBUTE_TYPE_INT,
    DOCA_TELEMETRY_EXPORTER_OTLP_ATTRIBUTE_TYPE_STRING
};

doca_telemetry_exporter_otlp_logs_scope_id_t scope_id;

result = doca_telemetry_exporter_otlp_logs_add_scope(
    source,
    "doca.telemetry.example",  // scope_name
    "1.0.0",                    // scope_version
    "network_event",            // event_name
    "INFO",                     // default_severity
    attr_keys,
    attr_types,
    3,
    &scope_id
);
Writing Log Events
Events must provide attribute values matching the scope schema and order.
Writing Event with Default Severity
doca_telemetry_exporter_otlp_attribute_value_t values[3];
values[0].string_value = "Connection established";
values[1].int_value = 0;
values[2].string_value = "INFO";

doca_telemetry_exporter_otlp_logs_write_event(
    source, resource_id, scope_id, values);
Writing Event with Custom Severity
doca_telemetry_exporter_otlp_attribute_value_t warn_values[3];
warn_values[0].string_value = "Packet loss detected";
warn_values[1].int_value = 2001;
warn_values[2].string_value = "WARN";

doca_telemetry_exporter_otlp_logs_write_event_with_severity(
    source, resource_id, scope_id, warn_values, "WARN");
Flushing and Cleanup
doca_telemetry_exporter_otlp_logs_flush(source);
doca_telemetry_exporter_otlp_logs_destroy_context(source);
doca_telemetry_exporter_source_destroy(source);
doca_telemetry_exporter_schema_destroy(schema);
Best Practices
Flushing Logs
Logs are buffered internally. Flush periodically or before shutdown to ensure delivery.
Severity Usage
Use consistent severity levels (INFO, WARN, ERROR) to simplify downstream filtering and alerting.
Error Handling
Always check doca_error_t return values.
if (result != DOCA_SUCCESS) { DOCA_LOG_ERR("OTLP logs error: %s", doca_error_get_descr(result)); }
API
Refer to DOCA Library APIs, for more detailed information on DOCA Telemetry Exporter API.
The pkg-config (*.pc file) for the DOCA Telemetry Exporter library is doca-telemetry-exporter.
The following sections provide additional details about the library API.
Some attributes are optional as they are initialized with default values. Refer to the documentation of the setter functions of respective attributes for more information.
DOCA Telemetry Exporter Buffer Attributes
Buffer attributes are used to set the internal buffer size and data root used by all DOCA sources in the schema.
Configuring the attributes is optional as they are initialized with default values.
doca_telemetry_exporter_schema_set_buf_size(doca_schema, 16 * 1024); /* 16KB - arbitrary value */
doca_telemetry_exporter_schema_set_buf_data_root(doca_schema, "/opt/mellanox/doca/services/telemetry/data/");
-
buffer_size [in]– the size of the internal buffer which accumulates the data before sending it to the outputs. Data is sent automatically once the internal buffer is full. Larger buffers mean fewer data transmissions and vice versa. -
data_root [in]– the path to where data is stored (iffile_write_enabledis set to true). The schema files are stored under<data_root>/schema. See section "DOCA Telemetry Exporter File Write Attributes".
The current values can be read back with doca_telemetry_exporter_schema_get_buf_size() and doca_telemetry_exporter_schema_get_buf_data_root().
DOCA Telemetry Exporter File Write Attributes
File write attributes are used to enable and configure data storage to the file system in binary format.
Configuring the attributes is optional as they are initialized with default values.
doca_telemetry_exporter_schema_set_file_write_enabled(doca_schema);
doca_telemetry_exporter_schema_set_file_write_max_size(doca_schema, 1 * 1024 * 1024); /* 1 MB */
doca_telemetry_exporter_schema_set_file_write_max_age(doca_schema, 60 * 60 * 1000000L); /* 1 Hour */
-
file_write_enable [in]– use this function to enable storage. Storage/FileWrite is disabled by default. -
file_write_max_size [in]– maximum file size (in bytes) before a new file is created. -
file_write_max_age [in]– maximum file age (in microseconds) before a new file is created.
DOCA Telemetry Exporter IPC Attributes
IPC attributes are used to enable and configure IPC transport. IPC is disabled by default.
Configuring the attributes is optional as they are initialized with default values.
It is important to make sure that the IPC location matches the IPC location used by DTS, otherwise IPC communication will fail. IPC requires write access to the DTS socket. Since it is created by root, the client may need to run as root.
doca_telemetry_exporter_schema_set_ipc_enabled(doca_schema);
doca_telemetry_exporter_schema_set_ipc_sockets_dir(doca_schema, "/path/to/sockets/");
doca_telemetry_exporter_schema_set_ipc_reconnect_time(doca_schema, 100); /* 100 milliseconds */
doca_telemetry_exporter_schema_set_ipc_reconnect_tries(doca_schema, 3);
doca_telemetry_exporter_schema_set_ipc_socket_timeout(doca_schema, 3 * 1000) /* 3 seconds */
-
ipc_enabled [in]– use this function to enable communication. IPC is disabled by default. -
ipc_sockets_dir [in]– a directory that contains UDS for IPC messages. Both the telemetry exporter program and DTS must use the same folder. DTS that runs on BlueField as a container has the default folder/opt/mellanox/doca/services/telemetry/ipc_sockets. -
ipc_reconnect_time [in]– maximum reconnection time in milliseconds after which the client is considered disconnected. -
ipc_reconnect_tries [in]– maximum reconnection attempts. -
ipc_socket_timeout [in]– timeout for the IPC socket.
DOCA Telemetry Exporter Source Attributes
Source attributes are used to create proper folder structure. All the data collected from the same host is written to the source_id folder under data root.
Sources attributes are mandatory and must be configured before invoking doca_telemetry_exporter_source_start().
doca_telemetry_exporter_source_set_id(doca_source, "example_source");
doca_telemetry_exporter_source_set_tag(doca_source, "example_tag");
-
source_id [in]– describes the data's origin. It is recommended to set it to the hostname. In later dataflow steps, data is aggregated from multiple hosts/DPUs andsource_idhelps navigate in it. -
source_tag [in]– a unique data identifier. It is recommended to set it to describe the data collected in the application. Several telemetry exporter apps can be deployed on a single node (host/DPU). In that case, each telemetry data would have a unique tag and all of them would share a singlesource_id.
DOCA Telemetry Exporter Netflow Collector Attributes
DOCA Telemetry Exporter NetFlow API attributes are optional and should only be used for debugging purposes. They represent the NetFlow collector's address while working locally, effectively enabling the local NetFlow exporter.
doca_telemetry_exporter_netflow_set_collector_addr("127.0.0.1");
doca_telemetry_exporter_netflow_set_collector_port(6343);
doca_telemetry_exporter_netflow_set_max_packet_size(1400);
-
collector_addr [in]– NetFlow collector's address (IP or name). Default value isNULL. -
collector_port [in]– NetFlow collector's port. Default value isDOCA_NETFLOW_DEFAULT_PORT (2055). -
max_packet_size [in]– maximum NetFlow datagram size in bytes. When not set (or set to 0), each flush is sent as a single datagram without fragmentation.
The NetFlow exporter stays disabled when no collector address is set or when the port is 0. When doca_telemetry_exporter_netflow_start() is called again after a previous configured run (init/start/destroy cycle), collector settings from the previous run are not reused; they must be set again.
DOCA Telemetry Exporter Exporter Attributes
Exporter attributes configure exporters through the API.
The attributes must be set in the following order:
-
doca_telemetry_exporter_schema_init()– initialize the schema -
For each provider:
-
doca_telemetry_exporter_schema_set_exporter_option()- set one or several options -
doca_telemetry_exporter_schema_set_exporter_enabled()- enable provider with options
-
-
doca_telemetry_exporter_schema_start()- apply all enabled providers to schema
doca_error_t doca_telemetry_exporter_schema_set_exporter_option(struct doca_telemetry_exporter_schema *doca_schema,
                                                                const char *key,
                                                                const char *value);
-
doca_schema [in]– a pointer to the schema -
key [in]– exporter option key (see the table below) -
value [in]– option value as text. Booleans are "true"/"false" (or "1"/"0"), numbers are decimal. Unknown keys are ignored.
The function returns:
-
DOCA_SUCCESSif successful -
DOCA_ERROR_INVALID_VALUEin case ofNULLparameter, an empty key, a key containing whitespace or '=', or a value rejected for thiskey. -
DOCA_ERROR_BAD_STATE(the schema was already started) -
DOCA_ERROR_NO_MEMORYin case of memory errors. -
DOCA_ERROR_UNKNOWNin case of unexpected status.
doca_error_t doca_telemetry_exporter_schema_set_exporter_enabled(struct doca_telemetry_exporter_schema *doca_schema,
                                                                 const char *exporter);
-
doca_schema [in] – a pointer to the schema
-
exporter [in] – exporter name, e.g. "prometheus”
The function returns:
-
DOCA_SUCCESSif successful -
DOCA_ERROR_INVALID_VALUEin case of an incorrect name -
DOCA_ERROR_BAD_STATEif the schema was already started, or options were not set or the exporter options were not set beforehand -
DOCA_ERROR_NO_MEMORY -
DOCA_ERROR_UNKNOWN
Both functions are DOCA_EXPERIMENTAL.
Supported exporter options
Values are text: booleans "true"/"false", numbers decimal.
|
Option |
Description |
|---|---|
|
|
Prometheus endpoint ("prometheus"): URL of the HTTP server exposing the data, |
|
|
Prometheus endpoint: folder with counter-set (.cset) files; when set, only the matching data is exposed |
|
|
Fluent Bit ("fluentbit"): folder with Fluent Bit .exp destination files |
|
|
Open Telemetry ("open_telemetry_exporter"): receiver address. HTTP: base URL |
|
|
Open Telemetry: transport protocol, http (default) or grpc |
|
|
Open Telemetry: value of the service.name resource attribute. Set it to your application's name |
|
|
Open Telemetry: export interval in seconds; 0 (default) exports on every flush |
|
|
Open Telemetry: CA certificate file (PEM) used to verify the receiver; enables TLS |
|
|
Open Telemetry: client certificate chain file (PEM) |
|
|
Open Telemetry: client private key file (PEM) |
|
|
Prometheus remote write ("remote_write_exporter"): receiver URL, e.g. |
|
|
Prometheus remote write: use the remote-write 2.0 protocol (true/false). Default false |
|
|
Prometheus remote write: export interval in seconds; 0 (default) exports on every flush |
|
|
Prometheus remote write: CA certificate file (PEM) used to verify the receiver; enables TLS |
|
|
Prometheus remote write: client certificate chain file (PEM) |
|
|
Prometheus remote write: client private key file (PEM) |
An exporter is configured by its connection option and enabled with doca_telemetry_exporter_schema_set_exporter_enabled() using the name shown in parentheses. Unknown option keys are accepted and ignored.
DOCA Telemetry Exporter Source Report
The source report function is the heart of communication with the DTS. The report operation causes event data to be allocated to the internal buffer. Once the buffer is full, data is forwarded onward according to the set configuration.
doca_error_t doca_telemetry_exporter_source_report(struct doca_telemetry_exporter_source *doca_source,
                                          doca_telemetry_exporter_type_index_t index,
                                          const void *data,
                                          int count);
-
doca_source [in]– a pointer to thedoca_telemetry_exporter_sourcewhich reports the event -
index [in]– the event type index received when the schema was created -
data [in]– a pointer to the data buffer that needs to be sent -
count [in]– numbers of events to be written to the internal buffer
The function returns DOCA_SUCCESS if successful, or a doca_error_t if an error occurs. If a memory-related error occurs, try a larger buffer size that matches the event's size.
DOCA Telemetry Exporter Sleep
The sleep function is a deadline-based sleep that lets the library own the cadence of the application's sample loop.
doca_error_t doca_telemetry_exporter_sleep(struct doca_telemetry_exporter_source *doca_source,
                                           uint64_t period_us);
-
doca_source [in]– a started doca_telemetry_exporter_source that owns the loop -
period_us [in]– the application's sample period in microseconds.
The function sleeps for a period computed by the DOCA Telemetry Exporter library:
-
period_usby default -
a high frequency rate in case an ad-hoc request comes from DTS. See DOCA Telemetry Exporter Dual-Rate Sampling (HFT/LFT) for details.
The recommended loop is described in DOCA Telemetry Exporter Sample Loop Walkthrough.
The function returns:
-
DOCA_SUCCESSif successful -
DOCA_ERROR_INVALID_VALUEif doca_source isNULL -
DOCA_ERROR_BAD_STATEif the source was not started.
The function is DOCA_EXPERIMENTAL.
It is not a replacement for applications paced by epoll or external triggers.
DOCA Telemetry Exporter Dual-Rate Sampling (HFT/LFT)
An application that paces its loop with doca_telemetry_exporter_sleep() can be switched by DTS to a high-frequency sampling period at runtime, and back, without any change in the application.
Note: the IPC exporter to DTS is required for this mode.
DTS should run with an HTTP endpoint. Ensure DTS is running with the enable-http-api=true option in dts_config.ini.
The two rates are:
-
LFT (low-frequency telemetry) – the application's configured period, passed to
doca_telemetry_exporter_sleep(). This is the only rate while dual-rate is off. -
HFT (high-frequency telemetry) – a shorter period requested by DTS for a limited time.
While HFT is active, doca_telemetry_exporter_sleep() returns at the HFT period, so the application samples and flushes faster. The library forwards the full-rate data to the HFT exporters requested in the command. At the same time, the reduced stream is sent to DTS over IPC at the LFT period, so the regular pipeline is not flooded. When the session duration expires, or DTS disables HFT, the loop reverts to the LFT period.
Example implementation may be found in the telemetry_export_metrics_hft_lft DOCA sample (telemetry_export_metrics_hft_lft_sample.c).
Remote HFT activation
Dual-rate is enabled only by sending a command addressed to the source tag associated with the client application. To find the list of connected apps in DTS send the following request:
curl -sS http://<dts-host>:9117/management/ipc/clients # attached apps and their tags
To enable HFT for a relevant client, e.g., with tag “doca_hft_metrics”, send the following HTTP request to DTS:
curl -sS -X POST "http://<dts-host>:9117/management/cmd" \
  -H 'Content-Type: application/json' \
  -d '{"ipc_command": {
         "target_tag": "doca_hft_metrics",
         "command": {"hft": {"enable": true, "mode": "session", "duration_ms": 30000,
                             "period_us": 10000, "data_root": "/absolute/path/to/hft/data",
                             "exporters": ["file"]}}}}'
Configurable parameters:
-
target_tag– source tag of the application. -
enable- set totrueto enable HFT orfalseto disable it. -
mode[optional] - when set to “session”, runs forduration_ms, then stops by itself. If not set, it will run until an explicit disable HTTP request. -
period_us– HFT sampling period in microseconds, followed bydoca_telemetry_exporter_sleep()while enabled. -
duration_ms– in sessionmode, sets session duration in ms after which the loop reverts to LFT. Required in session mode (> 0); ignored otherwise. -
data_root- absolute path to store full-rate HFT data. -
exporters- exporters that receive the full-rate HFT data: "file" (default), "prometheus", "fluentbit", "open-telemetry", "remote-write". IPC is not among them: DTS always receives the LFT stream.
To send a disable HTTP request:
curl -sS -X POST "http://<dts-host>:9117/management/cmd" \
  -H 'Content-Type: application/json' \
  -d '{"ipc_command": {"target_tag": "doca_hft_metrics",
                       "command": {"hft": {"enable": false}}}}'
Checking the result of a command
The reply to a command contains its "id" and either the result or "status": "pending" when the application has not answered yet. In the latter case, fetch the result by id:
curl -sS "http://<dts-host>:9117/management/cmd?id=<id>"
A completed result is returned once.
DOCA Telemetry Exporter Schema Add Type
This function allows adding a reusable telemetry data struct, also known as a schema. The schema allows sending a predefined data structure to the telemetry service. Note that it is mandatory to define a schema for proper functionality of the library. After adding the schemas, one needs to invoke the schema start function.
doca_error_t doca_telemetry_exporter_schema_add_type(struct doca_telemetry_exporter_schema *doca_schema,
                                            const char *new_type_name,
                                            struct doca_telemetry_exporter_type *type,
                                            doca_telemetry_exporter_type_index_t *type_index);
-
doca_schema [in]– a pointer to the schema to which the type is added -
new_type_name [in]– name of the new type -
fields [in]– user-defined fields to be used for the schema. Multiple fields can (and should) be added. -
type_index [out]– type index for the created type is written to this output variable
The function returns DOCA_SUCCESS if successful, or doca_error_t if an error occurs.
DOCA Telemetry Exporter Metrics
The Metrics API provides functions for programmatic metrics collection and export. These functions are used in conjunction with the core DOCA Telemetry Exporter API to report performance metrics.
Return Values:
All functions return doca_error_t with DOCA_SUCCESS on success or error codes on failure. Common error codes include:
-
DOCA_ERROR_INVALID_VALUE– NULL parameters or invalid arguments. -
DOCA_ERROR_NO_MEMORY– Memory allocation failure.
See doca_telemetry_exporter.h for detailed function signatures and parameters.
The Metrics API functions are organized into the following five categories:
DOCA Telemetry Exporter Metrics Context Management
These functions manage the lifecycle and state of the metrics context.
|
Function Name |
Description |
|---|---|
|
|
Creates and initializes the metrics context. |
|
|
Destroys the metrics context and frees resources. |
|
|
Flushes remaining buffered metrics to exporters. |
DOCA Telemetry Exporter Metrics Configuration
These functions configure the behavior of the metrics collection, including flushing and labeling.
|
Function Name |
Description |
|---|---|
|
|
Sets periodic automatic flush interval in milliseconds. |
|
|
Sets minimum time between samples per time series. |
|
|
Adds a constant label to all metrics reported by the source. |
|
|
Defines a label set (list of label names) and returns its ID. |
DOCA Telemetry Exporter Metrics Counters
Functions for reporting monotonically increasing values.
|
Function Name |
Description |
|---|---|
|
|
Reports a counter with an absolute value. |
|
|
Increments a counter by a specified value. |
DOCA Telemetry Exporter Metrics Gauges
Functions for reporting values that can arbitrarily increase or decrease.
|
Function Name |
Description |
|---|---|
|
|
Reports a gauge with a |
|
|
Reports a gauge with a |
DOCA Telemetry Exporter Metrics Histograms
Functions for creating, observing, and managing histograms.
|
Function Name |
Description |
|---|---|
|
|
Creates a histogram instance with specific label values. |
|
|
Creates a base histogram template for use with multiple label sets. |
|
|
Records a value in a specific histogram instance. |
|
|
Records a value in a base histogram using specific label values. |
|
|
Flushes data for a specific histogram immediately. |
|
|
Removes a histogram instance from the context. |
|
|
Sets the flush interval target for a specific histogram. |
DOCA Telemetry Exporter Logs
The Logs API provides functions for programmatic log record collection and export using the OpenTelemetry Protocol (OTLP).
These functions are used together with the core DOCA Telemetry Exporter API to report structured log events.
Return Values
All functions return doca_error_t with DOCA_SUCCESS on success or an error code on failure.
Common error codes:
-
DOCA_ERROR_INVALID_VALUE– Invalid arguments or NULL parameters -
DOCA_ERROR_NO_MEMORY– Memory allocation failure -
DOCA_ERROR_BAD_STATE– Invalid context or state
See doca_telemetry_exporter.h for full API definitions.
DOCA Telemetry Exporter Logs Context Management
Functions for managing the lifecycle of the OTLP logs context.
|
Function Name |
Description |
|---|---|
|
|
Creates and initializes the OTLP logs context. |
|
|
Destroys the logs context and frees resources. |
|
|
Flushes buffered log records to the exporter. |
DOCA Telemetry Exporter Logs Resource Management
Functions for defining log resources and their attributes.
|
Function Name |
Description |
|---|---|
|
|
Adds a new resource and returns its ID. |
|
|
Adds a string attribute to a resource. |
|
|
Adds an integer attribute to a resource. |
|
|
Adds a double attribute to a resource. |
|
|
Adds a Boolean attribute to a resource. |
DOCA Telemetry Exporter Logs Scope Management
Functions for defining log scopes and schemas.
|
Function Name |
Description |
|---|---|
|
|
Adds a scope with predefined attribute schema and returns its ID. |
DOCA Telemetry Exporter Logs Event Writing
Functions for emitting log events.
|
Function Name |
Description |
|---|---|
|
|
Writes a log event using the scope default severity. |
|
|
Writes a log event with explicit severity. |
DOCA Telemetry Exporter Logs Data Types
|
Type Name |
Description |
|---|---|
|
|
Resource identifier type. |
|
|
Scope identifier type. |
|
|
Attribute type enum. |
|
|
Union holding attribute values. |
|
|
Invalid ID constant. |
Telemetry Event Data Format
The internal data format consists of 2 parts: A schema containing metadata, and the actual binary data. When data is written to storage, the data schema is written in JSON format, and the data is written as binary files. In the case of IPC transport, both schema and binary data are sent to DTS. In the case of export, data is converted to the formats required by exporter.
Adding custom event types to the schema can be done using doca_telemetry_exporter_schema_add_type API call.
See available DOCA_TELEMETRY_EXPORTER_FIELD_TYPEs in doca_telemetry_exporter.h. See example of usage in /opt/mellanox/doca/samples/doca_telemetry_exporter/telemetry_export/telemetry_export_sample.c.
It is highly recommended to have the timestamp field as the first field since it is required by most databases. To get the current timestamp in the correct format use:
doca_error_t doca_telemetry_exporter_get_timestamp(doca_telemetry_exporter_timestamp_t *timestamp);
Data Outputs
This section describes available exporters.
-
IPC
-
NetFlow
-
Fluent Bit
-
Prometheus Endpoint
-
Prometheus Remote-Write
-
Open Telemetry
Exporters are presented in both API and DTS. Even though DTS can receive data via IPC and export all client applications data, the API has the same possibilities for development flexibility.
Inter-process Communication
IPC transport automatically transfers the data from the telemetry-exporter-based program to DTS service.
It is implemented as a UNIX domain socket (UDS) sockets for short messages and shared memory for data. DTS and the telemetry-exporter-based program must share the same ipc_sockets directory.
When IPC transport is enabled, the data is sent from the DOCA-telemetry-exporter-based application to the DTS process via shared memory.
To enable IPC, use the doca_telemetry_exporter_schema_set_ipc_enabled API function.
To check the IPC status for the current context, use:
doca_error_t doca_telemetry_exporter_check_ipc_status(struct doca_telemetry_exporter_source *doca_source,
                                             doca_telemetry_exporter_ipc_status_t *status)
If IPC is enabled and, for some reason, the connection is lost, it will try to automatically reconnect on every report’s function call.
IPC is also the channel through which DTS controls the sampling rate of applications that pace their loop with doca_telemetry_exporter_sleep().
See DOCA Telemetry Exporter Dual-Rate Sampling (HFT/LFT).
Using IPC with Non-containerized Application
When developing or testing a DOCA Telemetry Exporter-based program that runs natively (outside a container), specific configurations are required to allow IPC with the containerized DTS.
To enable this interaction, the DTS container must be configured to use the host's IPC namespace rather than an isolated shared memory volume.
Docker Deployment (Command Line)
When deploying DTS via the docker command, ensure the container uses the host's IPC namespace.
-
Recommended method: Use the
--ipc=hostflag. -
Alternative method: Explicitly mount the host's shared memory directory:
-v /dev/shm:/dev/shm
Do not mount non-standard shared memory folders if you intend to use the default system paths.
Kubernetes/Pod Deployment (YAML)
When deploying DTS via a YAML configuration (e.g., on the DPU), you must enable hostIPC and remove any specific volumeMounts that isolate shared memory (such as telemetry-ipc-shm).
Configuration Comparison
-
Before change (default Isolated Mode):
spec: hostNetwork: true volumes: - name: telemetry-service-config hostPath: path: /opt/mellanox/doca/services/telemetry/config type: DirectoryOrCreate # [REMOVE] The following volume isolates shared memory - name: telemetry-ipc-shm hostPath: path: /dev/shm/telemetry type: DirectoryOrCreate containers: volumeMounts: - name: telemetry-service-config mountPath: /config # [REMOVE] The following mount point - name: telemetry-ipc-shm mountPath: /dev/shm -
After change (Host IPC Enabled):
spec:
  hostNetwork: true
  hostIPC: true  # [ADD] Enable Host IPC
  volumes:
  - name: telemetry-service-config
    hostPath:
      path: /opt/mellanox/doca/services/telemetry/config
      type: DirectoryOrCreate
  containers:
      volumeMounts:
      - name: telemetry-service-config
        mountPath: /config
When developing and testing a non-container DOCA Telemetry-Exporter-based program and its IPC interaction with DTS, some modifications are necessary in DTS's deployment for the program to interact with DTS over IPC:
-
Shared memory mapping should be removed:
telemetry-ipc-shm -
Host IPC should be enabled:
hostIPC
Host case (docker command)
In case of docker command make sure that DTS uses:
--ipc=host
and does not mount non-standard shared memory folder.
In addition user can directly specify to mount /dev/shm in docker command for DTS:
-v /dev/shm:/dev/shm
DPU case (yaml)
File before the change:
spec:
  hostNetwork: true
  volumes:
  - name: telemetry-service-config
    hostPath:
      path: /opt/mellanox/doca/services/telemetry/config
      type: DirectoryOrCreate
  ...
  - name: telemetry-ipc-shm
    hostPath:
      path: /dev/shm/telemetry
      type: DirectoryOrCreate
  containers:
  ...
      volumeMounts:
      - name: telemetry-service-config
        mountPath: /config
  ...
      - name: telemetry-ipc-shm
        mountPath: /dev/shm
File after the change:
spec:
  hostNetwork: true
  hostIPC: true
  volumes:
  - name: telemetry-service-config
    hostPath:
      path: /opt/mellanox/doca/services/telemetry/config
      type: DirectoryOrCreate
  ...
  containers:
  ...
      volumeMounts:
      - name: telemetry-service-config
        mountPath: /config
These changes ensure that a DOCA-based program running outside of a container is able to communicate with DTS over IPC.
NetFlow
When the NetFlow exporter is enabled (NetFlow Collector Attributes are set), it sends the NetFlow data to the NetFlow collector specified by the attributes: Address and port. This exporter must be used when using DOCA Telemetry Exporter NetFlow API.
Fluent Bit
Fluent Bit export is based on fluent_bit_configs with .exp files for each destination. Every export file corresponds to one of Fluent Bit's destinations. All found and enabled .exp files are used as separate export destinations. Examples can be found after running DTS container under its configuration folder (/opt/mellanox/doca/services/telemetry/config/fluent_bit_configs/).
All .exp files are documented in-place.
DPU# ls -l /opt/mellanox/doca/services/telemetry/config/fluent_bit_configs/
/opt/mellanox/doca/services/telemetry/config/fluent_bit_configs/:
total 56
-rw-r--r-- 1 root root  528 Oct 11 07:52 es.exp
-rw-r--r-- 1 root root  708 Oct 11 07:52 file.exp
-rw-r--r-- 1 root root 1135 Oct 11 07:52 forward.exp
-rw-r--r-- 1 root root  719 Oct 11 07:52 influx.exp
-rw-r--r-- 1 root root  571 Oct 11 07:52 stdout.exp
-rw-r--r-- 1 root root  578 Oct 11 07:52 stdout_raw.exp
-rw-r--r-- 1 root root 2137 Oct 11 07:52 ufm_enterprise.fset
Fluent Bit .exp files have 2-level data routing:
-
source_tagsin.expfiles (documented in-place) -
Token-based filtering governed by
.fsetfiles (documented inufm_enterprise.fset)
To run with Fluent Bit exporter, set enable=1 in required .exp files and call the setters before starting the schema:
doca_telemetry_exporter_schema_set_exporter_option(doca_schema, "fluentbit-config-dir", "/path/to/fluent_bit_configs");
doca_telemetry_exporter_schema_set_exporter_enabled(doca_schema, "fluentbit");
Deprecated export setter:
The DOCA versions less than 3.6 set exporters only via environment variables before running your application:
export FLUENT_BIT_EXPORT_ENABLE=1
export FLUENT_BIT_CONFIG_DIR=/path/to/fluent_bit_configs
export LD_LIBRARY_PATH=/opt/mellanox/collectx/lib
Prometheus Endpoint
Prometheus exporter sets up an endpoint (HTTP server) that keeps the most recent events data as text records.
The Prometheus server can scrape the data from the endpoint while the DOCA-Telemetry-Exporter-API-based application stays active.
Check the generic example of Prometheus records:
event_name_1{label_1="label_1_val", label_2="label_2_val", label_3="label_3_val", label_4="label_4_val"} counter_value_1 timestamp_1
event_name_2{label_1="label_1_val", label_2="label_2_val", label_3="label_3_val", label_4="label_4_val"} counter_value_2 timestamp_2
...
Labels are customizable metadata that can be set from the data file. Event names could be filtered by token-based name-match according to .fset files.
To run with the Prometheus exporter, call the setters before starting the schema:
doca_telemetry_exporter_schema_set_exporter_option(doca_schema, "prometheus-endpoint", "http://0.0.0.0:9101");
doca_telemetry_exporter_schema_set_exporter_option(doca_schema, "prometheus-cset-dir", "/path/to/prometheus_cset"); /* optional */
doca_telemetry_exporter_schema_set_exporter_enabled(doca_schema, "prometheus");
To scrape the data without the Prometheus server, use:
curl -s http://0.0.0.0:9101/metrics
Or:
curl -s http://0.0.0.0:9101/{fset_name}
Deprecated export setter:
The DOCA versions less than 3.6 set exporters only via environment variables before running your application:
# Set the endpoint host and port to enable export.
export PROMETHEUS_ENDPOINT=http://0.0.0.0:9101

# Set the folder that contains fset-files. If set, Prometheus will scrape
# only filtered data according to fieldsets.
export PROMETHEUS_CSET_DIR=/path/to/prometheus_cset
Prometheus Remote Write
The Prometheus remote write exporter sends time-series metrics to a remote Prometheus receiver using the Prometheus remote-write protocol.
To use the Prometheus Remote-Write exporter, set the exporter options:
doca_telemetry_exporter_schema_set_exporter_option(doca_schema, "remote-write-receiver", "http://$IP:$PORT/api/v1/write");
doca_telemetry_exporter_schema_set_exporter_enabled(doca_schema, "remote_write_exporter");
Deprecated export setter:
The DOCA versions less than 3.6 set exporters only via environment variables before running your application:
export CLX_REMOTE_WRITE_RECEIVER=http://$IP:$PORT/api/v1/write # set the IP and PORT with the receiver address
Replace $IP and $PORT with the receiver's IP address and port (the Prometheus server default is 9090).
Open Telemetry
The OpenTelemetry exporter streams telemetry to a remote OTLP receiver. The supported transport is http or grpc.
To run with OpenTelemetry exporter over HTTP (default), set the receiver base URL; the exporter appends /v1/metrics and /v1/logs itself:
doca_telemetry_exporter_schema_set_exporter_option(doca_schema, "open-telemetry-receiver", "http://$IP:$PORT");
doca_telemetry_exporter_schema_set_exporter_enabled(doca_schema, "open_telemetry_exporter");
Over gRPC:
doca_telemetry_exporter_schema_set_exporter_option(doca_schema, "open-telemetry-receiver", "$IP:$PORT");
doca_telemetry_exporter_schema_set_exporter_option(doca_schema, "open-telemetry-transport", "grpc");
doca_telemetry_exporter_schema_set_exporter_enabled(doca_schema, "open_telemetry_exporter");
Deprecated export setter:
The DOCA versions less than 3.6 set exporters only via environment variables before running your application:
export CLX_OPEN_TELEMETRY_RECEIVER=http://$IP:$PORT/v1/metrics # set the IP and PORT with the receiver address (default port is 9502)
DOCA Telemetry Exporter Samples
This section provides DOCA Telemetry Exporter sample implementations on top of the BlueField DPU.
The telemetry exporter samples in this document demonstrate an initial recommended configuration that covers the following use cases:
-
Standard DOCA Telemetry Exporter data
-
DOCA Telemetry Exporter for NetFlow data
-
Metrics (counters, gauges, histograms), including dual-rate HFT/LFT collection
-
OTLP log records
The telemetry exporter samples run on BlueField. If write-to-file is enabled, telemetry data is stored to BlueField's storage. If inter-process communication (IPC) is enabled, data is sent to the DOCA Telemetry Service (DTS) running on the same BlueField.
For information on initializing and configuring DTS, refer to DOCA Telemetry Service Guide.
All the DOCA samples described in this section are governed under the BSD-3 software license agreement.
Running the Sample
-
Refer to the following documents:
-
DOCA Installation Guide for Linux for details on how to install BlueField-related software.
-
DOCA Troubleshooting for any issue you may encounter with the installation, compilation, or execution of DOCA samples.
-
-
To build a given sample, run the following command. If you downloaded the sample from GitHub, update the path in the first line to reflect the location of the sample file:
cd /opt/mellanox/doca/samples/doca_telemetry_exporter/<sample_name>
meson /tmp/build
ninja -C /tmp/build
The binary
doca_<sample_name>will be created under/tmp/build/. -
Sample (e.g.,
telemetry_export) usage:Usage: doca_telemetry_export [DOCA Flags] DOCA Flags: -h, --help Print a help synopsis -v, --version Print program version information -l, --log-level Set the (numeric) log level for the program <10=DISABLE, 20=CRITICAL, 30=ERROR, 40=WARNING, 50=INFO, 60=DEBUG, 70=TRACE> --sdk-log-level Set the SDK (numeric) log level for the program <10=DISABLE, 20=CRITICAL, 30=ERROR, 40=WARNING, 50=INFO, 60=DEBUG, 70=TRACE> -j, --json <path> Parse command line flags from an input json file -
For additional information per sample, use the
-hoption:Bash/tmp/build/doca_<sample_name> -h
Samples
These samples are also available on GitHub.
Telemetry Export
This sample illustrates how to use the telemetry exporter API. The sample uses a custom schema for telemetry exporter.
The sample logic includes:
-
Configuring schema attributes.
-
Initializing schema.
-
Creating telemetry exporter source.
-
Creating example events.
-
Reporting example events via DOCA Telemetry Exporter.
-
Destroying source and schema.
Reference:
-
/opt/mellanox/doca/samples/doca_telemetry_exporter/telemetry_export/telemetry_export_sample.c -
/opt/mellanox/doca/samples/doca_telemetry_exporter/telemetry_export/telemetry_export_main.c -
/opt/mellanox/doca/samples/doca_telemetry_exporter/telemetry_export/meson.build
Telemetry Export NetFlow
This sample illustrates how to use the NetFlow functionality of the telemetry exporter API.
The sample logic includes:
-
Configuring NetFlow attributes.
-
Initializing NetFlow.
-
Creating telemetry exporter source.
-
Starting NetFlow.
-
Creating example events.
-
Reporting example events via DOCA Telemetry Exporter.
-
Destroying NetFlow.
Reference:
-
/opt/mellanox/doca/samples/doca_telemetry_exporter/telemetry_export_netflow/telemetry_export_netflow_sample.c -
/opt/mellanox/doca/samples/doca_telemetry_exporter/telemetry_export_netflow/telemetry_export_netflow_main.c -
/opt/mellanox/doca/samples/doca_telemetry_exporter/telemetry_export_netflow/meson.build
Telemetry Export Metrics
This sample illustrates how to use the Metrics API of the telemetry exporter to collect and export performance metrics (counters, gauges) with multi-dimensional labels.
The sample logic includes:
-
Initializing the telemetry exporter schema and source.
-
Creating and configuring the metrics context.
-
Setting flush intervals and adding constant labels.
-
Defining dynamic label sets (e.g., for network interfaces).
-
Reporting counter (absolute and incremental) and gauge metrics.
-
Flushing and destroying the metrics context, source, and schema.
Reference:
-
/opt/mellanox/doca/samples/doca_telemetry_exporter/telemetry_export_metrics/telemetry_export_metrics_sample.c -
/opt/mellanox/doca/samples/doca_telemetry_exporter/telemetry_export_metrics/telemetry_export_metrics_main.c -
/opt/mellanox/doca/samples/doca_telemetry_exporter/telemetry_export_metrics/meson.build
Telemetry Export Metrics HFT/LFT
This sample illustrates dual-rate (high-frequency / low-frequency) metrics collection through the public API. The sample paces its loop with doca_telemetry_exporter_sleep().
HFT is enabled only by a DTS "hft" IPC command (see DOCA Telemetry Exporter Dual-Rate Sampling (HFT/LFT)).
The sample logic includes:
-
Initializing the telemetry exporter schema with IPC enabled and the low-frequency file writer.
-
Configuring the in-application Prometheus endpoint with doca_telemetry_exporter_schema_set_exporter_option("prometheus-endpoint", …) and doca_telemetry_exporter_schema_set_exporter_enabled("prometheus").
-
Creating the source with the stable tag doca_hft_metrics and the metrics context.
-
Looping: reporting metrics, flushing once per iteration, and calling doca_telemetry_exporter_sleep(source, LFT_US).
-
Flushing and destroying the metrics context, source, and schema.
The sample is configured through environment variables:
|
Variable |
Default |
Meaning |
|---|---|---|
|
LFT_US |
1000000 |
Low-frequency period (microseconds) passed to doca_telemetry_exporter_sleep() |
|
IPC_SOCKETS_DIR |
/opt/mellanox/doca/services/telemetry/ipc_sockets |
DTS IPC sockets directory |
|
LFT_DATA_ROOT |
/tmp/doca_lft_data |
File-writer root for the low-frequency data (must be a directory) |
|
APP_PROM_PORT |
9876 |
Port of the sample's Prometheus endpoint (“ |
|
PROMETHEUS_ENDPOINT |
derived from APP_PROM_PORT |
Full endpoint override; when set, APP_PROM_PORT is ignored |
To validate, send the "hft" command through DTS and compare the sample timestamps: the in-application endpoint and the HFT data follow period_us, while the data reaching DTS (and the LFT files) keep the application's own period (LFT_US).
Reference:
-
/opt/mellanox/doca/samples/doca_telemetry_exporter/telemetry_export_metrics_hft_lft/telemetry_export_metrics_hft_lft_sample.c -
/opt/mellanox/doca/samples/doca_telemetry_exporter/telemetry_export_metrics_hft_lft/telemetry_export_metrics_hft_lft_main.c -
/opt/mellanox/doca/samples/doca_telemetry_exporter/telemetry_export_metrics_hft_lft/meson.build
Telemetry Export OTLP Logs
This sample illustrates how to use the OTLP Logs API of the telemetry exporter to collect and export structured log events as OpenTelemetry Protocol (OTLP) log records with resources, scopes, and typed attributes.
The sample logic includes:
-
Initializing the telemetry exporter schema and source.
-
Enabling opaque events (required for OTLP logs).
-
Creating and configuring the OTLP logs context.
-
Creating a resource and adding resource attributes.
-
Defining an event schema with attribute keys and types.
-
Creating a scope (instrumentation library) with default severity.
-
Writing log events with default and explicit severity levels.
-
Flushing and destroying the logs context, source, and schema.
Reference:
-
/opt/mellanox/doca/samples/doca_telemetry_exporter/telemetry_export_otlp_logs/telemetry_export_otlp_logs_sample.c -
/opt/mellanox/doca/samples/doca_telemetry_exporter/telemetry_export_otlp_logs/telemetry_export_otlp_logs_main.c -
/opt/mellanox/doca/samples/doca_telemetry_exporter/telemetry_export_otlp_logs/meson.build
Last updated: