

The Suspected Errors tab reports on APIs that have returned values flagged as potential issues, helping you maintain the reliability and integrity of your data analysis.
The report opens with a summary table showing the number of hosts with errors against the total number of hosts, giving a quick snapshot of the overall health of your data environment. Use it to prioritize troubleshooting and allocate resources.
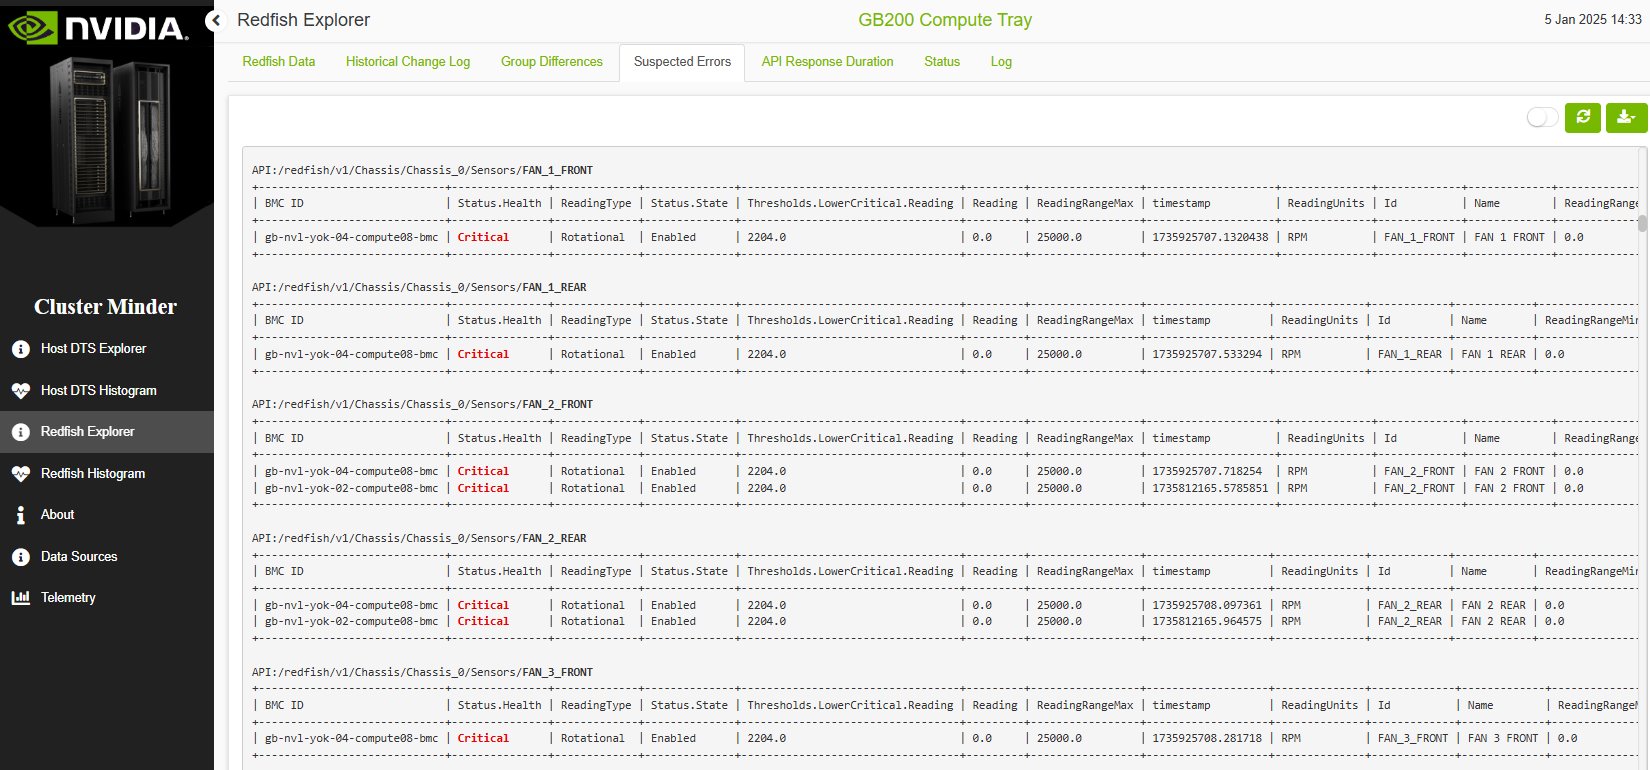
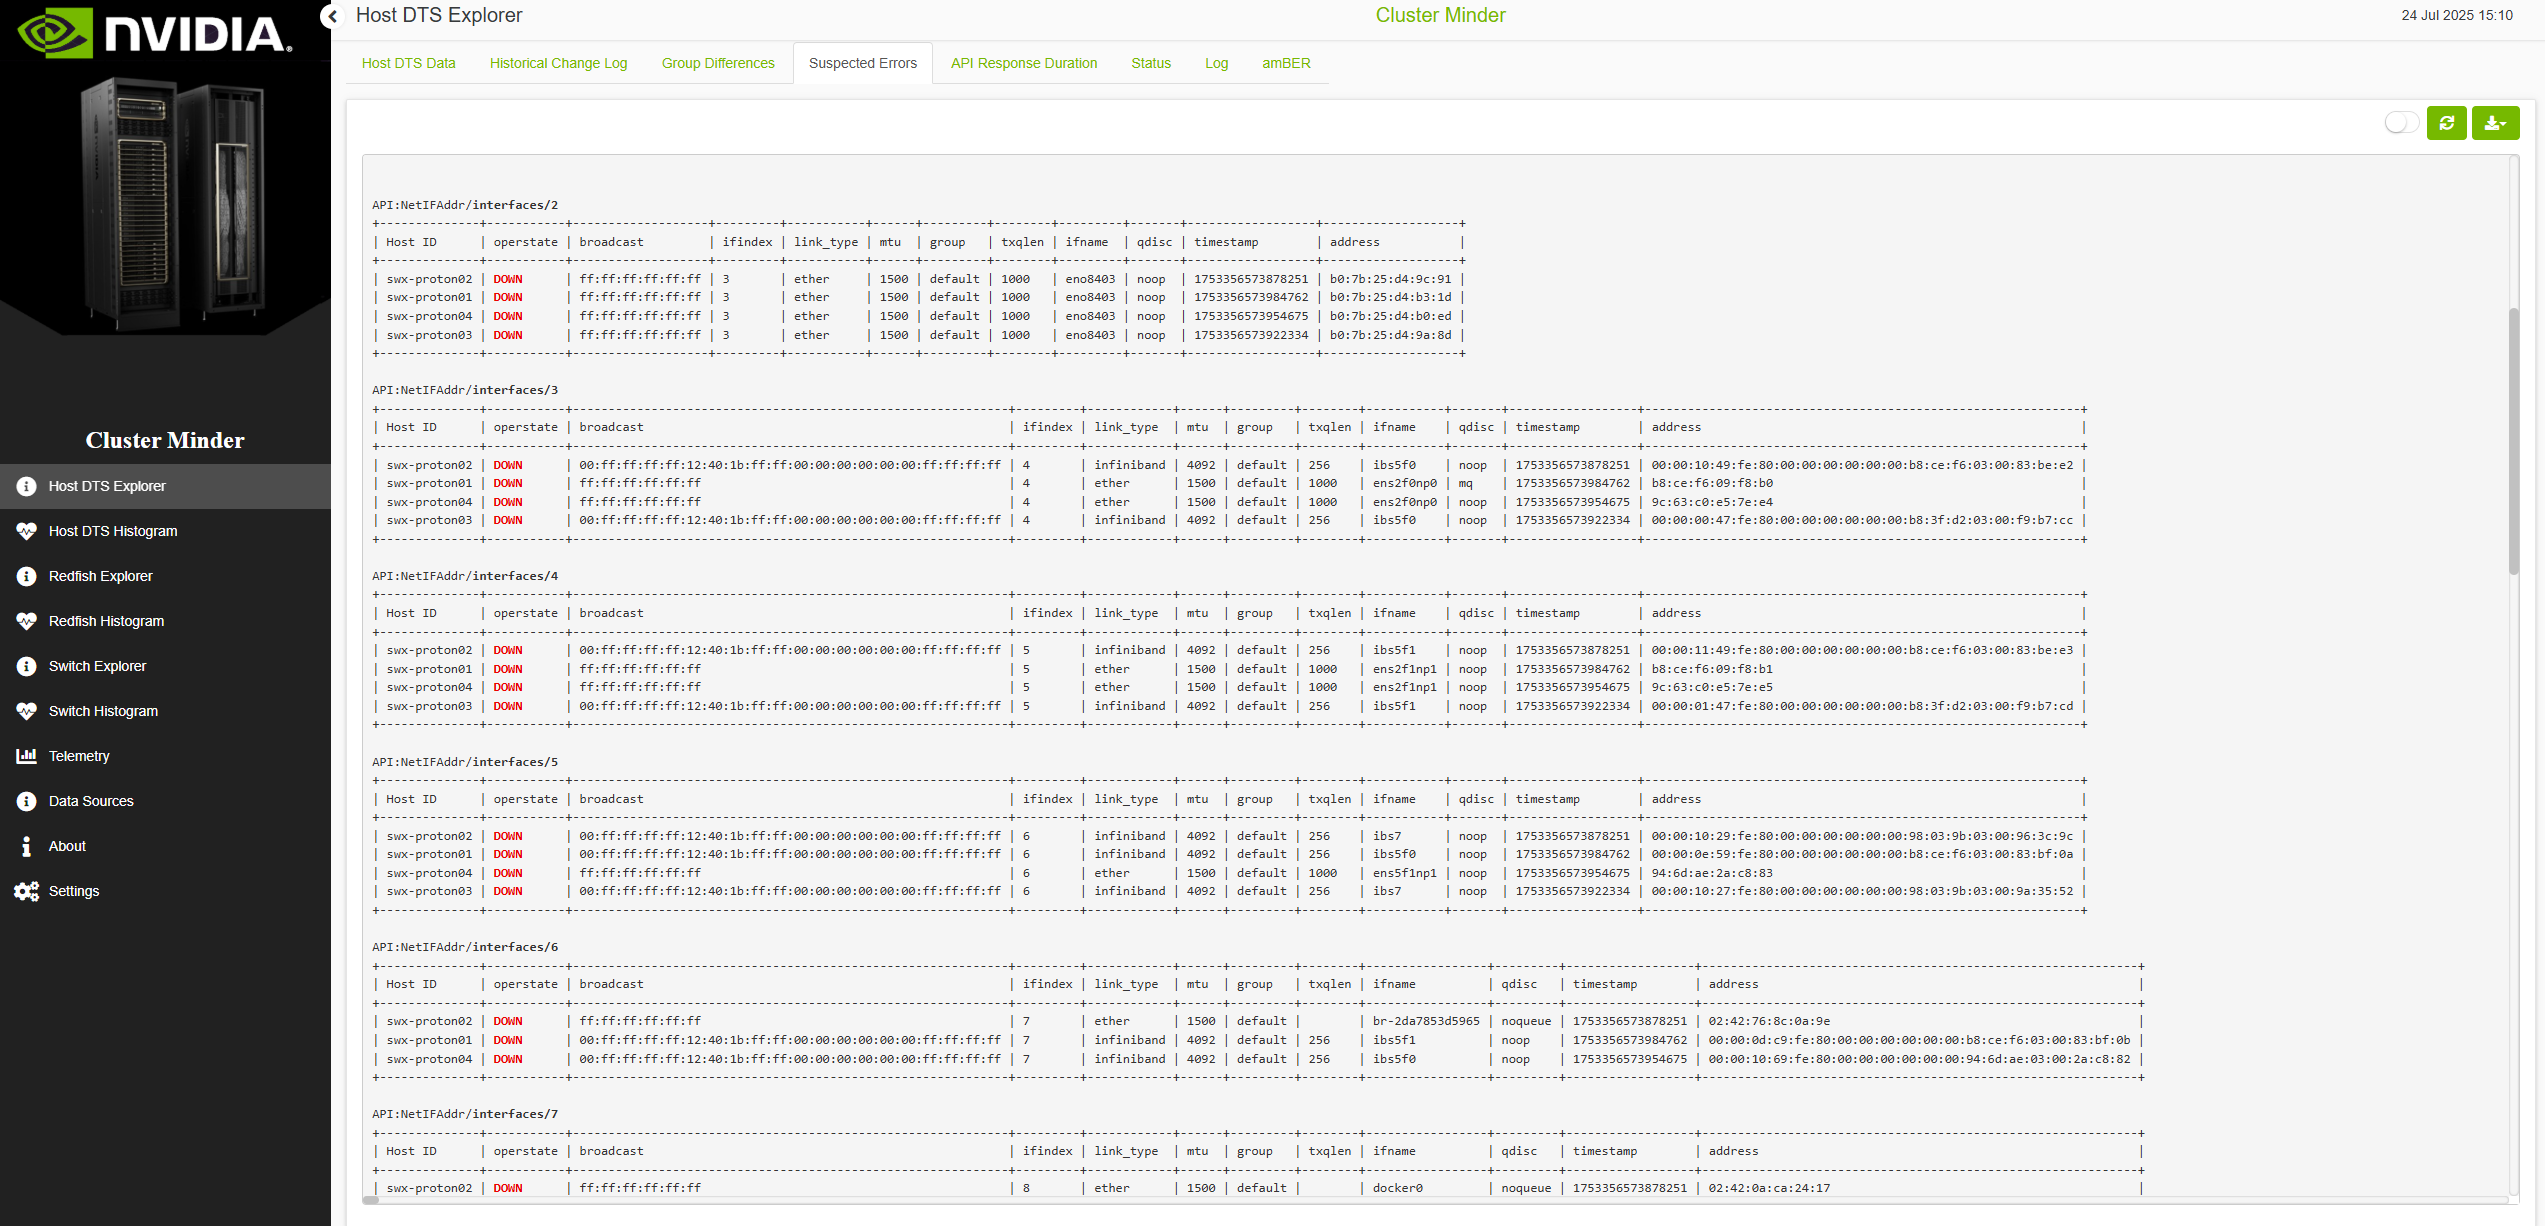
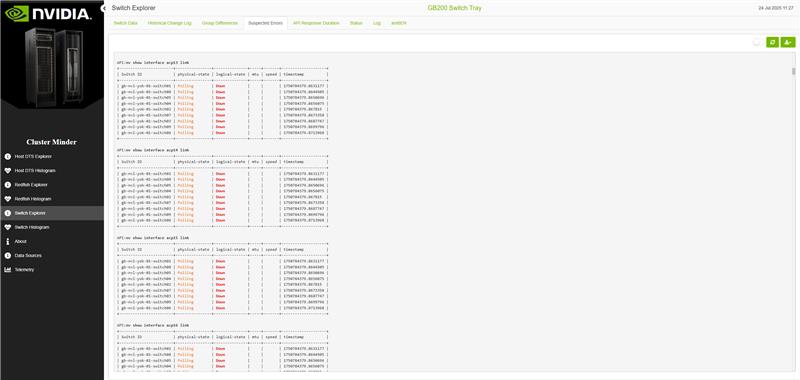
Each entry in the report lists the host ID, the fields where values were problematic, and the problematic values themselves. These values are highlighted by severity: red for more critical problems, orange for less severe ones. The color coding lets you assess the urgency of each issue at a glance and take appropriate corrective action.
Note: Use the switch button to enable component view.
Redfish Suspected Errors Example
Host DTS Suspected Errors Example
Switch Suspected Errors Example
Last updated: