Trends shows your data as line charts, heatmaps, bar charts, and tables. You build a view by choosing a data source, filtering the data, choosing what the chart shows, and selecting measures. Then you save it so you can come back to it, add it to a dashboard, or turn on notifications. You can also ask Sherlock about the chart on screen. See Ask Sherlock About a View.
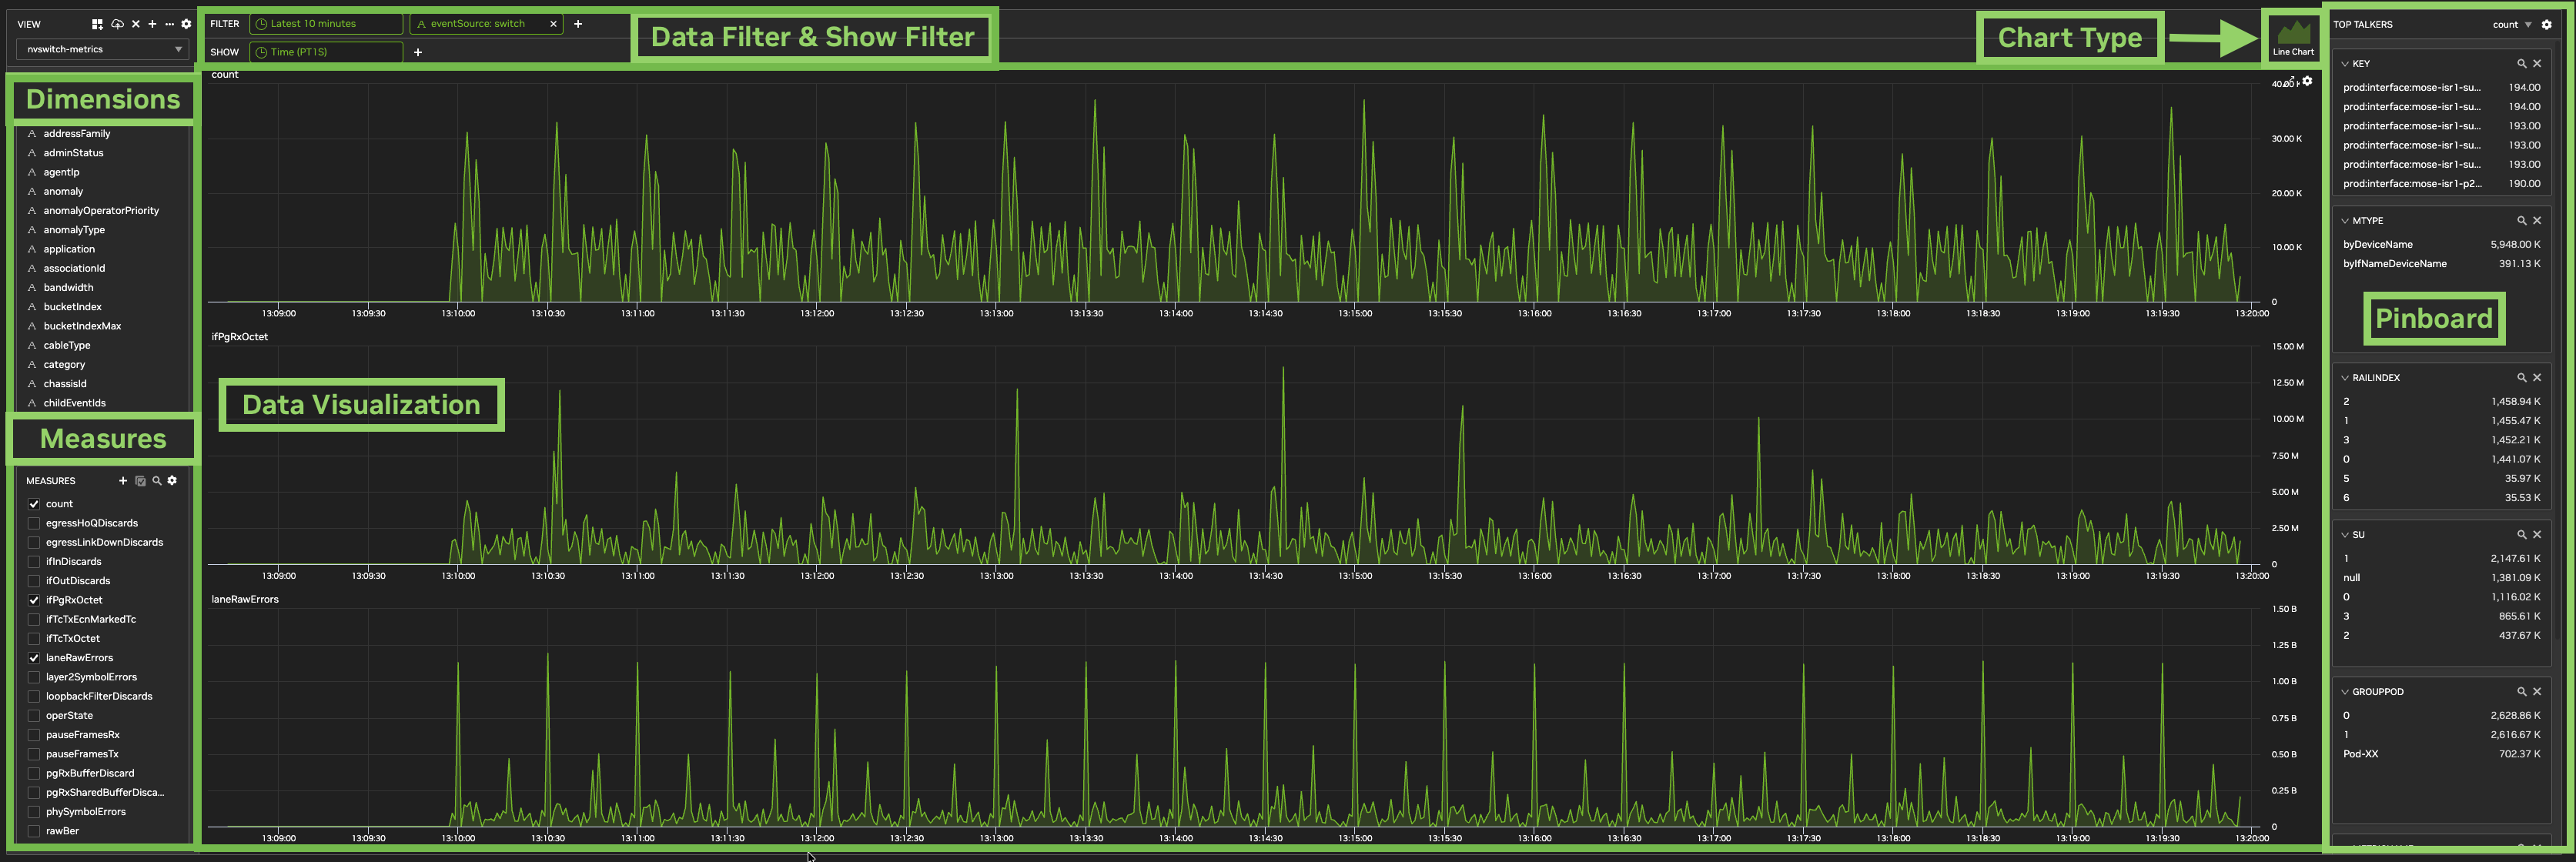
Trends Page Layout
-
View: select a view, and create, save, and manage views. See Manage Views.
-
Filter: the time range and filters that limit the data. See Filter Data.
-
Show: the time granularity and the dimensions the chart is split by. See Choose What the Chart Shows.
-
Chart type: on the right of the Filter and Show rows. Select Line Chart, Heatmap, Bar Chart, or Table. See Chart Types.
-
Dimensions: the dimensions in the view's data. Use them to filter, pin, or add to Show.
-
Measures: the measures in the view's data. Select the ones the chart displays.
-
Top Talkers: the top values of pinned dimensions, ranked by a measure. See Top Talkers.
Admins and Editors can create, change, and save views. Viewers can use views but can't save changes.
Create and Save a View
-
In the View panel, click + (Create). The new view starts as a copy of the current view.
-
Enter a View Name, select the Data Sources, and click OK. The view is private. To make it visible to all users in the tenant, select Publish (visible to all users). View names must be unique.
-
Set the time range and filters, choose what the chart shows, select measures, and select a chart type.
-
Click the Save (cloud) icon in the View panel.
Changes to a view aren't kept until you click Save. Views with a lock icon are locked and can't be saved. To change one, create a copy with +.
A new view starts with notifications turned off. If the original view had notifications on, they're paused in the copy.
Manage Views
The View panel has these controls:
|
Control |
Use it to |
|---|---|
|
View list |
Open a view. A lock icon marks a locked view, and a crossed-out eye marks a private view. |
|
Add to dashboard |
Add the view to a dashboard, as the full view, the current chart, Top Talkers, or a counter. |
|
Save (cloud) |
Save changes to the view. |
|
X |
Remove the view. A view can't be removed while it's on a dashboard. |
|
+ (Create) |
Create a view. |
|
|
Import or Export a view, see its History, or Publish it to all users. |
|
Settings (gear) |
Change the view's settings. See View Settings. |

Filter Data
The Filter row sets the data the view uses:
-
Time range: click the time chip, for example Latest 6 hours, to choose the time range. New views use Latest 6 hours.
-
Filters: click + to filter on a dimension. You can also filter from Dimensions.
A dimension filter can Include or Exclude values, or match a regular expression (Regex). Some dimensions also offer Include All.
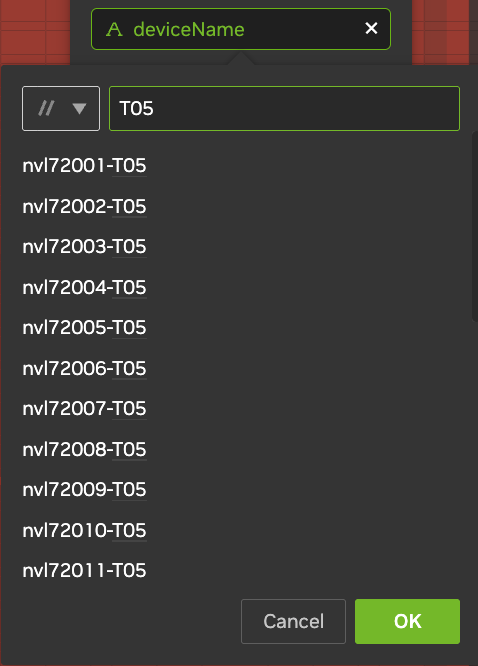
To filter with a regular expression, add the dimension to filter on, for example deviceName, and then:
-
Click the filter to open it.
-
Click the arrow to the left of the search box, and select Regex.
-
Enter the pattern. To add another pattern that must also match, click +.
For example, enter T05 to match every device name that contains T05.
Choose What the Chart Shows
The Show row lists the items the chart is split by.
-
Time granularity: click the Time chip, for example Time (PT5M), and select 1S, 1M, 5M, 1H, 1D, or 1W. To enter another duration, click …. Granularities that are too fine for the time range are unavailable.
-
Dimensions: click + and select a dimension.
What the chart needs in Show depends on the chart type. See Chart Types. The following example shows a line chart before and after adding ifName in Show.


Dimensions
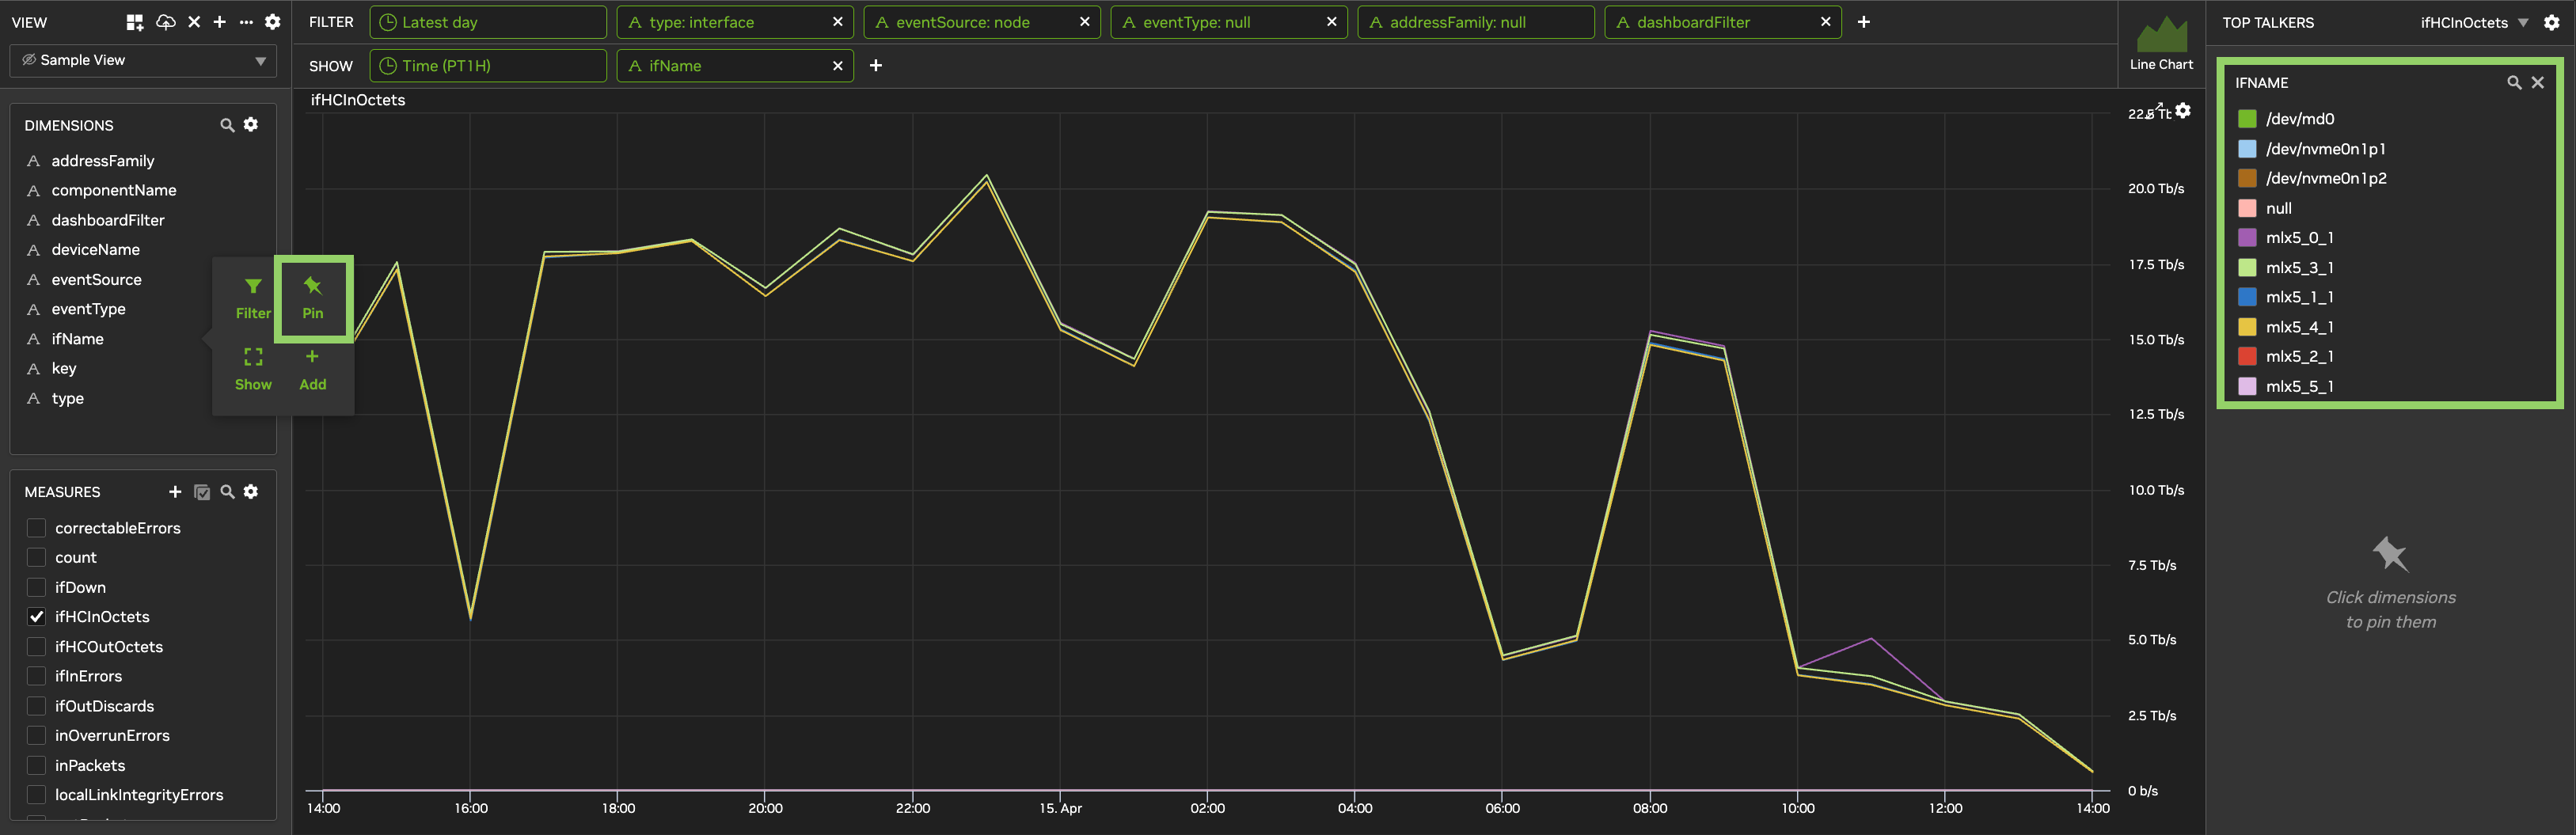
Hover over a dimension in Dimensions to:
-
Filter: add a filter on the dimension.
-
Pin: add it to Top Talkers.
-
Show: show only that dimension, as a table.
-
Add: add it to the Show row.
Measures
Select the measures the chart displays. To search, click the magnifying glass. If a measure isn't listed, click the gear next to Measures and select Show all measures.
To change a measure's settings, hover over it and click Metric settings (gear):
-
Min Limit and Max Limit: thresholds for heatmaps and tables. Before you can turn on notifications for a heatmap or table, set them on every selected measure.
-
Select aggregation type: average, max, or min, for gauge measures.
Derived Metrics
A derived metric is a measure you define from other measures, with arithmetic or an if-expression. Supported operations are +, -, *, /, minof, and maxof. If-expressions take the form if(predicate, thenValue, elseValue), for example if(minof(a) > 0, minof(b)/minof(a), 0).
-
Expressions can use only base measures, not other derived metrics.
-
An if-expression must be the whole expression. Comparison and logical operators work only inside
if(). -
%and^aren't supported.
To create a derived metric:
-
Next to Measures, click + (Create).
-
In Derived Metric Name, enter a name, for example
DiscardPercent. -
In Units, enter the units, for example
%. -
In Expression, enter the expression.
-
Click OK.
The new measure appears in Measures. If it doesn't, refresh the page.
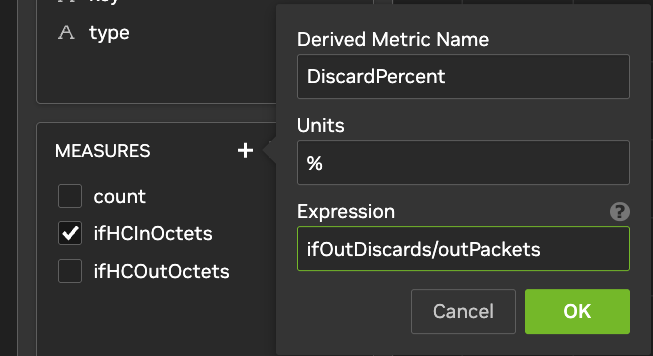
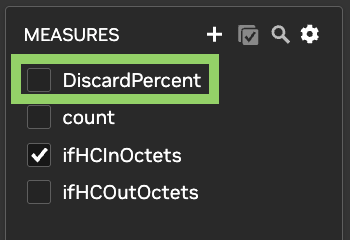
Chart Types
|
Chart type |
What Show needs |
Measures |
|---|---|---|
|
Line Chart |
Time, plus optionally one dimension |
One or more |
|
Heatmap |
Two items, for example two dimensions, or Time and a dimension |
One |
|
Bar Chart |
One or two dimensions, or Time plus up to one dimension |
One, unless Time is in Show |
|
Table |
At least one dimension |
One or more |
If you add a third dimension to a line chart, heatmap, or bar chart, the view switches to a table. If you switch to a heatmap or bar chart, only the first selected measure is kept.
Line Chart
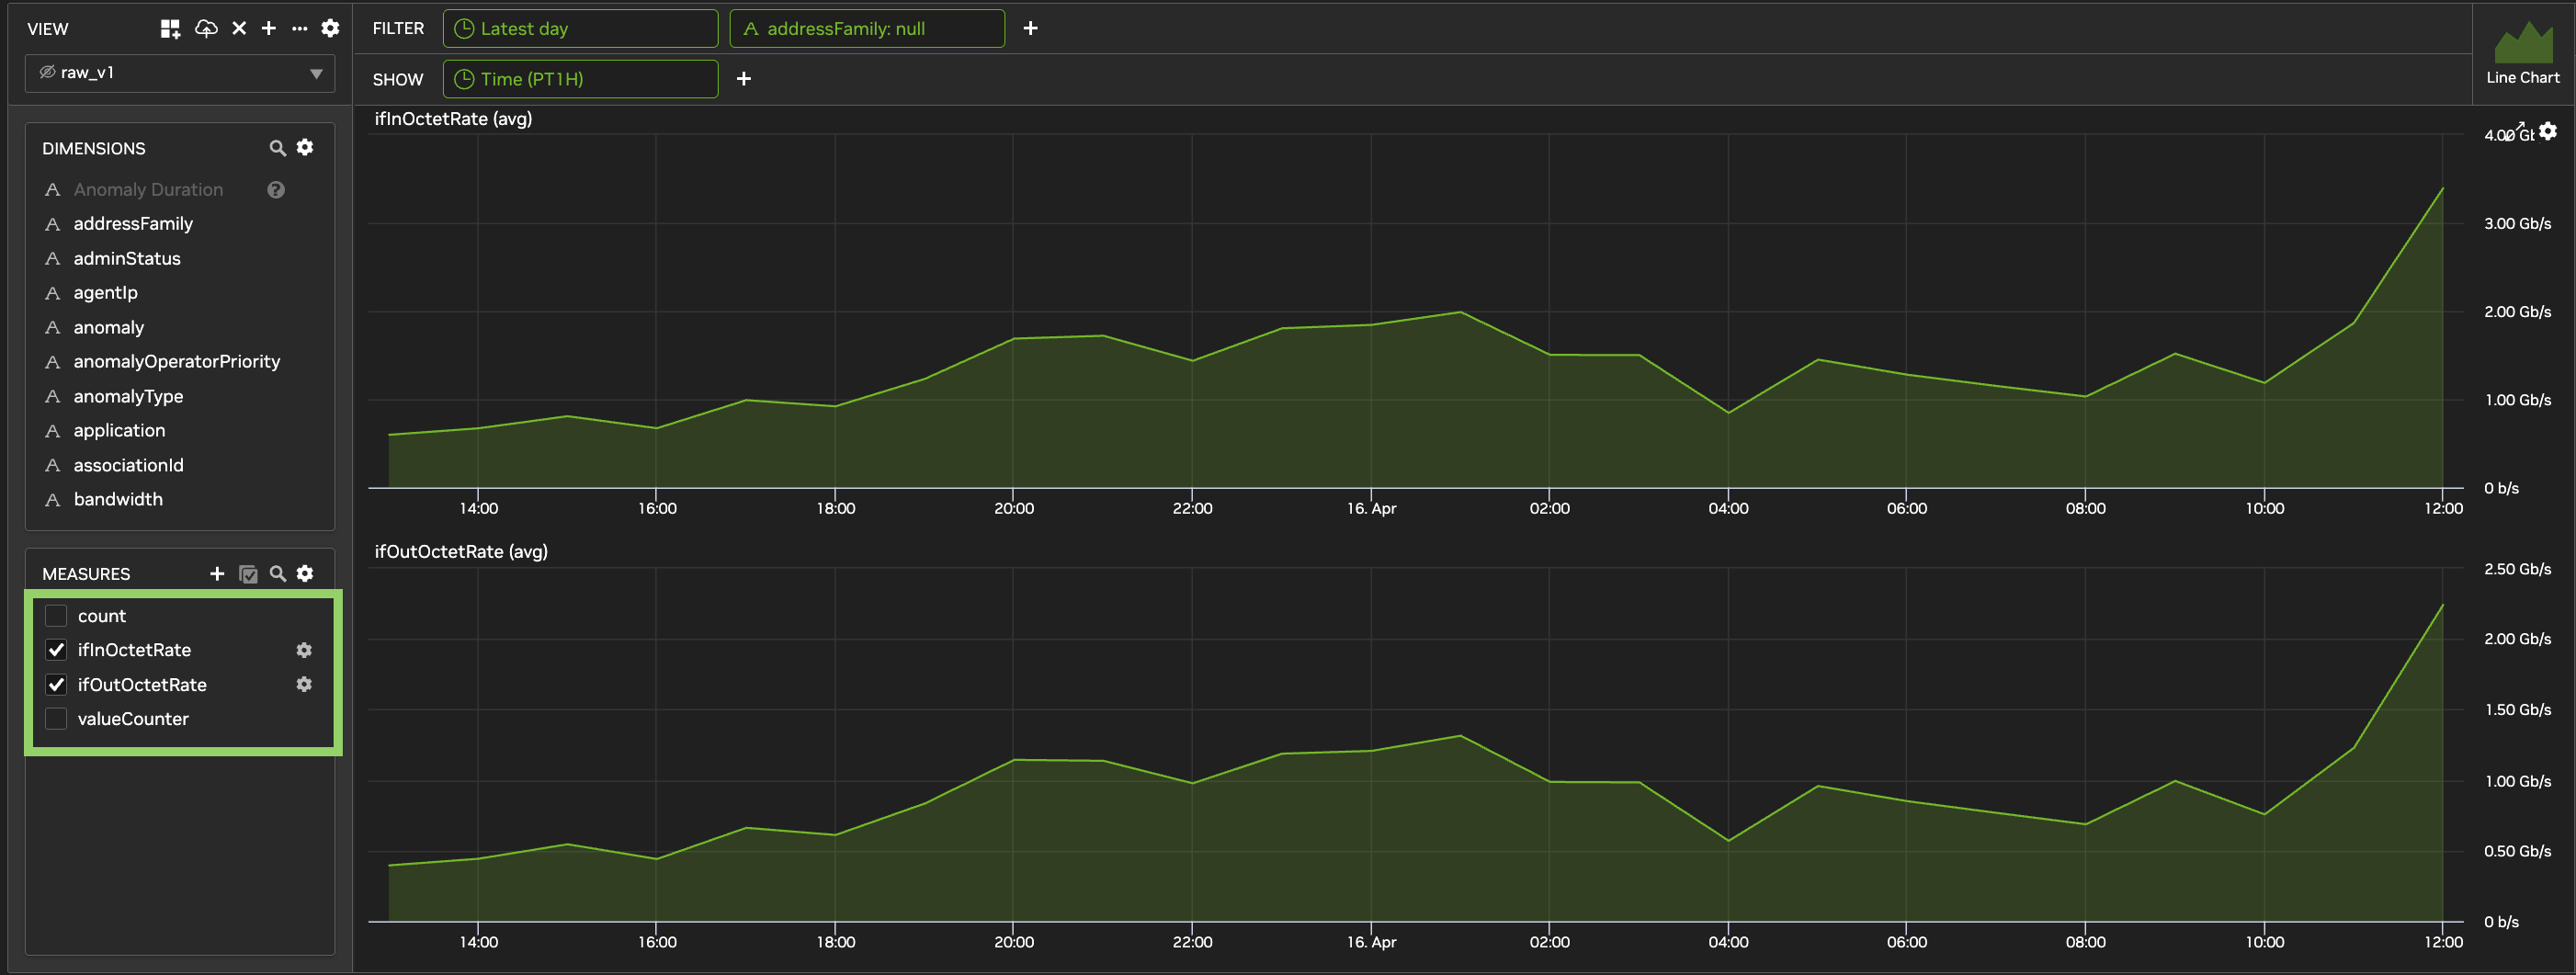
Use a line chart to show data over time. It can show one object, for example the bandwidth of one switch, or an aggregate, for example the bandwidth of all spine switches. Add a dimension in Show to compare its top ten values.
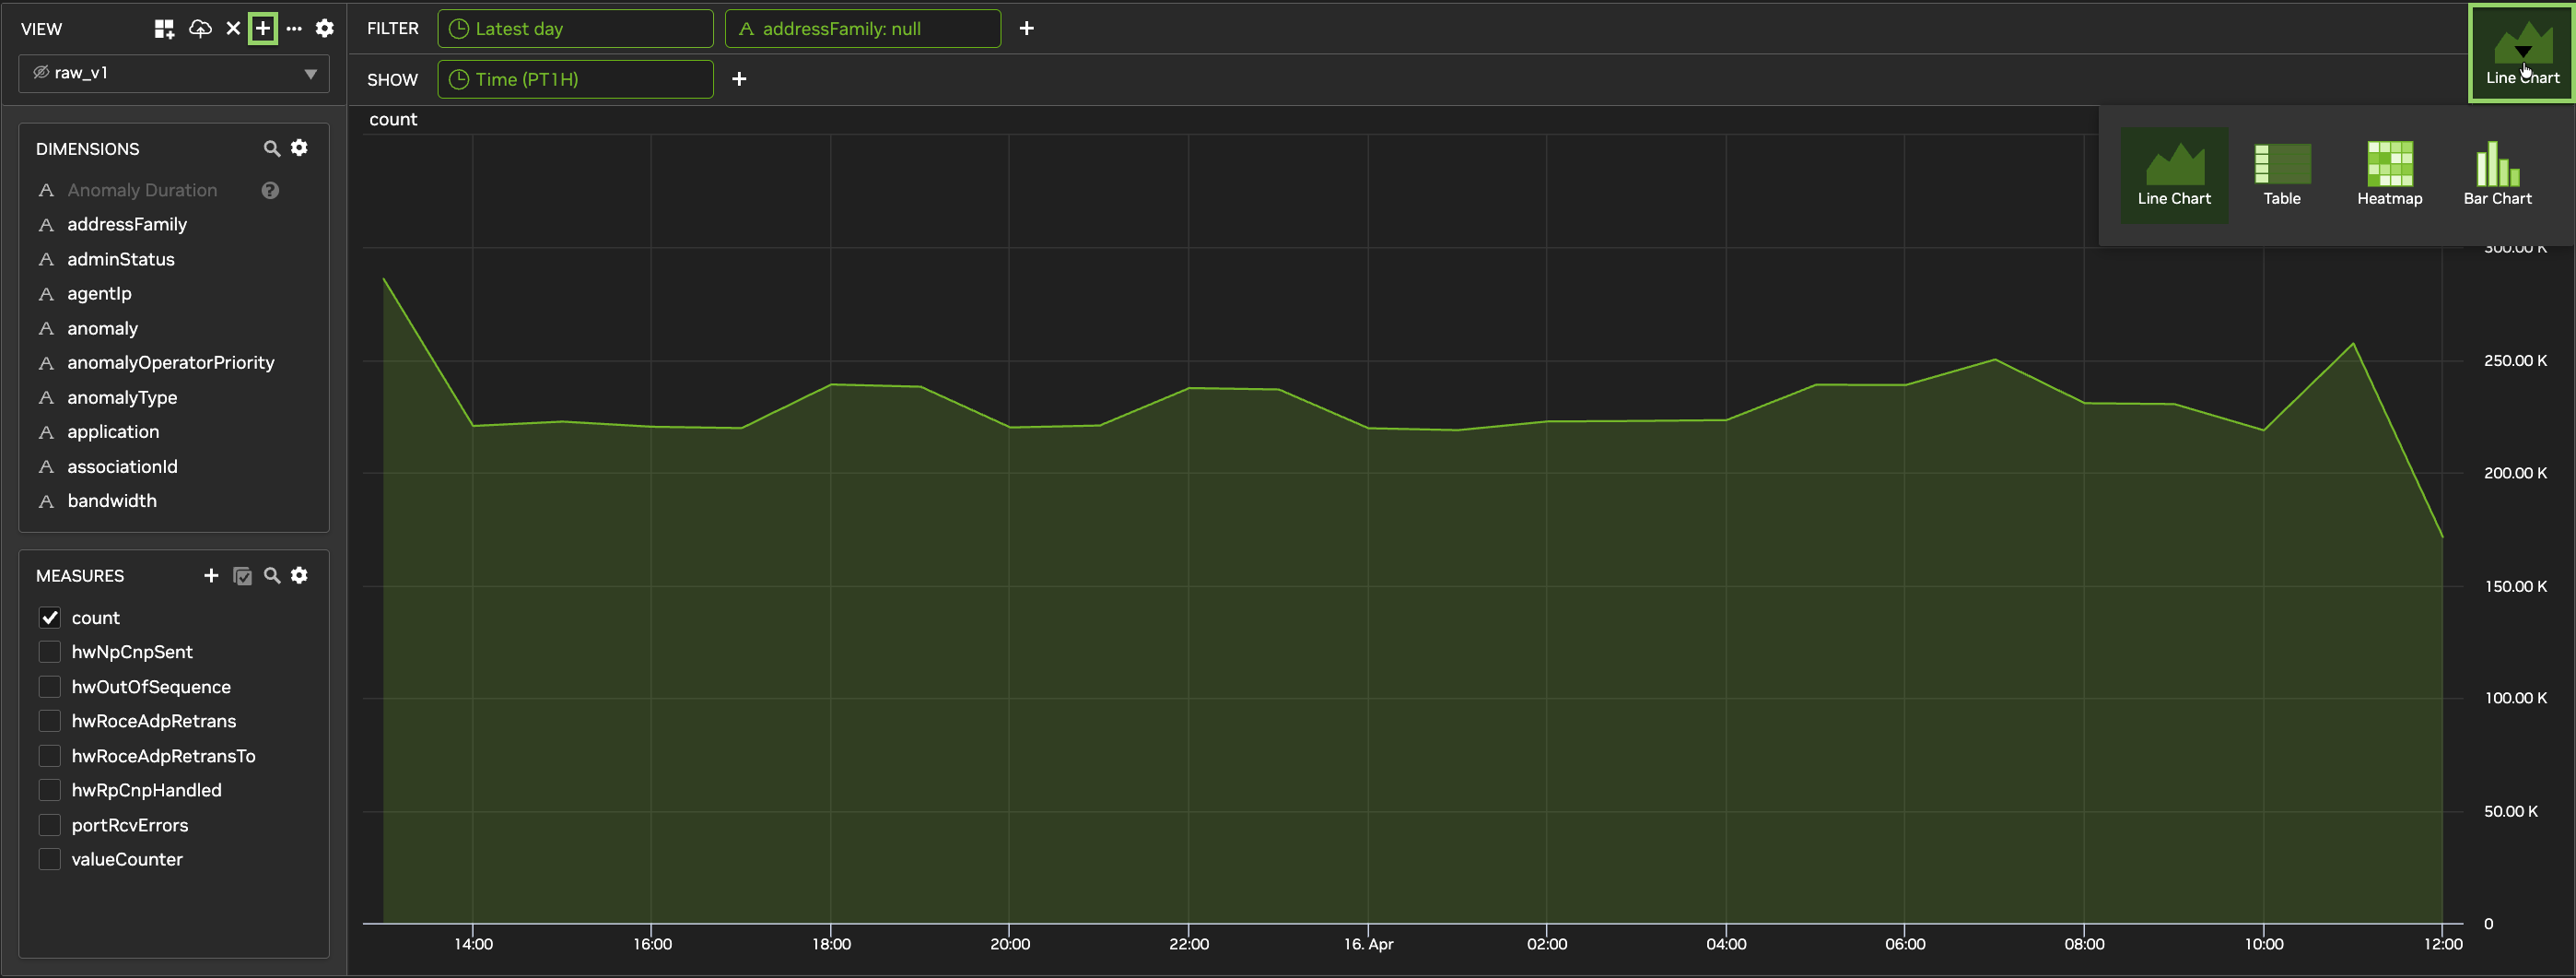
To use a logarithmic scale, click the chart's 
Heatmap
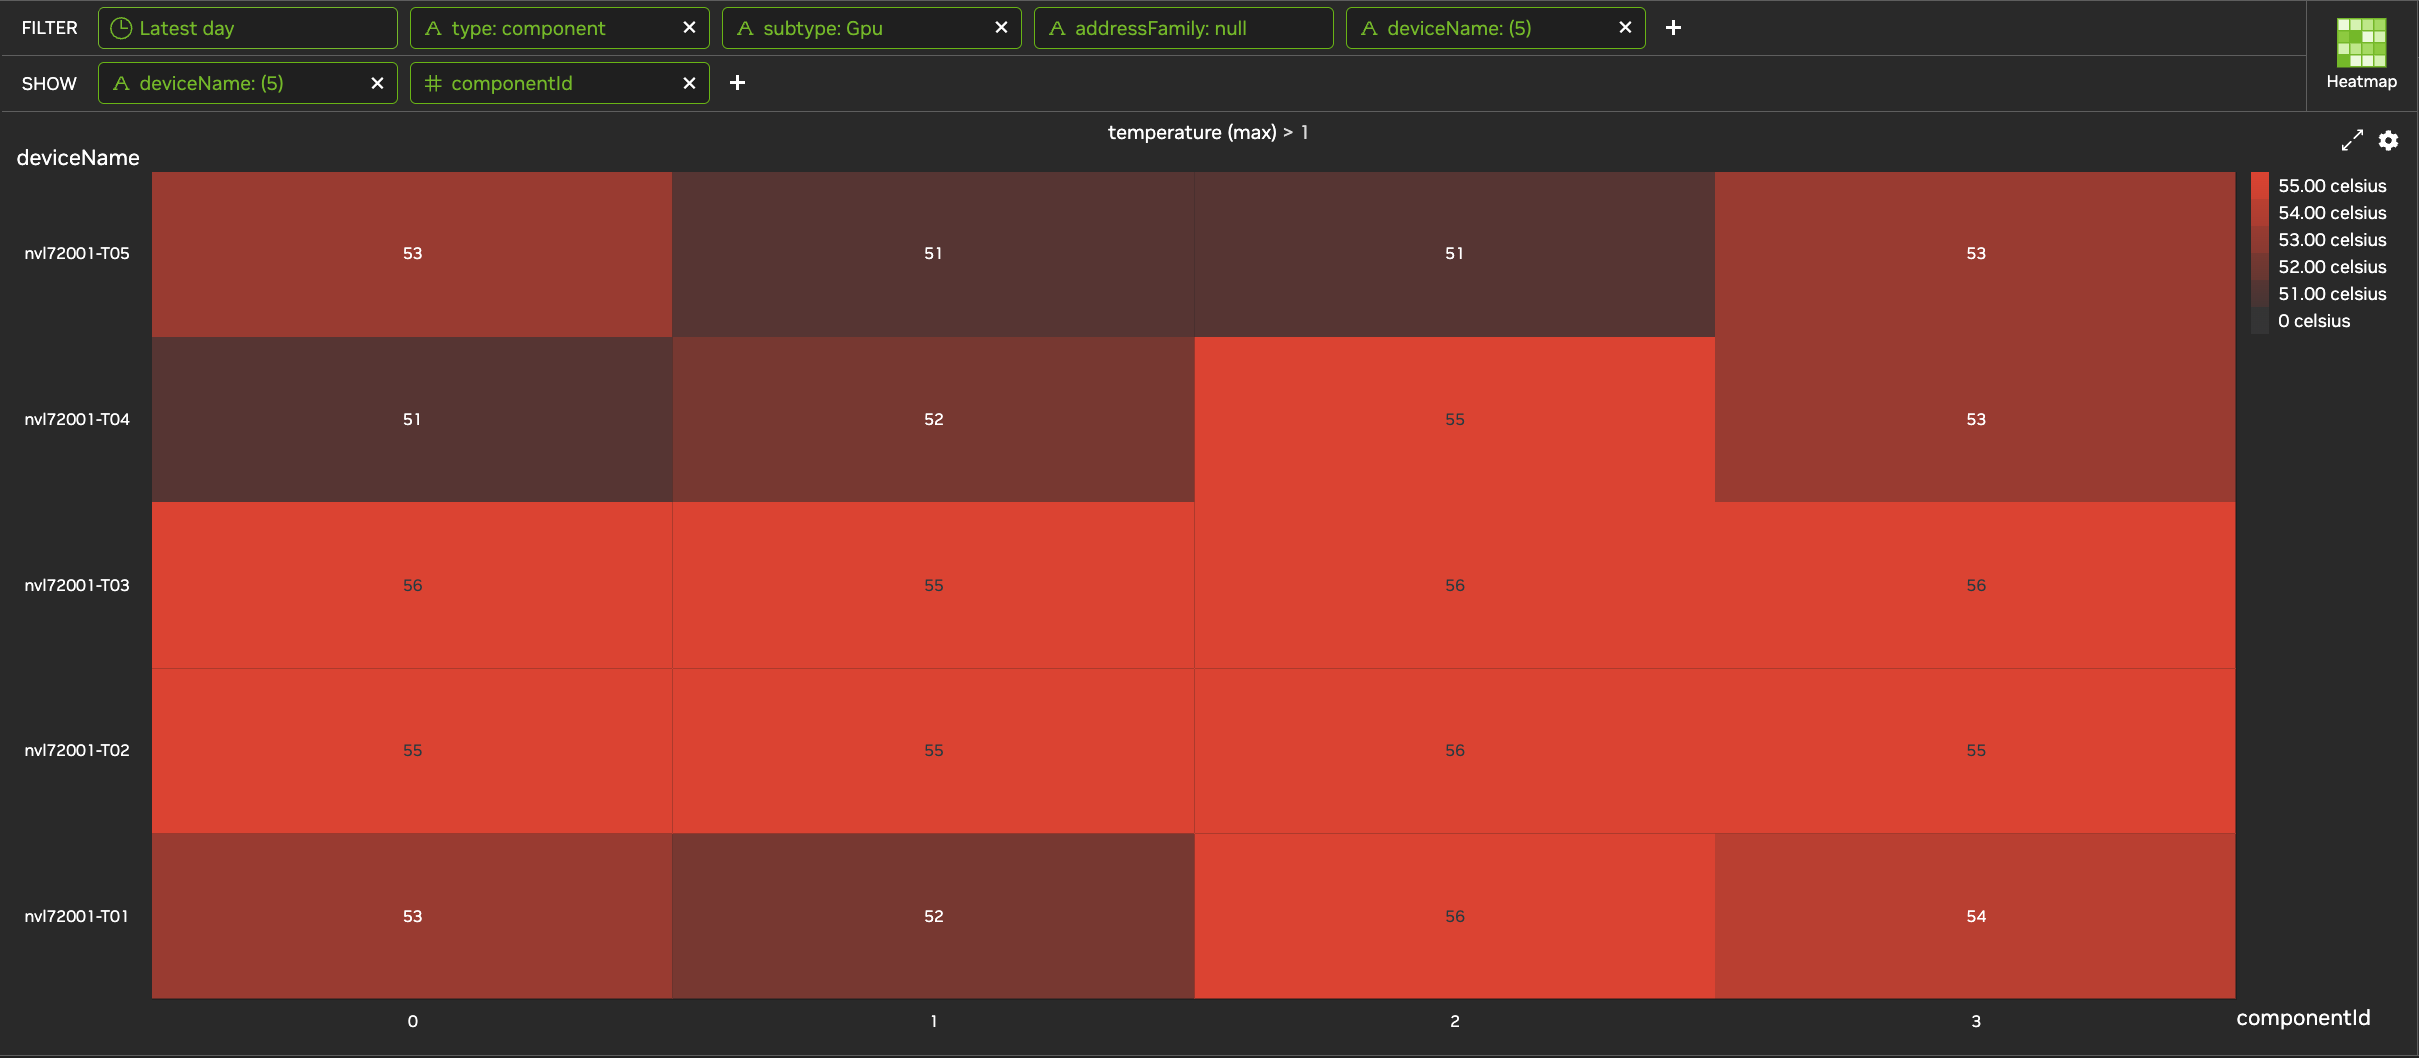
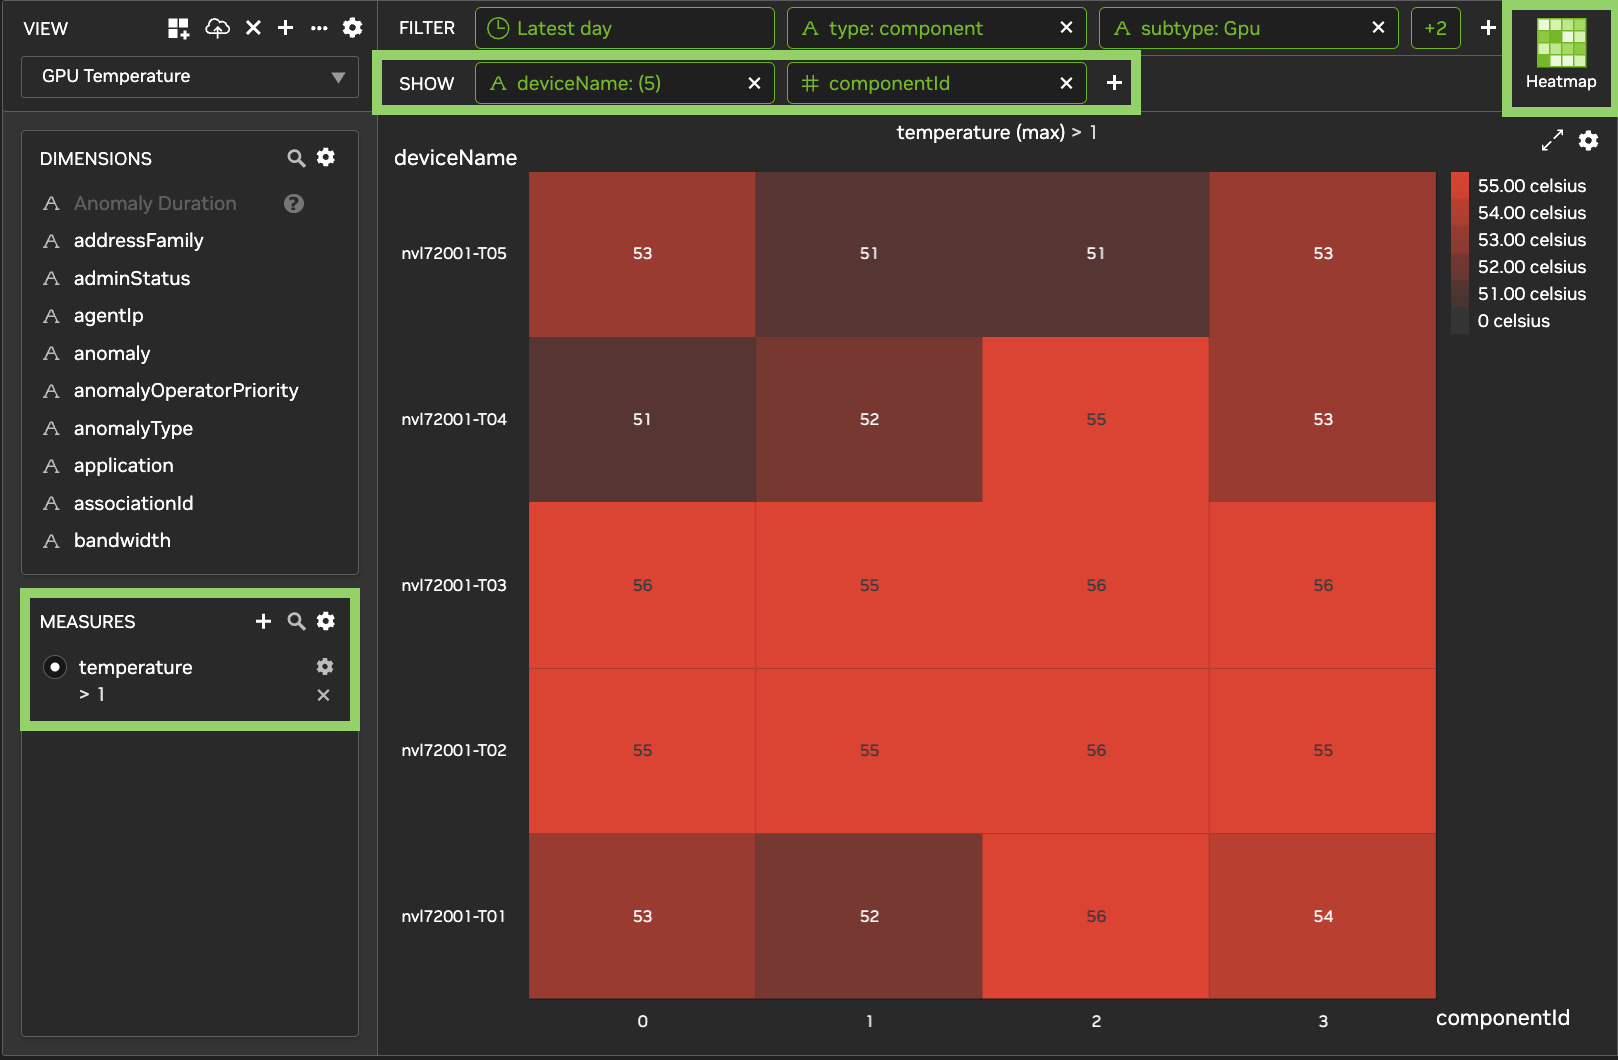
Use a heatmap to compare two dimensions, or a dimension and time, for one measure. Higher values appear in bolder colors. Hover over a cell to see its value.
For example, to show temperature for each component on each device, add deviceName and componentId in Show, and select temperature in Measures.
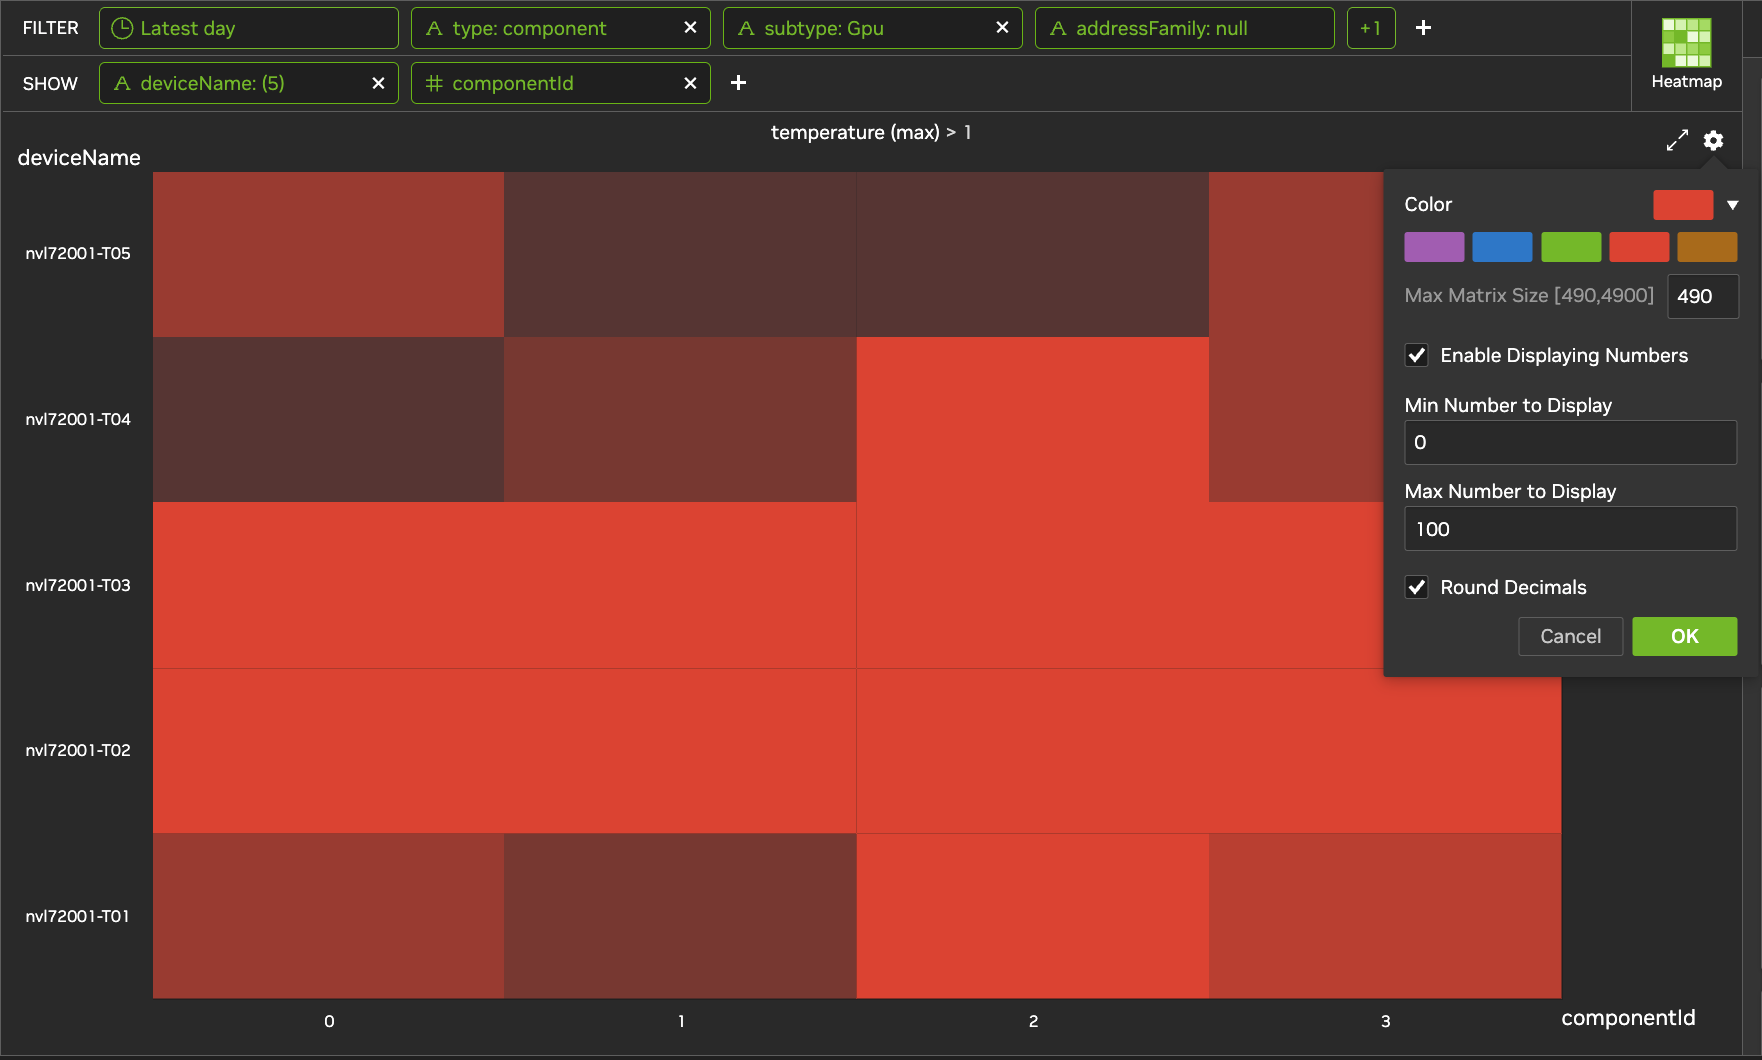
To change heatmap settings, click the heatmap's
-
Color: select a color.
-
Max Matrix Size: the largest number of cells to show, from 490 to 4,900. The default is 900. Cells beyond this limit aren't shown. Not available when Time is in Show.
-
Enable Displaying Numbers: show each cell's value. Optionally, set Min Number to Display and Max Number to Display to show values only within that range, and select Round Decimals to show whole numbers.
Click OK to apply the settings.
Table
A table shows one column for each item in Show and each selected measure. Click a column header to sort by that column.
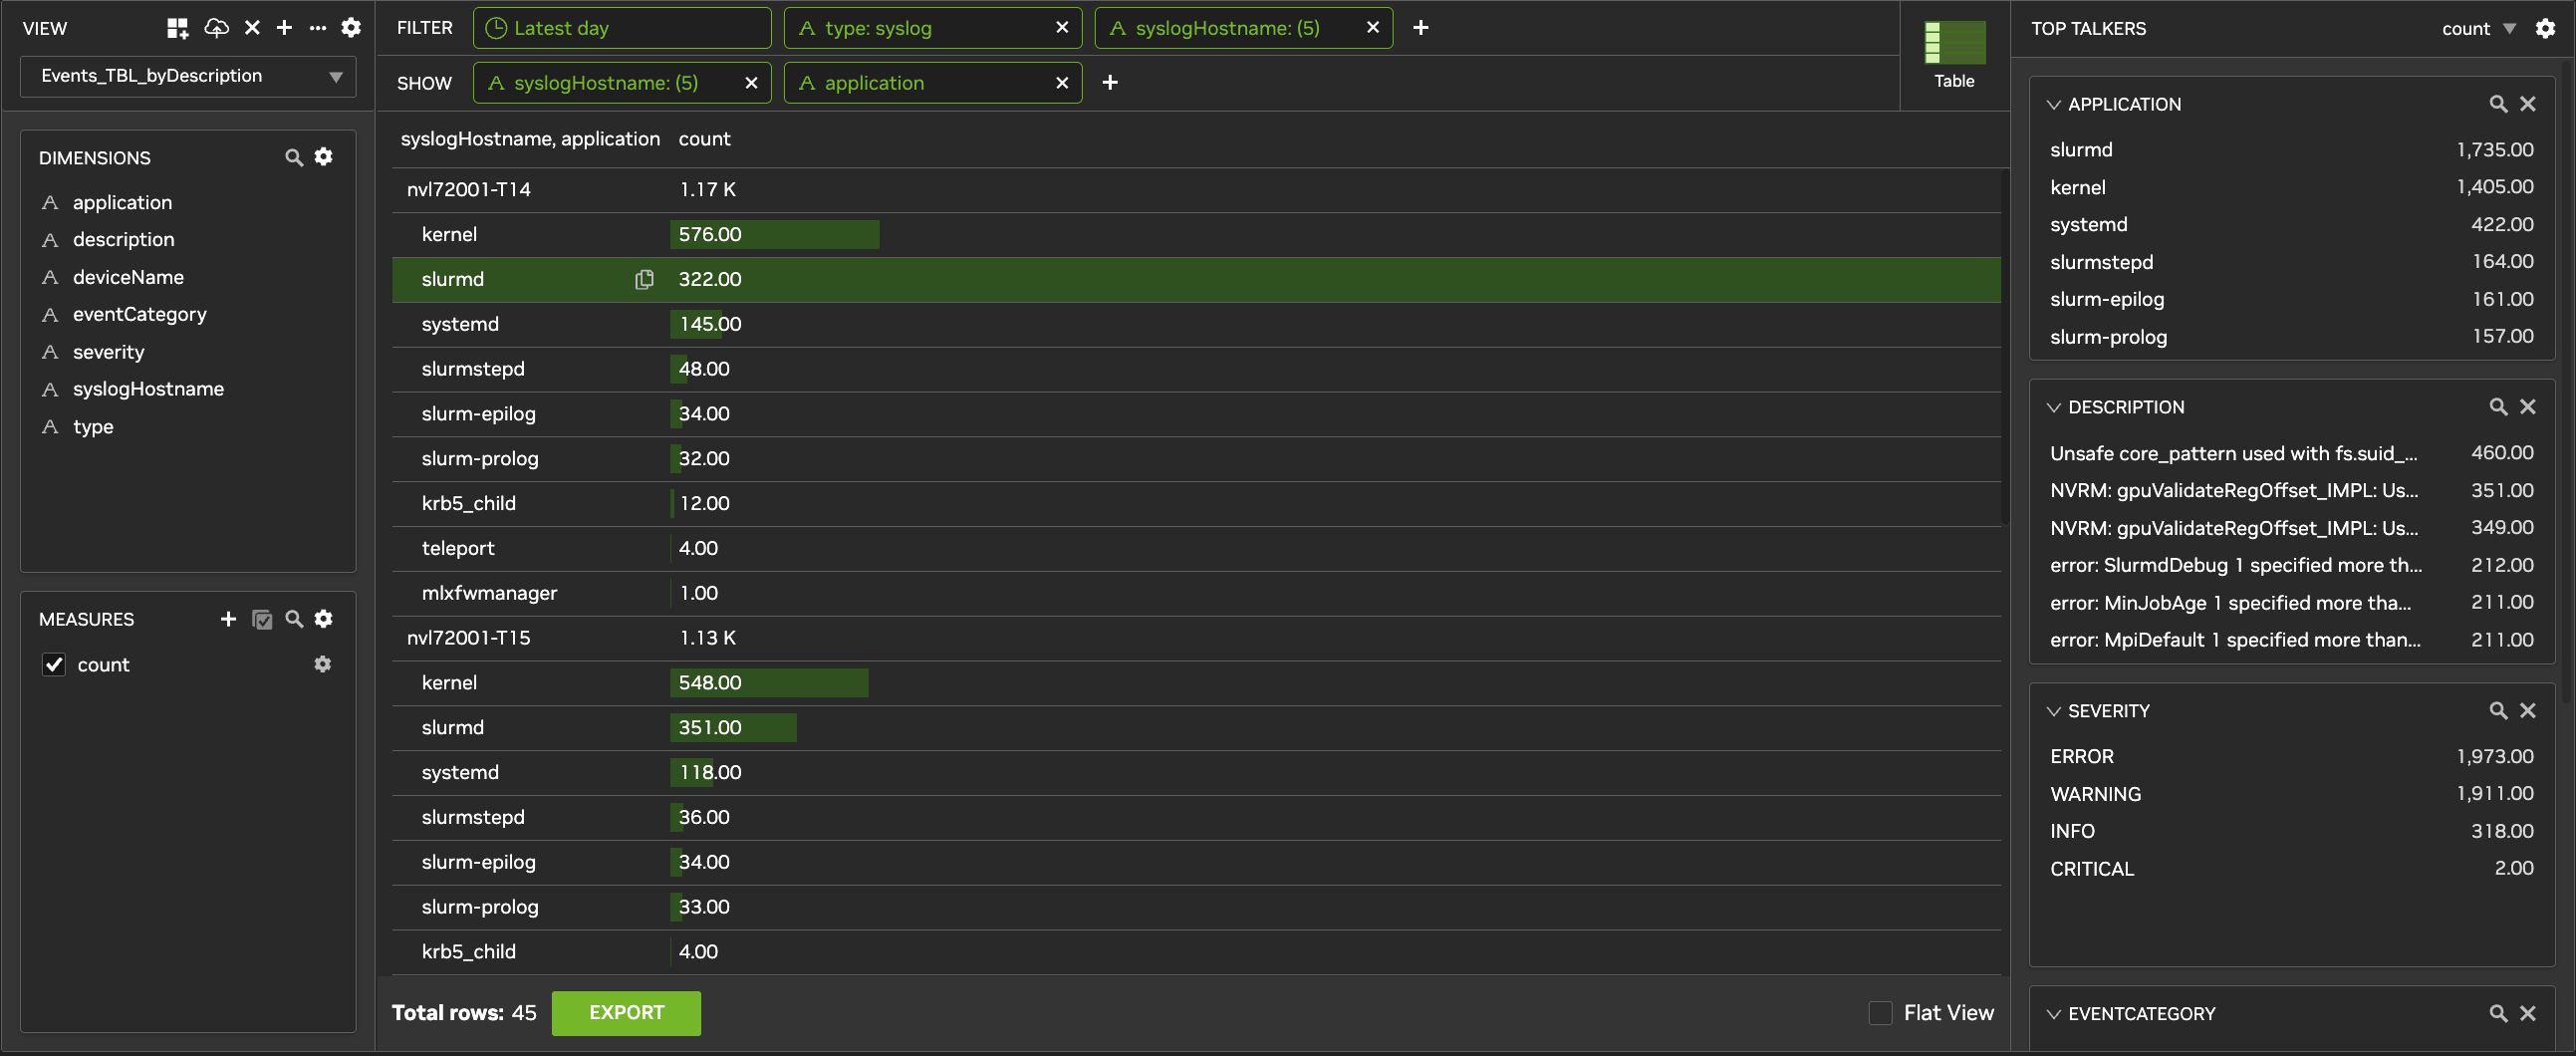
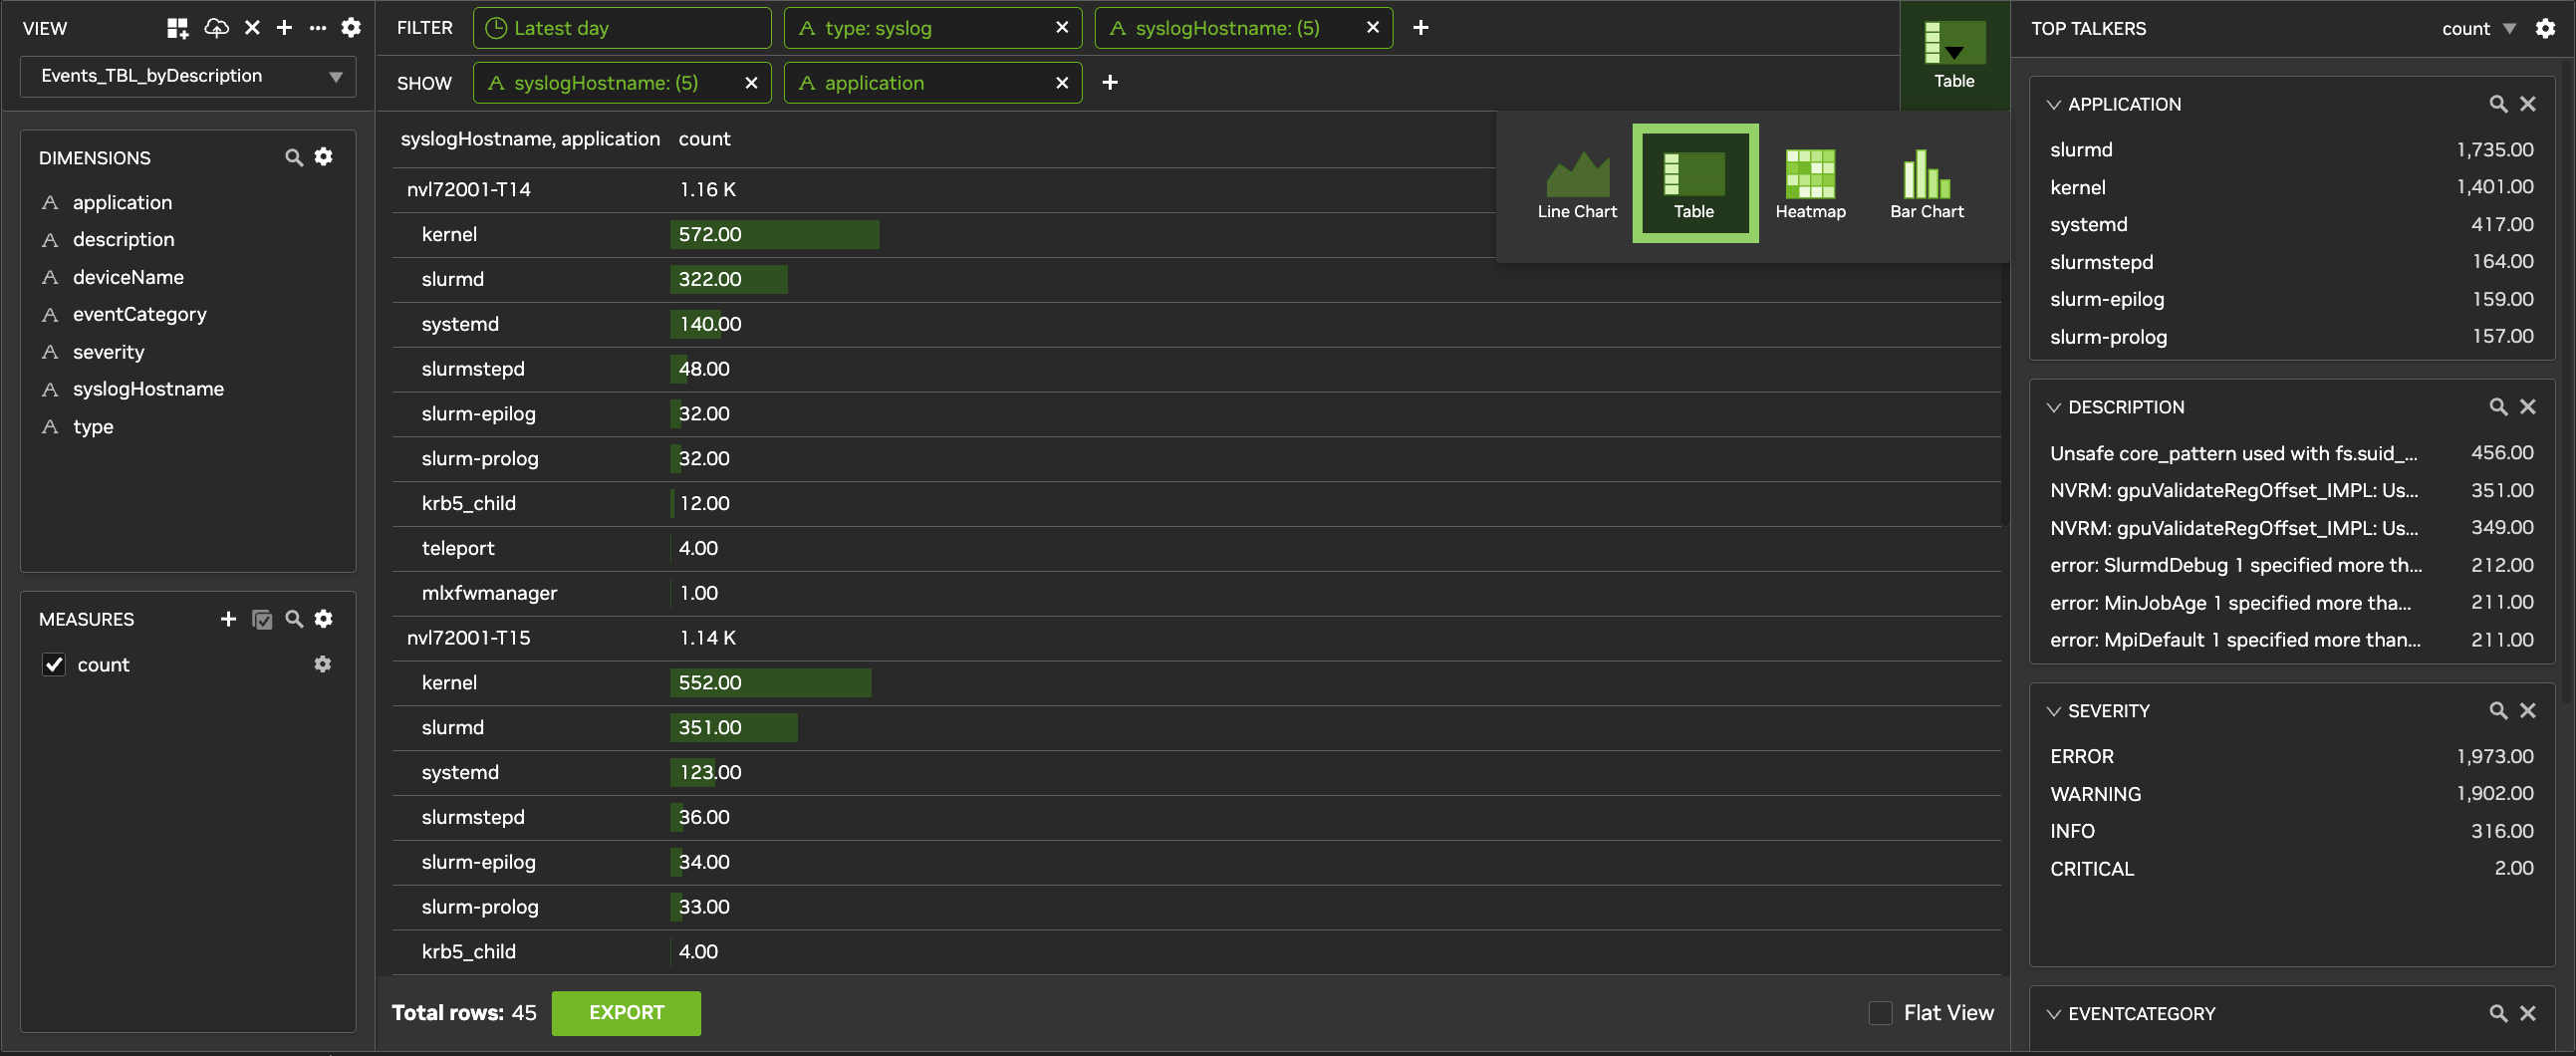
To download the table as a CSV file:
-
At the bottom of the table, click Export.
-
Select All Rows, or select First and enter the number of rows.
-
Click Download CSV.
Total rows shows how many rows the table has. If the table has more rows than can be exported, Export is unavailable. Add filters to reduce the number of rows.
Bar Chart
Use a bar chart to compare one measure across one or two dimensions. The first dimension in Show groups the data, and the second sets the bars within each group. You can also use Time with up to one dimension.
For example, add deviceName and portType in Show, and select ifOutOctetRate in Measures.
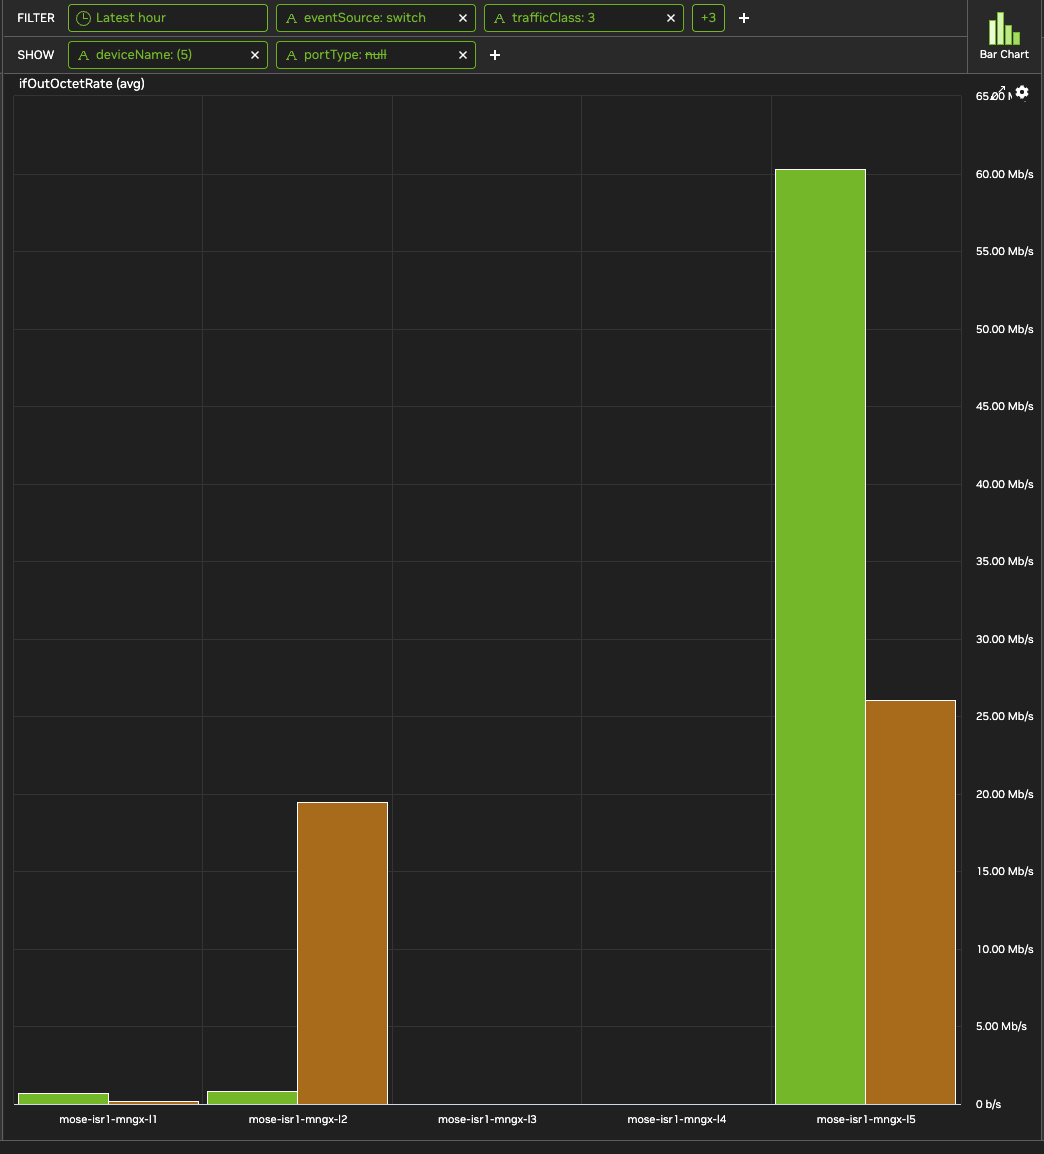
To change bar chart settings, click the chart's
-
Horizontal Mode: show bars horizontally. Not available when Time is in Show.
-
Max Bar Entries: the largest number of bars to show. The default is 1000. Not available when Time is in Show.
-
Logarithmic Scale: use a logarithmic scale.
Click OK to apply the settings.
Top Talkers
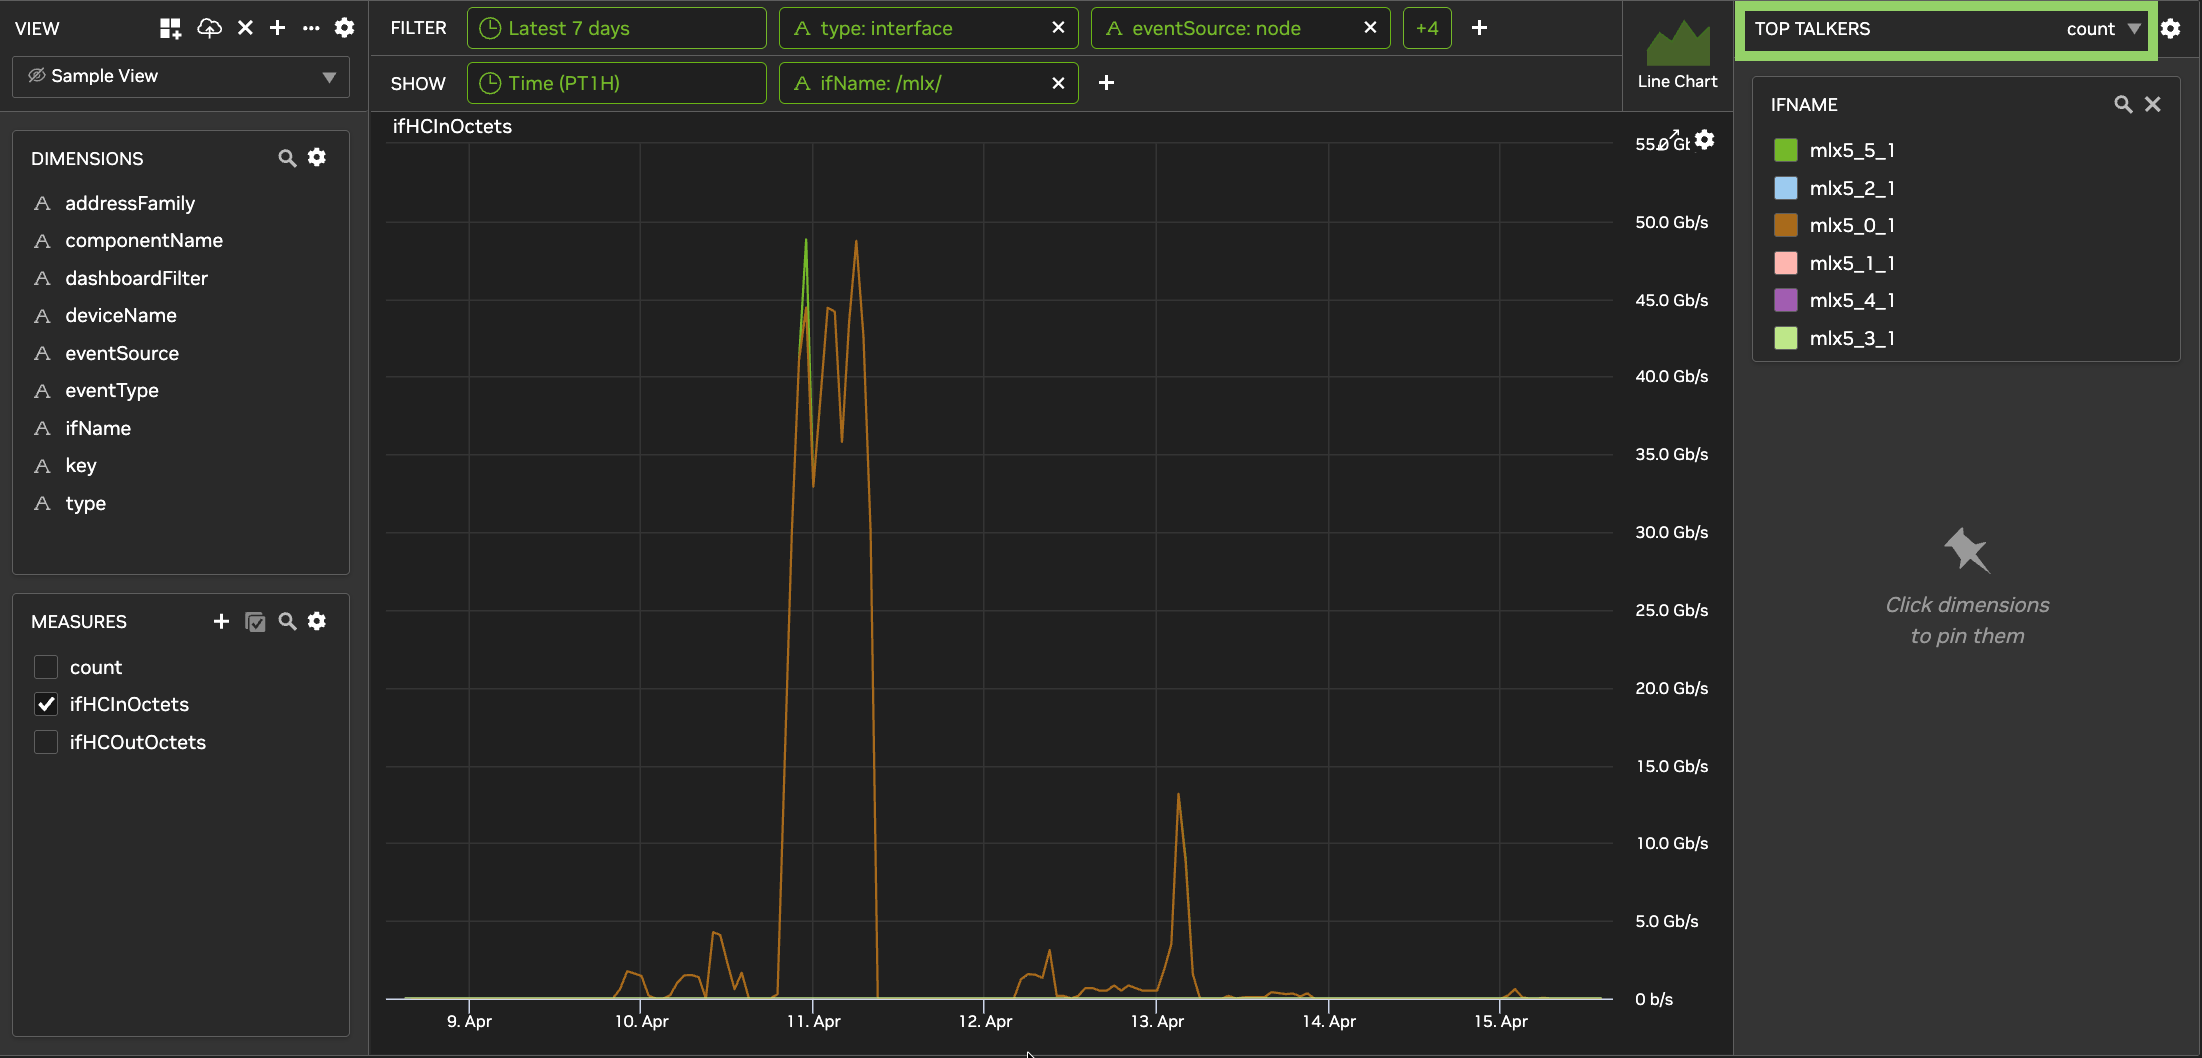
Top Talkers, on the right side of the page, ranks the values of pinned dimensions by a measure. For example, rank devices by the number of syslog messages to find a device that far outpaces its peers, or rank interfaces by dropped packets to find congestion.
-
Pin a dimension: in Dimensions, hover over the dimension and click Pin.
-
Change the measure: at the top of Top Talkers, select a measure, for example
ifHCInOctetsto rank interfaces by RX bandwidth. In a heatmap, this also changes the heatmap's measure. -
Filter the view: click a value in a dimension card.
-
Rearrange cards: drag a card to move it, or click the X on a card to remove it.
View Settings
In the View panel, click the settings icon to change the view's settings, and then click OK:
-
Notifications: send notifications from the view. See Enable Notifications on a View.
-
Auto Update, seconds: how often the chart refreshes, for time ranges such as Latest 6 hours.
-
Auto-Correlation and Default View: show whether these are on for the view. Change them in Settings > System Configuration.
-
Data Sources: the view's data sources.
-
Dashboards: the dashboards that include the view.
Ask Sherlock About a View
To ask Sherlock about the chart on screen, click the Sherlock icon (Ask Sherlock about this visualization) in the lower-right corner of the Trends page. Then type a question, for example "Summarize this visualization." Sherlock answers from a snapshot of the view, including its filters, measures, and time range. To see the snapshot Sherlock used, click View Trends snapshot. If you change the chart and ask again, Sherlock uses the updated chart. If you open a different view, the conversation closes. Sherlock can't change the view itself.
The Sherlock icon appears only when Sherlock is turned on (see Configure an On-Premises LLM), you have access to Ask Sherlock, and the view uses one of these data sources: interface_v1, interface_nvlink_v1, system_v1, raw_v1, or syslog_v1.
To keep investigating, click Expand to Ask Sherlock page after your first question. The conversation continues on the Ask Sherlock page and stays linked to the view. See Ask Sherlock About a Trends View.
Last updated: