
NVIDIA Minerva flags an anomaly when incoming telemetry deviates significantly from a learned baseline. Baselines are built continuously from time-series data and log streams.
Anomalies appear after anomaly detection is configured and has received data. See Enable Anomaly Detection. Until then, the Anomalies page shows "This view is inactive and can't be displayed."
Log-Based Anomalies
Analyzes text streams (for example, syslogs) for issues that metrics alone might miss.
|
Type |
How it works |
|---|---|
|
Zero Day Log Anomalies (Unsupervised) |
NLP identifies rare or never-before-seen log patterns, useful for novel bugs or unexpected hardware failures |
|
Collective Learning (Supervised) |
Flags high-impact events based on known error signatures, for example, GPU XID errors, PCIe AER errors |
Metric-Based Anomalies
Analyzes numerical data for performance or hardware health deviations.
|
Type |
How it works |
|---|---|
|
Individual Anomalies |
Detects spikes or dips relative to a component's own historical baseline |
|
Group Anomalies |
Compares one component (for example, a single GPU) against its peers to identify behavioral outliers |
Examples
Network and Fabric Health
-
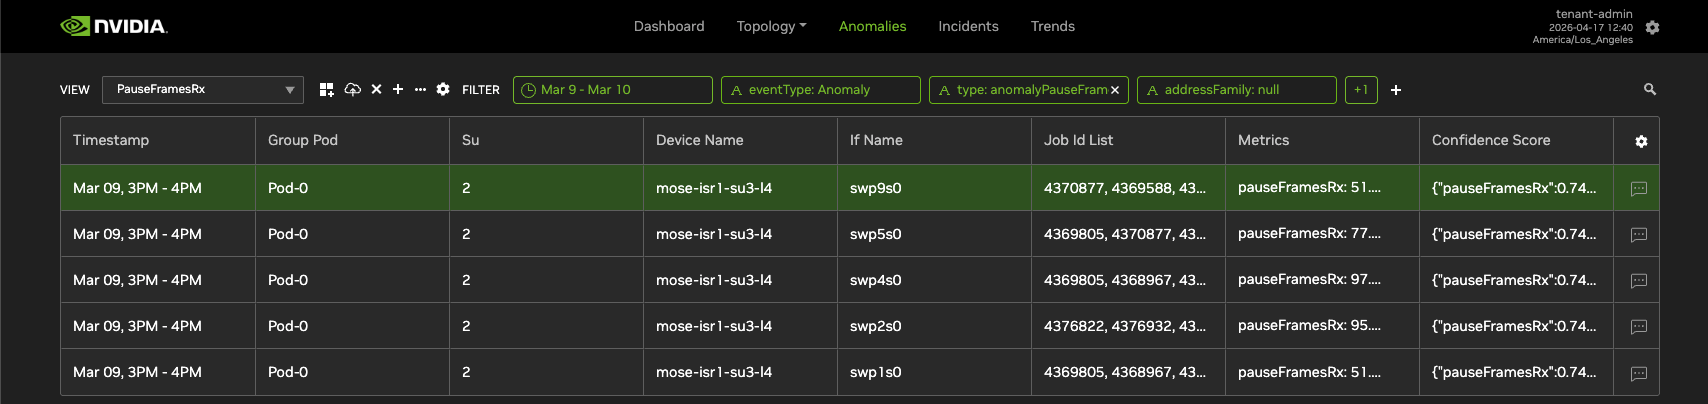
Pause Frames RX (
pauseFramesRX): detects an abnormal surge in pause frames on NIC-facing switch interfaces. Use this to identify a straggler node that is slowing fabric throughput for the whole cluster.
-
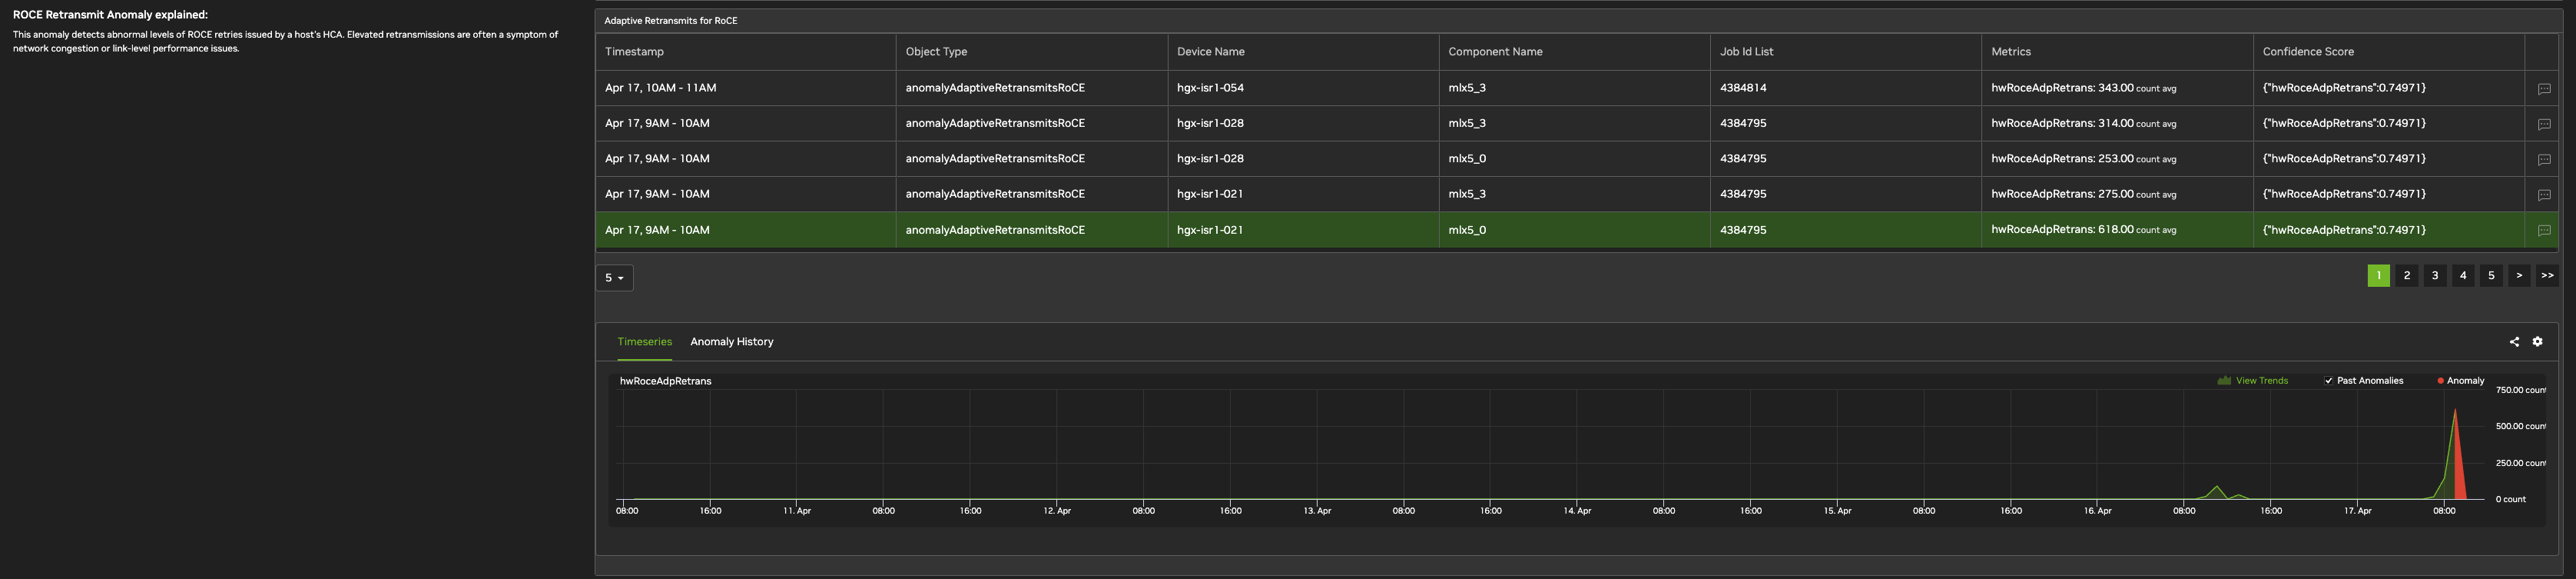
RoCE Adaptive Retransmits (
hwRoceAdpRetrans): detects abnormal retry rates from a host's HCA. Helps distinguish transient noise from sustained congestion.
Hardware and System Health
-
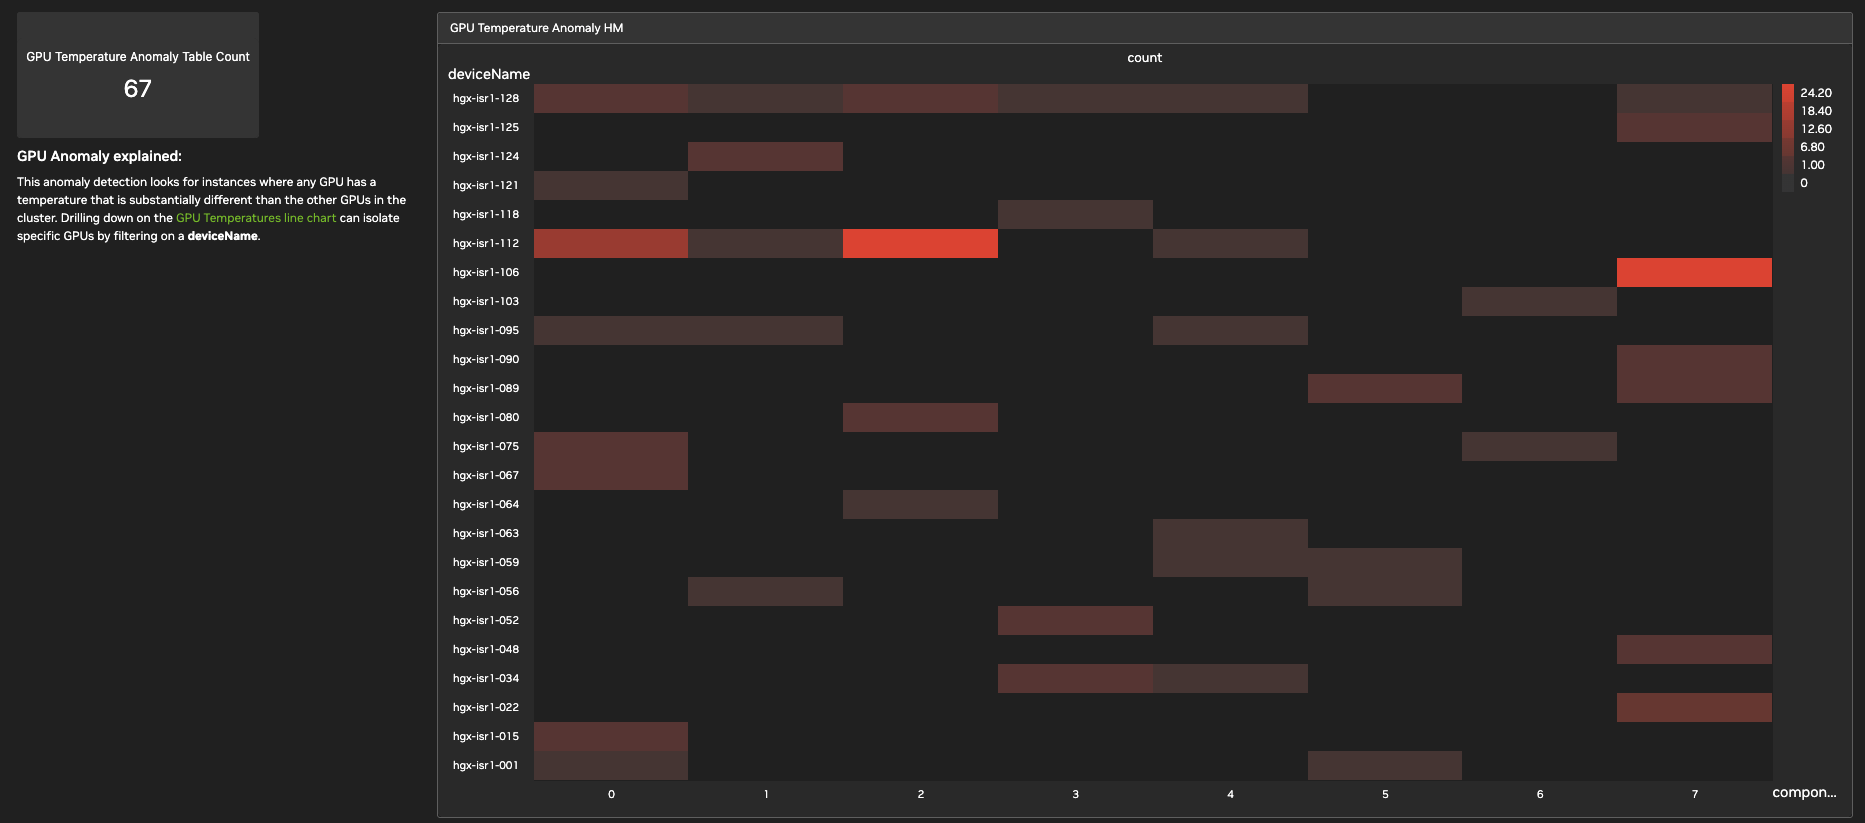
GPU Temperature (Peer Comparison): identifies GPUs with a thermal profile substantially different from peers running the same workload. Locates nodes with cooling issues or localized hardware defects.
-
Syslog Rates (Log Storms): detects sudden surges in log volume generated by a host. Detects software loops or misconfigured applications flooding system resources.
Anomaly Terminology
|
Term |
Definition |
|---|---|
|
Base Type |
The most granular entity being modeled, for example, |
|
Instance Key |
Globally unique identifier for a specific component, for example, |
|
Aggregate Object |
Defines how data is grouped and which algorithm is applied, for example, grouping all GPU temperatures across a pod to find outliers |
|
Confidence Score |
Probability (0–1) that a deviation is a true anomaly. Some anomalies have a separate score for each measure. In that case, the Confidence Score cell lists one score per measure. |
Anomalies Page Layout
-
View: select a view, and create, save, and manage views. The controls are the same as on Trends. See Manage Views.
-
Filter: the time range and filters that limit which anomalies appear. See Filter Anomalies.
-
Anomaly table: one row for each anomaly. See Anomaly Table.
-
Anomaly details: charts and history for the selected anomaly, below the table. See Anomaly Details.
-
Sherlock: ask Sherlock about the selected anomaly. See Ask Sherlock About an Anomaly.
Create and Save an Anomalies View
-
In the View panel, click + (Create). The new view starts as a copy of the current view.
-
Enter a View Name and click OK. View names must be unique. The view is private. To make it visible to all users in the tenant, select Publish (visible to all users).
-
Set the time range and filters, and adjust the table columns.
-
In the View panel, click Save.
Changes to the filters, time range, and table columns aren't kept until you click Save. Admins and Editors can create and save views. Viewers can use views but cannot save changes.
Filter Anomalies
The Filter row sets which anomalies the view shows:
-
Time range: click the time chip, for example Latest day, and choose a time range.
-
Filters: click + and select a dimension to filter on, for example
deviceNameoreventType.
To find a loaded anomaly by its ID, use the search box. When new anomalies arrive during a Latest time range, New entries found appears. Click the refresh icon to load them.
Anomaly Table
By default, the table shows Timestamp, Device Name, Application, Severity, Description, Remediation, and Job Id List, with the newest anomaly first. The Timestamp column shows the time window of the anomaly.
-
Sort: click a column header. Sorting applies to the rows already loaded.
-
Add or remove columns: click the table's settings icon and select columns under Columns. At least one column must stay selected.
-
Rearrange columns: drag a column header to move it, or drag its edge to resize it.
To give feedback on an anomaly, use the icon at the right end of its row. See Give Anomaly Feedback.
Anomaly Details
Select a row to see its details below the table. The first row is selected when the page opens.
-
Timeseries: the measure over time, with the anomaly highlighted. To show earlier anomalies on the chart, select Past Anomalies. To open the data in Trends, click View Trends.
-
Anomaly History: earlier anomalies for the same object.
Event anomalies don't have the Timeseries and Anomaly History tabs.
To copy a link to the anomaly, click Share Link. To change the chart, click its settings icon, turn on Logarithmic Scale or choose how much Previous Data to show (from 1 minute to 30 days), and click OK.
Notifications on an Anomalies View
Admins and Editors can send notifications from an Anomalies view. Open the view's settings in the View panel and turn on Notifications. See Enable Notifications on a View. Before you turn on notifications, add an eventType filter to the view. Without one, notifications are turned off when you save the view.
Troubleshooting and Remediation
NVIDIA Minerva provides "Rare Log" anomalies that generate remediation guidance, including step-by-step workflows to diagnose and fix issues. The guidance appears in the Remediation column of the anomaly table. You can adjust these configurations by editing the anomaly-detection.json file. See Enable Anomaly Detection.
Ask Sherlock About an Anomaly
Select an anomaly, and then type a question in the Ask Sherlock about this row box below the anomaly details, for example "Explain this anomaly." Sherlock answers about the anomaly you selected. If you select a different anomaly, a new conversation starts. The Sherlock box appears only when Sherlock is turned on and you have access to Ask Sherlock. See Ask Sherlock About an Anomaly.
Last updated: