

The Telemetry Health Dashboard verifies that expected telemetry data is reaching the NVIDIA Minerva platform.
|
Persona |
Primary Use Case |
|---|---|
|
Infrastructure / DC Ops |
Verify that all physical switches and nodes are reporting telemetry and identify gaps in cabling or agent connectivity. |
|
System Administrators |
Confirm that OTLP, syslog, and gNMI streams are active across the fleet to ensure no blind spots exist in monitoring. |
|
Tenant Admins |
Audit the total inventory of managed assets, including the specific breakdown of NVLink, NVSwitch, and NIC metrics. |
Dashboard Overview
Unlike other dashboards that emphasize fabric errors, the Telemetry Health dashboard monitors the presence and volume of telemetry data. It aggregates counts of detected devices and interfaces over a specified time range (default: one hour). If a device remains physically present but its count decreases to zero, this indicates a potential failure in the telemetry export or ingestion process.
Device Sources
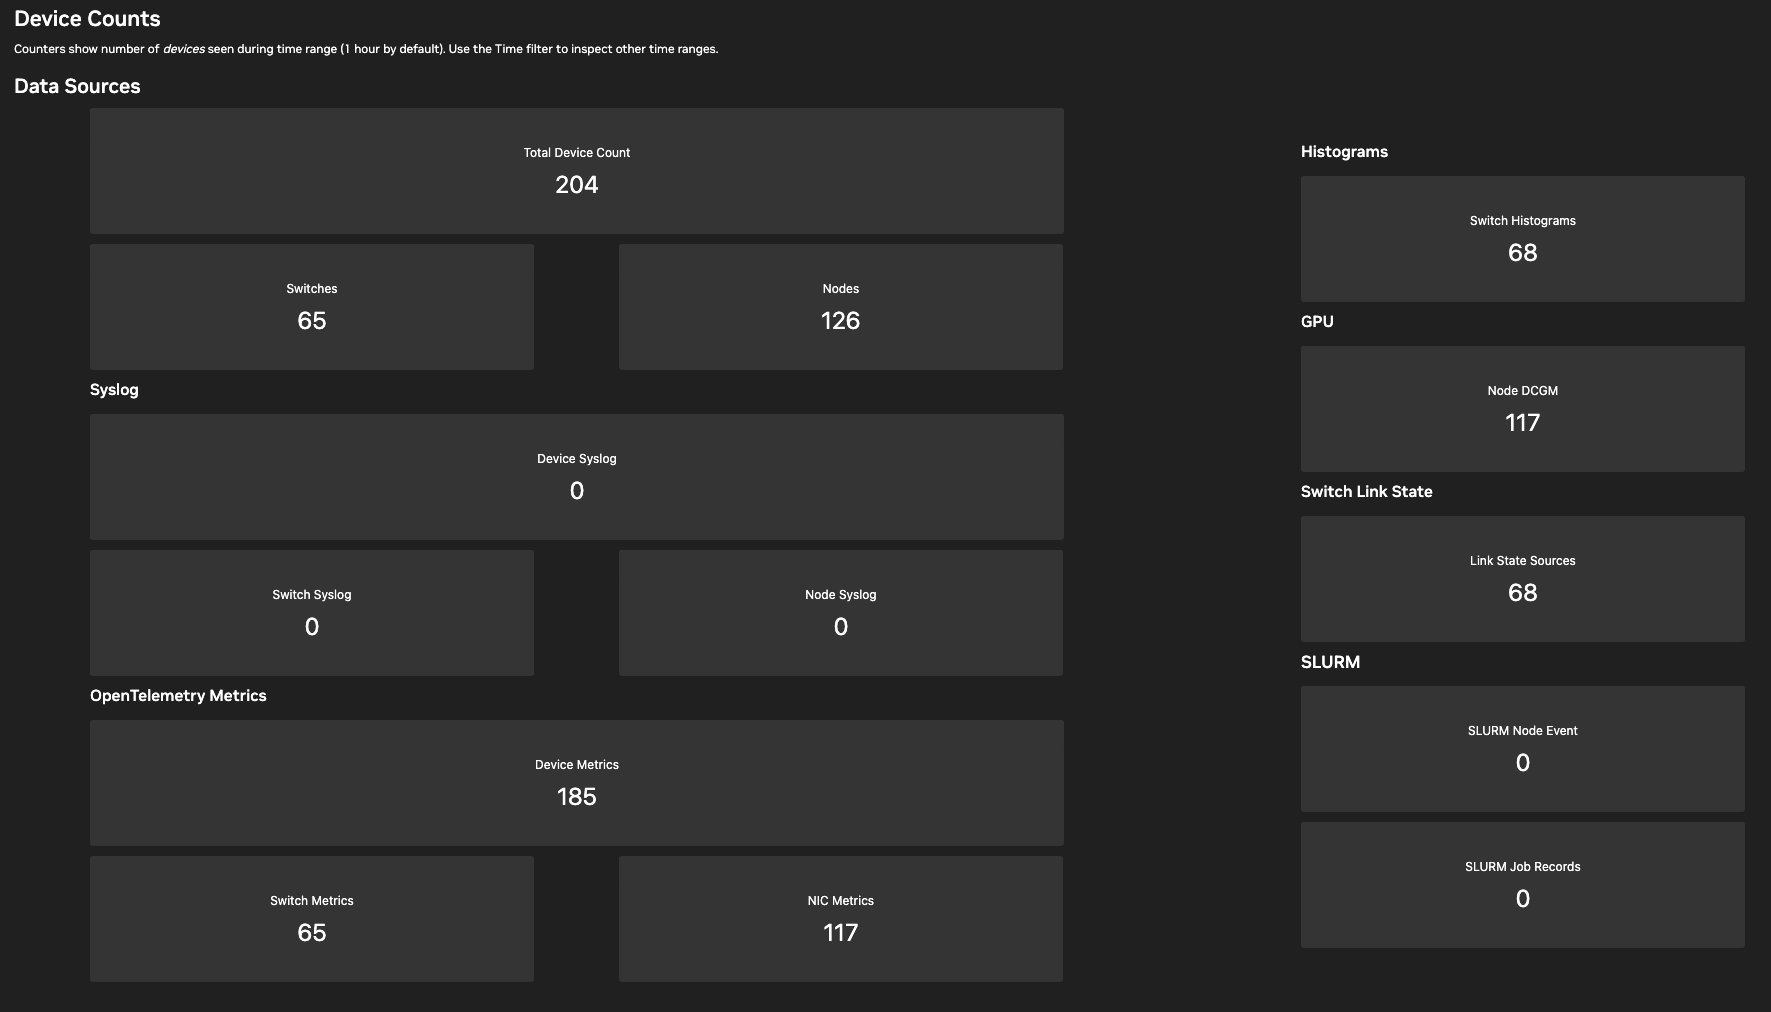
These summary tiles provide a global view of the devices reporting to NVIDIA Minerva in the cluster.
-
Total Device Count: The aggregate number of unique hardware assets (switches and nodes).
-
Switches: Counts NVSwitch and Ethernet switches sending data.
-
Nodes: The number of compute hosts or worker nodes currently sending data.
-
OpenTelemetry Metrics: Monitors the health of OTLP streams, broken down by device, switch, and NIC levels.
-
Node DCGM: Tracks the availability of NVIDIA Data Center GPU Manager (DCGM) metrics, which are essential for GPU-level health monitoring.
-
Syslog: Counters for device, node, and switch system logs to ensure event-based alerting is active.
-
SLURM Records: Tracks the ingestion of job and node events from the workload scheduler.
-
Switch Histograms and Link States: Validates that advanced switch telemetry — such as buffer utilization and physical state changes — is being captured.
Interface Counts
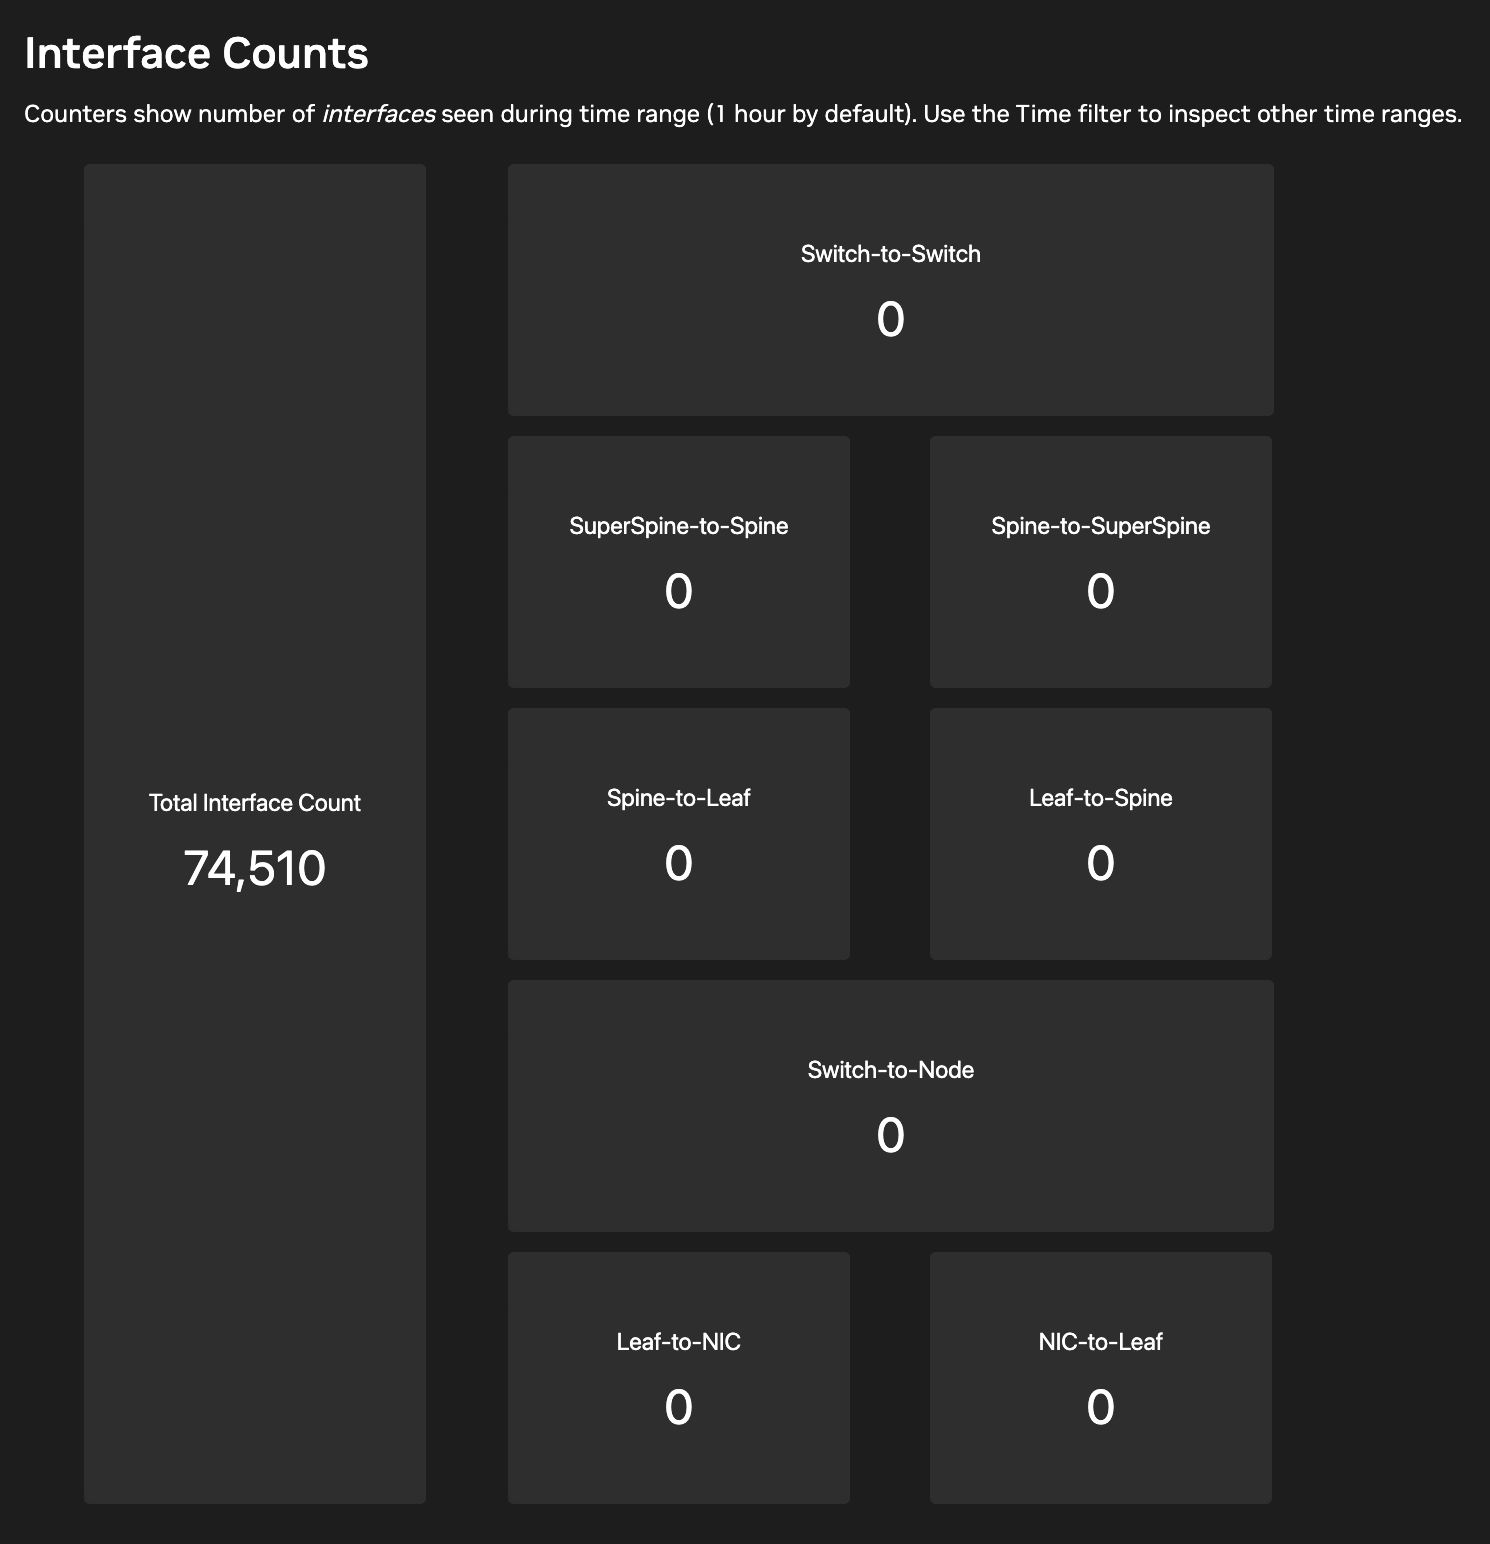
A granular breakdown of the logical and physical connections detected within the cluster topology.
-
Total Interface Count: The sum of all ports and logical interfaces being monitored.
-
Switch-to-Node: High-speed links connecting the fabric to the compute resources.
-
Leaf-to-NIC / NIC-to-Leaf: Specific breakdown of edge connectivity to ensure host-side networking is reporting correctly.
-
Fabric Links: Includes switch-to-switch, spine-to-leaf, and super spine-to-spine counters to validate the core backbone.
Last updated: